

Abstract
Heavy drinkers show an increased attentional bias to alcohol-related stimuli compared to moderate drinkers, and this bias is thought to promote motivation for alcohol consumption (Field & Cox, 2008). Studies have begun to examine acute alcohol effects on attentional bias, however little is known regarding how these effects might differ based on drinker type. Further, the degree to which attentional bias in response to alcohol is associated with excessive alcohol consumption remains unexplored. For the current study, 20 heavy drinkers and 20 moderate drinkers completed a visual probe task in response to placebo and two active doses of alcohol (0.45 g/kg and 0.65 g/kg). Participants’ eye-movements were monitored and attentional bias was calculated as the difference in time spent focused on alcohol compared to neutral images. Participants’ alcohol consumption was assessed by a timeline follow-back calendar and a laboratory ad lib consumption task. Results showed that heavy drinkers displayed significantly greater attentional bias than did moderate drinkers following placebo. However, heavy drinkers displayed a dose-dependent decrease in attentional bias following alcohol, whereas the drug had no effect in moderate drinkers. Individual differences in attentional bias under placebo were strongly associated with both self-reported and laboratory alcohol consumption, yet bias following alcohol administration did not predict either measure of consumption. These findings suggest that attentional bias is strongest before a drinking episode begins. As such, an attentional bias might be most influential in terms of initiation of alcohol consumption, and less of a factor in promoting continued consumption within the drinking episode.
Keywords: attentional bias, alcohol, heavy drinkers
Introduction
Binge drinking is highly prevalent among young adults, with almost half of college students reporting binge drinking in epidemiological studies (Marczinski, Grant, & Grant, 2009). Binge drinking is associated with numerous negative consequences, including unsafe sexual activity, assault, injury, and automobile accidents (Flowers et al., 2008; Presley & Pimentel, 2006; Wechsler, Davenport, Dowdall, Moeykens, & Castillo, 1994; Wechsler, Dowdall, Davenport, & Castillo, 1995; Wechsler & Nelson, 2001). As such, understanding personal characteristics that lead certain individuals to binge drink has been of long-standing interest. For the most part, this research has focused on relatively stable factors that might predispose an individual to heavy alcohol use, such as personality traits or genetic make-up (e.g., Dick & Bierut, 2006; Sher, Grekin, & Williams, 2005). However, in recent years there has been a burgeoning interest in how acute effects of alcohol itself might serve to promote binge drinking. For instance, studies have shown that binge and non-binge drinkers differ in terms of their subjective and behavioral responses to alcohol, with binge drinkers experiencing more stimulation and displaying greater disinhibiting effects from alcohol (Fillmore, 2003; Fillmore, 2007; Holdstock, King, & de Wit, 2000; Marczinski, Combs, & Fillmore, 2007; Quinn & Fromme, 2011; Rose & Grunsell, 2008; Weafer & Fillmore, 2008). Such increased stimulation and disinhibition from alcohol could be important factors contributing to excessive consumption in binge drinkers.
Another means by which the acute effects of alcohol could promote binge drinking involves the ability of the drug to increase the drinker’s selective attention to alcohol-related cues in the drinking situation (e.g., Field & Cox, 2008; Field, Wiers, Christiansen, Fillmore, & Verster, 2010). Theoretical accounts highlighting the importance of such an “attentional bias” rely heavily on the incentive-sensitization theory of Robinson and Berridge (1993, 2001). The theory posits that drugs of abuse have the ability to produce neuroadaptations in incentive motivation and reward systems, causing these systems to become hypersensitive to both drugs and drug-related stimuli. Over a prolonged period of use, substance-related cues come to be associated with drug consumption and the ensuing incentive-motivational and rewarding effects of the drug through classical conditioning. As a result, drug-related stimuli become increasingly salient for users, receiving greater attention when they are encountered in the environment. Moreover, drug-related cues take on high incentive-motivational properties themselves, eliciting increased motivation for drug-seeking and drug-taking. In terms of alcohol abuse, attentional bias is thought to reflect increased incentive motivational value of alcohol acquired through a history of heavy alcohol use (Field & Cox, 2008; Ryan, 2002). As such, alcohol cues themselves come to elicit motivation to consume alcohol. For this reason, evidence of attentional bias to such cues might be of clinical significance because of its potential to contribute to abusive patterns of consumption and ultimately to alcohol dependence.
Attentional bias has been studied extensively in sober individuals, and findings provide consistent evidence for greater attentional bias in heavy drinkers compared with light drinkers (Field, Christiansen, Cole, & Goudie, 2007; Murphy & Garavan, 2011; Sharma, Albery, & Cook, 2001; Tibboel, De Houwer, & Field, 2010; Townshend & Duka, 2001). Attentional bias also predicts individual differences in level of consumption and alcohol problem severity in both social drinkers (Ceballos, Komogortsev, & Turner, 2009; Fadardi & Cox, 2008; Miller & Fillmore, 2010; Murphy & Garavan, 2011) and alcoholics (Jones, Bruce, Livingstone, & Reed, 2006). There is also some emerging experimental evidence in support of a causal role of attentional bias in alcohol consumption. For instance, studies have shown that attentional biases can be manipulated through a retraining procedure, and this retraining can influence subsequent alcohol consumption. Specifically, individuals trained to attend to or approach alcohol cues showed an increase in attentional bias as well as greater alcohol consumption in a taste-rating task, compared to those trained to avoid alcohol stimuli (Field & Eastwood, 2005; Wiers, Rinck, Kordts, Houben, & Strack, 2010). Such effects of training might persist for some time. Fadardi and Cox (2009) administered a training program designed to decrease levels of attentional bias towards alcohol-related stimuli and reported a significant reduction in drinkers’ attentional bias and alcohol consumption following training that was maintained over a 3-month follow-up. Similar effects of retraining attentional bias have been reported by others as well (Schoenmakers et al., 2010). Taken together, these findings provide some initial support for the causal role of such a bias in promoting alcohol consumption.
Although there are numerous studies showing that attentional bias is associated with heavy alcohol consumption, less is known about how a drinker’s attentional bias might be altered once s/he begins to consume alcohol during a drinking episode. Some initial studies suggest that attentional bias might be increased following consumption of a low dose of alcohol (0.3 g/kg) (Duka & Townshend, 2004; Schoenmakers, Wiers, & Field, 2008). However, neither of these studies observed any significant attentional bias when subjects were sober (i.e., following placebo). Duka and Townshend (2004) also failed to observe an increase in attentional bias following a higher dose of alcohol (0.6 g/kg). Our group reported significant attentional bias under placebo and two active doses of alcohol (0.32 g/kg and 0.64 g/kg), yet the magnitude of the bias was unaffected by the drug (Miller & Fillmore, 2011).
Although these few findings provide some initial support of a possible increase of attentional bias following a low alcohol dose and for the possible occurrence of attentional bias at higher doses, the evidence is limited. Also, studies of alcohol effects on attentional bias have not considered the drinking habits of the individuals being tested. The drinking habits of the individuals could be important in determining how alcohol might affect their attentional bias. According to the incentive-sensitization theory, heavy drinkers should be sensitized to the incentive-motivational effects of alcohol and alcohol cues. As such, it is reasonable to assume that any increase in attentional bias following alcohol consumption would be more pronounced in these individuals (Field et al., 2010; Robinson & Berridge, 1993). By contrast, more moderate drinkers have had less opportunity to acquire incentive-motivational responses to alcohol cues, and consequently should display less attentional bias to alcohol cues both prior to and following alcohol consumption.
The current study sought to examine the degree to which acute effects of alcohol on attentional bias might differ based on the drinkers’ history of prior alcohol use. Specifically, we chose to focus on frequency of binge drinking as the primary index of drinking history, as frequent binge drinkers typically consume much greater quantities of alcohol than infrequent drinkers (White, Kraus, & Swartzwelder, 2006). Participants were classified as heavy drinkers (i.e., individuals who frequently binge drink) or moderate drinkers (i.e., individuals who rarely or never binge drink) based on retrospective reports of daily alcohol consumption over the past 12 weeks. Attentional bias was assessed in response to placebo and two active doses of alcohol (0.45 g/kg and 0.65 g/kg). It was hypothesized that heavy drinkers would show a greater attentional bias compared to moderate drinkers in response to placebo, and that alcohol would increase attentional bias specifically in the heavy drinkers. Further, we examined the extent to which individual differences in attentional bias predicted alcohol self-administration, as measured by both self-report and laboratory ad lib consumption. Individuals who displayed a heightened attentional bias were expected to consume more alcohol on both measures.
Method
Participants
Volunteers were recruited to participate in a study of alcohol effects on computer tasks via notices placed on community bulletin boards and by university newspaper advertisements. Forty adults (18 women and 22 men) aged 21 to 29 (mean age = 23.4, SD = 2.6) participated in this study. The racial make-up of the sample was as follows: 1 African American, 35 Caucasian, 2 Hispanic/Latino, and 2 “other”. Screening measures were conducted to determine medical history and current and past drug and alcohol use. Any volunteers who self-reported head trauma, psychiatric disorder, substance abuse disorder, or alcohol dependence, as determined by a score of 5 or higher on the Short-Michigan Alcoholism Screening Test (S-MAST; Selzer, Vinokur, & van Rooijen, 1975), were excluded from participation. The University of Kentucky Medical Institutional Review Board approved the study, and participants received $160.
Materials and Measures
Visual Probe Task
Attentional bias was measured by a visual probe task used in previous research (Miller & Fillmore, 2010, 2011). The task was operated using E-Prime experiment generation software (Psychology Software Tools, Pittsburgh, PA) and was performed on a PC. The participant’s head was fixed in position using a chin rest and eye movements were recorded using a Model 504 Eye Tracking System (Applied Science Laboratory, Boston MA). Eye locations were sampled at 60 Hz and given X–Y coordinates used to determine fixations. Fixations were identified by gazes with standard deviations less than 0.5 degrees of visual angle for durations of 100 msec or longer.
A trial consisted of the presentation of two pictures (alcohol and neutral images) for 1000 ms. Upon offset of the picture pair, a target probe (X) appeared on either the left or right side of the screen, in the same location as one of the previously presented images. Participants were instructed to look at the pictures while they were on the screen, and to respond as soon as the probe was presented by pressing one of two response keys on the keyboard indicating on which side the probe appeared. The probe response was included in order to provide participants with motivation to look at the pictures for the duration of their presentation on the screen (i.e., until the target probe appeared). Critical task stimuli consisted of ten pairs of matched alcohol-related and neutral (i.e., non-alcohol-related) images. Alcohol images depicted a solitary image of an alcoholic beverage. Each of these images was matched with a corresponding neutral image consisting of a non-alcohol drink (e.g., a can of beer matched with a can of soda). The 10 image pairs were presented four times each, once for each of the four possible picture/target combinations (i.e., left and right picture location and left and right target probe location) for a total of 40 critical test trials. Forty filler trials consisting of neutral image-only pairs were randomly intermixed with the 40 critical trials. Attentional bias was measured by comparing mean fixation time (ms) on alcohol-related images to mean fixation time (ms) on neutral images across the 40 critical test trials, and an attentional bias score was calculated by subtracting mean fixation time on neutral images from mean fixation time on alcohol-related images. Previous research has shown that this is a sensitive measure of attentional bias (Miller & Fillmore, 2010, 2011). A test required five min to complete.
Desire for Alcohol
Self-reported desire for alcohol was measured on a visual analogue scale that has been used in previous research (e.g., Fillmore & Blackburn, 2002). Participants placed a vertical line representing the degree to which they “desire more alcohol” on a 100 mm scale ranging from 0 mm “not at all” to 100 mm “very much”.
Time Line Follow-Back (TLFB; Sobell & Sobell, 1992)
Participants completed a retrospective time line calendar of their alcohol consumption for the past 12 weeks to assess daily patterns of drinking. The measure uses “anchor points” to structure and facilitate participants’ recall of past drinking episodes. For each day, participants estimated the number of standard drinks they consumed and the number of hours they spent drinking. This information, along with gender and body weight, was used to estimate the resultant blood alcohol concentration (BAC) obtained for each drinking day using well-established, valid anthropometric-based BAC estimation formulae that assume an average clearance rate of 15 mg/dl per hour (McKim, 2007; Watson, Watson, & Batt, 1981). These formulae have been used in previous studies and have been shown to yield high correlations with actual resultant BACs obtained under laboratory conditions (Fillmore, 2001). Days in which the estimated resultant BAC was 80 mg/100 ml or higher were classified as binge days (NIAAA, 2004). The TLFB provided four measures of drinking habits over the past 12 weeks: (a) binge days (total number of binge episodes); (b) drunk days (total number of days on which participants reported feeling drunk); (c) drinking days (total number of days alcohol was consumed); (d) total drinks (total number of drinks consumed).
Procedure
Telephone Screen
Interested volunteers called the laboratory to participate in a screening interview conducted by a research assistant. Because the study involved an ad lib beer consumption session, only volunteers who reported liking beer were eligible for participation. Volunteers were pre-screened in terms of typical drinking habits to select for 20 heavy and 20 moderate drinkers (male and female), based on weekly frequency of binge drinking. All volunteers were asked to estimate the number of drinks typically consumed per occasion, as well as the typical hourly duration of a drinking occasion. Using the formulae described above (McKim, 2007; Watson et al., 1981), the resultant BAC typically obtained was calculated for each volunteer. Those with a resultant BAC of 80 mg/100 ml or greater were considered potentially eligible for the heavy drinker group. Those with a resultant BAC of less than 80 mg/100 ml were considered potentially eligible for the moderate drinker group.
Intake Session
All participants completed an intake session to verify their classification as either a heavy or moderate drinker, based on frequency of binge episodes in the past 12 weeks as reported on the TLFB. Participants who reported binge drinking on more than a weekly basis were retained in the heavy drinker group. Those who reported binge drinking on less than a weekly basis were retained in the moderate drinker group. Once 20 participants were recruited in each group, recruitment was discontinued. Participants also became acquainted with laboratory procedures during the intake session. Informed consent for participation was provided, height and weight were measured, demographic measures were completed, and a practice test was performed to become familiar with the visual probe task and the eye-tracking equipment.
Dose-Challenge Sessions
All sessions were conducted in the Behavioral Pharmacology Laboratory and testing began between 10 a.m. and 6 p.m. All participants were tested individually. Sessions were scheduled at least 24 hours apart and were completed within four weeks. Participants were instructed to fast for four hours prior to each session, and to refrain from consuming alcohol or any psychoactive drugs for 24 hours. Prior to each session, participants provided urine samples that were tested for drug metabolites, including amphetamine, barbiturates, benzodiazepines, cocaine, opiates, and tetrahydrocannabinol (ON trak TesTstiks, Roche Diagnostics Corporation, Indianapolis, IN, USA) and, in women, HCG, in order to verify that they were not pregnant (Mainline Confirms HGL, Mainline Technology, Ann Arbor, MI, USA). Breath samples were measured by an Intoxilyzer, Model 400 (CMI, Inc., Owensboro, KY) to verify a zero BAC.
Performance was tested under three doses of alcohol: 0.0 g/kg (placebo), 0.45 g/kg, and 0.65 g/kg. Doses were reduced to 87% for women to achieve equivalent BACs for men and women (Fillmore, 2001; Mulvihill, Skilling, & Vogel-Sprott, 1997). Each dose was administered on a separate test session, and dose order was counterbalanced across groups. Sessions were separated by a minimum of one day and a maximum of one week. The 0.45 g/kg dose produces an average peak BAC of 60 mg/100 ml, and the 0.65 g/kg dose produces an average peak BAC of 80 mg/100 ml. These doses allow for examination of attentional bias at BACs near (i.e., 60 mg/100 ml) and at (i.e., 80 mg/100 ml) the threshold for a binge episode (NIAAA, 2004), and were chosen to provide information regarding how attentional bias might function once BACs are substantially elevated. The alcohol beverage was served as one part alcohol and three parts carbonated mix, and was consumed in six min. The placebo beverage consisted of four parts carbonated mix and was served in the same manner. Alcohol (3 ml) was floated on top, and the glass was sprayed with an alcoholic mist, which resembled condensation and provided a strong alcoholic odor. Previous research has shown that individuals report that this beverage contains alcohol (e.g., Fillmore & Blackburn, 2002).
Participants’ visual probe performance was tested 25 min after drinking began, and desire for alcohol ratings were obtained 30 min after drinking began. Breath samples were collected at 23 and 35 min after drinking during both the placebo and alcohol test sessions. Participants were not given feedback regarding BAC measurements during testing, but were told they would receive this information at the end of the final session. Once testing was finished, participants remained at leisure in the lounge area until their BACs reached 20 mg/100 ml or below.
Ad Libitum Consumption Test
The final session measured the participants’ ad lib alcohol consumption. Participants completed a taste-rating task (Marlatt, Demming, & Reid, 1973), which previous research has shown provides a reliable and valid measure of ad lib consumption (Collins, Gollnisch, & Izzo, 1996; Marczinski, Bryant, & Fillmore, 2005; Weafer & Fillmore, 2008). Participants sampled six beers and rated them on various qualities (e.g., aftertaste, fullness), ostensibly to provide information on beer preferences. The beers were served in clear, frosted glasses. The beers sampled were Michelob Light™, Rolling Rock™, Sam Adams Light™, Harp™, Coors Light™, and Bud Light™. These were chosen because they are representative of beers commonly consumed by young adults and because they are all similar in per volume alcohol content (4.3, 4.6, 4.3, 4.6, 4.2, and 4.2%, respectively).
Participants were told the session would last six hours, and the tasting portion would last 90 minutes. They were allowed to drink as much or as little of each beer as they liked, but were encouraged to sample enough of each beer to give an accurate rating. The session took place in a room designed to promote a relaxing, leisurely atmosphere. Participants were seated in a large recliner and were provided with a mini-refrigerator to keep the beers cold when they were not being sampled. A DVD player and stereo were also available to provide entertainment. Ad lib sessions were held individually for each participant, and all sessions began at 4 pm. Once the 90 minutes had passed, participants’ BACs were measured. The remaining beer was measured in ml and subtracted from the total amount of beer presented to determine the amount of beer consumed by the participant.
Criterion Measures and Data Analyses
Attentional Bias
Mean fixation times on alcohol-related and neutral images were analyzed by a 2 (group: heavy drinkers vs. moderate drinkers) X 2 (image: alcohol vs. neutral) X 3 (dose: 0.0 g/kg, 0.45 g/kg, and 0.65 g/kg) mixed-design analysis of variance (ANOVA) in which group was the between-subjects factor and image and dose were within-subjects factors. Gender was initially entered as a covariate. No main effect or interactions involving gender were found, and as such analyses reported in the results were collapsed across gender.
Desire for Alcohol
Group and dose effects on self-reported desire for alcohol were analyzed by a 2 (group) X 3 (dose) ANOVA with group as the between-subjects factor and dose as the within-subjects factor.
Ad Lib Alcohol Consumption
The principal measure of ad lib consumption was the amount of beer (ml) consumed by the participant. The weight-adjusted dose (g/kg) of alcohol consumed was also calculated (total amount of alcohol consumed divided by participant’s body weight), and ad lib BAC was measured. Group differences in measures of ad lib consumption were analyzed by between-groups t tests (heavy vs. moderate drinkers).
Attentional Bias and Desire for Alcohol as Predictors of Alcohol Consumption
Bivariate correlational analyses were conducted to examine the degree to which individual differences in attentional bias scores and desire for alcohol ratings predicted measures of ad lib and self-reported alcohol consumption. These analyses were conducted within the entire sample to encompass the full range of alcohol consumption measures across participants, thus avoiding any restriction of range that would result from conducting the analyses separately by group.
Results
Drinking Habits and Demographics
Table 1 presents drinking habit and demographic information for the 20 heavy drinkers (8 women and 12 men) and the 20 moderate drinkers (10 women and 10 men). The table shows pronounced group differences in alcohol consumption, providing further confirmation of the validity of our selection criteria. Compared with moderate drinkers, heavy drinkers had more binge episodes, t(38) = 12.9, p < .001, d = 4.1, felt drunk on more days, t(38) = 6.8, p < .001, d = 2.2, drank alcohol on more days, t(38) = 3.8, p < .001, d = 1.2, and consumed a larger total number of drinks over the period, t(38) = 7.2, p < .001, d = 2.3.
Table 1.
Drinking Habits and Demographic Measures by Drinker Group
| Group | Contrasts | ||||
|---|---|---|---|---|---|
|
| |||||
| Heavy (n = 20)
|
Moderate (n = 20)
|
||||
| M | SD | M | SD | ||
| TLFB (past 12 weeks) | |||||
| Binge days | 26.0 | 7.2 | 3.3 | 3.0 | Sig*** |
| “Drunk” days | 17.8 | 9.3 | 3.0 | 2.9 | Sig*** |
| Drinking days | 38.5 | 14.7 | 22.5 | 11.6 | Sig*** |
| Total drinks consumed | 288.9 | 133.9 | 66.4 | 34.1 | Sig*** |
| Demographics | |||||
| Gender (male:female) | 12:8 | 10:10 | ns | ||
| Weight (kg) | 72.4 | 12.3 | 72.7 | 12.8 | ns |
Note. Group contrasts were tested by between-groups t tests.
Sig*** indicates a significance value of p < .001.
Dose-Challenge Sessions
Blood Alcohol Concentrations
Group differences in BAC under the active dose conditions were examined by a 2 (group) X 2 (time) X 2 (dose) mixed-design ANOVA. No main effects or interactions involving group were observed, ps > .10. There was a main effect of time owing to the rise of BAC over the ascending limb of the BAC curve when testing occurred, F(1, 38) = 154.8, p < .001, partial η2 = .80, and a main effect of dose owing to higher BACs following the 0.65 g/kg dose F(1, 38) = 50.8, p < .001, partial η2 = .57. There was also a time X dose interaction, owing to a steeper rate of rise in BAC following the 0.65 g/kg dose, F(1, 38) = 6.7, p = .01, partial η2 = .15. Mean BACs at pre and posttest under the 0.45 g/kg dose were 48.3 (SD = 13.8) mg/100 ml and 58.4 (SD = 13.7) mg/100 ml, respectively. For the 0.65 g/kg dose, the mean BACs at pre and posttest were 65.3 (SD = 15.0) mg/100 ml and 79.7 (SD = 16.8) mg/100 ml, respectively. No detectable BACs were observed under the placebo condition.
Attentional Bias
Due to computer malfunction, we were unable to record eye-movement data for one moderate drinker in response to the 0.45 g/kg dose of alcohol, and as such that participant was removed from dose-effect analyses. A 2 (group) X 2 (image) X 3 (dose) ANOVA of mean fixation times revealed significant main effects of image, F(1, 37) = 26.6, p < .001, partial η2 = .42, and dose, F(2, 74) = 11.9, p < .001, partial η2 = .24, and there was a trend toward a group X image X dose interaction, F (2, 74) = 2.6, p = .08, partial η2 = .07. Table 2 presents mean fixation times on alcohol-related and neutral images. The table shows that the main effect of image is due to the overall greater fixation time on alcohol-related compared to neutral images, observed in both drinker groups. Additionally, the main effect of dose is due to the overall decrease in fixation time in response to alcohol, observed in both groups and for both image types.
Table 2.
Mean (SD) Fixation Times on Alcohol-related and Neutral Images by Drinker Group
| Dose | Group
|
|||
|---|---|---|---|---|
| Heavy
|
Moderate
|
|||
| Alcohol | Neutral | Alcohol | Neutral | |
| 0.0 g/kg (placebo) | 378.2 (34.7) | 315.4 (44.3) | 362.7 (63.1) | 343.3 (49.6) |
| 0.45 g/kg | 340.5 (44.5) | 302.3 (66.2) | 344.6 (74.0) | 323.8 (54.9) |
| 0.65 g/kg | 325.1 (58.8) | 301.1 (56.5) | 341.9 (52.8) | 310.2 (53.1) |
For ease of presentation and interpretation, magnitude of attentional bias was calculated as a single score. This was done by subtracting mean fixation time on neutral images from mean fixation time on alcohol-related images, such that greater values indicated a greater attentional bias. Magnitude of attentional bias scores are presented in Figure 1. Based on a priori hypotheses regarding group differences in the effects of alcohol on attentional bias, dose effects on these scores were analyzed for each group separately. A one-way repeated-measures ANOVA revealed a significant main effect of dose in heavy drinkers, F(2, 38) = 4.0, p = .02, partial η2 = .17. Figure 1 shows that this is due to a dose-dependent decrease in attentional bias in this group. Follow-up paired t tests comparing attentional bias in the placebo condition to both active doses showed a significant alcohol-induced decrease in bias in response to the 0.65 g/kg dose, t(19) = 3.0, p = .008, d = .81, and a trend toward an alcohol-induced decrease in bias in response to the 0.45 g/kg dose, t(19) = 1.8, p = .09, d = .40. By contrast, a one-way repeated-measures ANOVA revealed no main effect of dose in moderate drinkers, p > .10. Between-groups t tests compared the attentional bias of heavy versus moderate drinkers following each dose. Heavy drinkers displayed significantly greater bias than moderate drinkers following placebo, t(37) = 3.0, p = .005, d = .83. By contrast, heavy and moderate drinkers did not differ in magnitude of attentional bias in response to either 0.45 g/kg or 0.65 g/kg of alcohol (ps > .10).
Fig 1.

Mean attentional bias scores for the heavy and moderate drinker groups under three alcohol doses: 0.0 g/kg (placebo), 0.45 g/kg, and 0.65 g/kg. Capped vertical lines show standard errors of the mean.
Desire for Alcohol
Figure 2 presents mean ratings of desire for alcohol for heavy and moderate drinkers. A 2 (group) X 3 (dose) ANOVA revealed a significant main effect of dose, F(2, 76) = 10.8, p < .001, partial η2 = .22, but no main effect or interaction involving group, ps >.10. As with attentional bias scores, dose effects on ratings of desire for alcohol were then analyzed for each group separately. A one-way repeated measures ANOVA revealed a significant main effect of dose in heavy drinkers, F(2, 38) = 8.4, p = .001, partial η2 = .31. The figure shows that this is due to a pronounced alcohol-induced increase in desire relative to placebo for heavy drinkers. Follow-up paired t tests showed that desire ratings were increased for heavy drinkers in response to the 0.65 g/kg dose, t(19) = 3.0, p = .007, d = .68, and the 0.45 g/kg dose, t(19) = 3.2, p = .005, d = .71. For moderate drinkers, a one-way repeated measures ANOVA of dose effect revealed a non-significant trend, F(2, 38) = 3.0, p = .06, partial η2 = .14. The figure shows that alcohol also increased mean desire ratings for moderate drinkers, but this increase was less pronounced than that observed for heavy drinkers.
Fig 2.
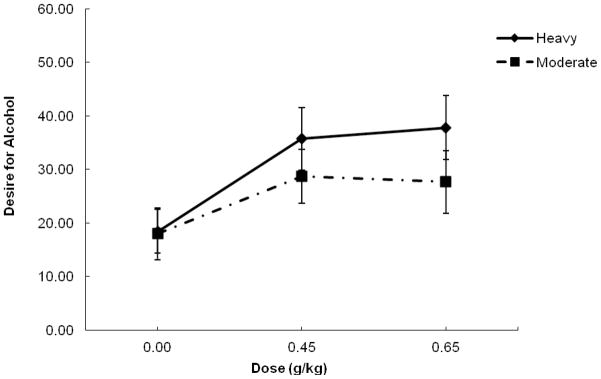
Mean self-reported ratings of desire for alcohol for the heavy and moderate drinker groups under three alcohol doses: 0.0 g/kg (placebo), 0.45 g/kg, and 0.65 g/kg. Capped vertical lines show standard errors of the mean.
Ad Lib Consumption
Two participants (one heavy drinker and one moderate drinker) were unable to attend the final session of the study due to personal reasons, and therefore we do not have ad lib consumption data available for these participants. There was a considerable range in consumption across the sample, with individual amounts ranging from 95 to 2120 ml of beer. The weight-adjusted dose consumed ranged from 0.04 to 1.03 g/kg, and BACs obtained at the end of the 90 minute tasting session ranged from 0 to 120 mg/100 ml. Table 3 presents the mean measures of ad lib consumption for heavy and moderate drinkers. Heavy drinkers consumed significantly more alcohol than did moderate drinkers as measured by total ml of beer consumed, t(36) = 3.6, p = .001, d = .94, weight-adjusted dose of alcohol consumed, t(36) = 3.4, p = .002, d = .92, and BAC obtained, t(36) = 3.1, p = .004, d = .86.
Table 3.
Mean (SD) Ad Lib Consumption Measures by Drinker Group
| Group | Contrasts | ||||
|---|---|---|---|---|---|
|
| |||||
| Heavy
|
Moderate
|
||||
| M | SD | M | SD | ||
| Beer consumed (ml) | 1495.6 | 567.8 | 865.7 | 515.7 | Sig** |
| Weight-adjusted dose (g/kg) | 0.70 | 0.24 | 0.42 | 0.27 | Sig** |
| Ad lib BAC (mg/100ml) | 64.5 | 29.4 | 34.9 | 29.4 | Sig** |
Note. Group contrasts were tested by between-groups t tests.
Sig** indicates a significance value of p < .01.
Attentional Bias as a Predictor of Alcohol Consumption
Ad lib consumption
Bivariate correlational analyses were conducted in the sample as a whole to examine the degree to which individual differences in attentional bias predicted ad lib alcohol consumption, and these correlations are presented in Table 4. Results showed that greater attentional bias in response to placebo significantly predicted greater amounts of ad lib consumption, as measured by total ml of beer consumed and weight-adjusted dose consumed (ps < .05). There was a trend toward a significant association between attentional bias in response to placebo and BAC obtained at the end of the 90 min drinking session (p = .06). By contrast, attentional bias following 0.45 g/kg and 0.65 g/kg alcohol did not predict any ad lib consumption measures (ps > .10).
Table 4.
Correlation Matrix of Attentional Bias Scores with Ad Lib and Self-reported Alcohol Consumption
| Attentional Bias Score | |||
|---|---|---|---|
|
| |||
| 0.0 g/kg (placebo) | 0.45 g/kg | 0.65 g/kg | |
| Ad Lib Measures
|
|||
| Beer consumed | .33* | .12 | .12 |
| Dose consumed | .33* | .16 | .21 |
| Ad lib BAC | .30 | .15 | .19 |
| TLFB
|
|||
| Binge days | .45** | .19 | .02 |
| “Drunk” days | .36* | .11 | .03 |
| Drinking days | .36* | .09 | .18 |
| Total drinks consumed | .51** | .17 | .02 |
Note.
indicates a significance value of p < .05 and
indicates a significance value of p < .01.
Self-reported drinking habits
Bivariate correlational analyses were also conducted to examine the degree to which attentional bias under each alcohol dose predicted self-reported alcohol consumption on the TLFB, and these correlations are also presented in Table 4. As the table shows, greater attentional bias under placebo significantly predicted greater levels of alcohol consumption in terms of number of binge days, “drunk days”, drinking days, and total drinks consumed (ps < .03). Moreover, as with ad lib consumption measures, no significant associations were found between drinking habits and attentional bias following either active dose (ps > .10).
Desire for Alcohol as a Predictor of Alcohol Consumption
Ad lib consumption
Bivariate correlational analyses of associations between ratings of desire for alcohol and ad lib alcohol consumption are presented in Table 5. The table shows that ratings of desire for alcohol following placebo did not predict any measure of ad lib consumption (ps > .10). By contrast, higher ratings of desire for alcohol following both active doses of alcohol predicted greater consumption on each measure of ad lib consumption (ps < .05).
Table 5.
Correlation Matrix of Desire for Alcohol Ratings with Ad Lib and Self-reported Alcohol Consumption
| Desire for Alcohol | |||
|---|---|---|---|
|
| |||
| 0.0 g/kg (placebo) | 0.45 g/kg | 0.65 g/kg | |
| Ad Lib Measures
|
|||
| Beer consumed | .01 | .32* | .36* |
| Dose consumed | .07 | .34* | .38* |
| Ad lib BAC | .06 | .39* | .44** |
| TLFB
|
|||
| Binge days | .01 | .29 | .37* |
| “Drunk” days | .14 | .48** | .52** |
| Drinking days | .06 | .34* | .18 |
| Total drinks consumed | −.01 | .34* | .35* |
Note.
indicates a significance value of p < .05 and
indicates a significance value of p < .01.
Self-reported drinking habits
Bivariate correlational analyses of the degree to which desire for alcohol predicted self-reported alcohol consumption on the TLFB are also presented in Table 5. As the table shows, desire for alcohol following placebo did not predict any drinking habit measures on the TLFB (ps > .10). By contrast, higher desire ratings following the 0.45 g/kg dose predicted a greater number of “drunk days”, drinking days, and total drinks (ps < .04), and higher desire ratings under the 0.65 g/kg dose predicted a greater number of binge days, “drunk days”, and total drinks (ps < .03).
Discussion
The current study investigated acute alcohol effects on attentional bias in a group of heavy drinkers and in a comparison group of moderate drinkers. It was hypothesized that heavy drinkers would show a heightened attentional bias to alcohol-related stimuli compared to moderate drinkers, and that acute alcohol administration would serve to further increase this attentional bias in heavy drinkers. As hypothesized, heavy drinkers displayed a pronounced attentional bias compared to moderate drinkers following placebo. Indeed, the mean score of heavy drinkers was over three times greater than that of moderate drinkers. However, contrary to hypothesis, heavy drinkers displayed a dose-dependent decrease in attentional bias in response to alcohol. Moderate drinkers, by contrast, displayed a small magnitude of attentional bias that remained consistent across each of the alcohol doses. As such, the pronounced group difference observed under placebo was attenuated such that heavy and moderate drinkers did not significantly differ in magnitude of bias under either active dose of alcohol. The study also examined the degree to which individual differences in attentional bias predicted alcohol consumption, as measured both by self-report and ad lib consumption within the laboratory. As predicted, there were strong associations between attentional bias following placebo and measures of self-reported and ad lib alcohol consumption. Specifically, individuals displaying greater attentional bias also self-reported greater alcohol consumption and consumed more alcohol when given ad lib access. However, these robust associations were no longer evident when attentional bias was measured under alcohol. That is, attentional bias towards alcohol-related stimuli following alcohol consumption bore no relation to individuals’ self-reported or ad lib alcohol consumption. In sum, the findings indicate heavy drinking behavior is associated with greater magnitude of attentional bias, but only when attentional bias is measured in the sober state (i.e., following placebo) and not after drinking has begun.
The current results replicate previous studies that have demonstrated greater attentional bias in heavy drinkers compared to light drinkers (Field et al., 2007; Murphy & Garavan, 2011; Sharma et al., 2001; Tibboel et al., 2010; Townshend & Duka, 2001). Moreover, this is one of the first studies to demonstrate strong associations between individual differences in attentional bias and multiple measures of both self-reported and laboratory ad lib consumption. Specifically, we showed that greater magnitude of attentional bias predicted both frequency and quantity of drinking on a detailed self-report measure of alcohol consumption. Further, we found that attentional bias predicted individual differences in a laboratory measure of ad lib drinking as well. Previous studies using the ad lib consumption task have demonstrated the validity of this task as a measure of consumption patterns outside of the laboratory, suggesting that individual differences in amounts of consumption on this task can be interpreted as possible indicators for abuse potential (Collins et al., 1996; Marczinski et al., 2005; Weafer & Fillmore, 2008). As such, these robust associations between attentional bias in the sober state and measures of alcohol consumption provide additional support for the previously observed relationship between attentional bias and level of consumption.
To our knowledge, this is the first laboratory study to show an alcohol-induced decrease in attentional bias in heavy drinkers. We originally hypothesized that heavy drinkers would show an increase in attentional bias due to a sensitized incentive-motivational response to alcohol; however, the current findings did not support this hypothesis. One possible explanation for this finding is that the interoceptive cues following consumption of the active doses (i.e., rewarding effects of the drug) might have surmounted any of the incentive salience normally associated with the alcohol-related stimuli (i.e., alcohol images) when the participant is in the sober state. Theoretical accounts suggest that alcohol-related cues take on a heightened salience for heavy drinkers due to conditioned associations that develop between the cues and the rewarding effects of acute alcohol intoxication (Field & Cox, 2008; Robinson & Berridge, 1993). However, once alcohol consumption is initiated, and the rewarding effects of the active drug are experienced, the drinker’s attentional focus on the external alcohol-related signals in the environment (i.e., alcohol pictures) likely diminishes as the incentive salience of these environmental signals cannot compete with the actual interoceptive/subjective rewarding effects of the drug after it is consumed. Such an account would explain the dose-dependent decrease in attentional bias, in that as BAC rises the rewarding effects of the drug become more pronounced, resulting in a corresponding decrease in attention towards alcohol cues.
The discrepancies between the current findings and those reported from previous investigations of alcohol effects on attentional bias highlight the importance of examining attentional bias in well-defined drinker groups based on a priori criteria. Previous studies examined attentional bias in single samples comprised of individuals with a range of drinking habits, and this may have contributed to the failure of these studies to demonstrate any attentional bias in the sober state (i.e., in the placebo condition) (Duka & Townshend, 2004; Schoenmakers et al., 2008). However, by examining attentional bias separately in distinct drinker groups, we were able to observe robust attentional bias in the heavy drinkers and marked group differences in response to alcohol. Our group selection scheme was based on a strictly characterized drinking parameter (i.e., frequency of binge drinking), which was first obtained in a phone interview and then confirmed via a well-validated retrospective measure of alcohol consumption and by using BAC estimation formulae that take into consideration a number of variables, including gender, weight, and quantity and duration of individual drinking episodes. Moreover, study results provided strong validation for our selection criteria, as evidenced by the pronounced group differences in measures of both ad lib alcohol consumption in the laboratory and self-reported quantity and frequency of consumption. As such, selection of heavy, binge drinkers allowed us to observe changes in attentional bias in response to alcohol that were not observed in moderate drinkers, who are more commonly studied.
The current findings add important information to our understanding of associations between attentional bias and alcohol consumption. First, the finding that individuals with greater attentional bias drink most frequently and consume the heaviest quantities of alcohol are in line with the hypothesis that greater attention to alcohol cues (in a sober state) could promote increased consumption, perhaps through increasing the likelihood of initiation of a drinking episode. However, it is important to note that these are correlational analyses and therefore no inferences can be drawn regarding the causal role of attentional bias in initiation of consumption from this study. Additionally, the disconnect between the high magnitude of attentional bias and low desire for alcohol ratings in the placebo condition further calls into question the degree to which attentional bias actually promotes desire for, and subsequent initiation of, consumption. It could be that magnitude of attentional bias serves primarily as an indicator of retrospective drinking history, in that individuals with a history of heavy alcohol consumption reliably display increased attention toward alcohol cues, but such an attentional bias might have little prospective influence on subsequent initiation of a drinking episode. It will be imperative for future studies to directly test causal relationships between attentional bias and increased motivation and consumption in order to make any definitive statements regarding a causal role of attentional bias in initiation of alcohol consumption.
Another important implication of these findings can be drawn from the decrease in attentional bias following alcohol observed in heavy drinkers. This suggests that attentional bias might not play an influential role in promoting heavy alcohol consumption once a drinking episode has begun. This is further supported by the failure to observe significant differences in magnitude of attentional bias in heavy and light drinkers in response to either active dose of alcohol, as well as the lack of association between attentional bias under alcohol and any measure of self-reported or ad lib alcohol consumption in the current study. As such, it is likely that other factors (e.g., greater sensitivity to the rewarding or disinhibiting effects of the drug) are more influential in promoting excessive, binge-like consumption once a drinking episode has been initiated. Indeed, the current study showed that alcohol-induced increase in desire for more alcohol was most pronounced in the heavy drinkers. Moreover, desire ratings following both active doses predicted both ad lib and self-reported alcohol consumption measures. Specifically, individuals reporting greater desire for alcohol following the active doses self-reported greater consumption levels over the past three months, as well as consumed more when given ad lib access. This provides additional support for the hypothesis that acute interoceptive rewarding effects of the drug take on a heightened importance and play a significant role in influencing further alcohol consumption.
It is important to consider other characteristics of heavy drinkers that might also potentially influence their pronounced attentional bias in the sober state. For instance, a history of heavy drinking is associated with more positive alcohol outcome expectancies (i.e., beliefs that an individual holds regarding the types of effects the drug will have on mood and behavior). A particularly important finding is that people who report expecting more pleasant effects of alcohol also report higher consumption of the drug (Goldman, Del Boca, and Darkes, 1999). These correlations are consistent with the prediction that expectancies can guide behavior, and with the suspicion that alcohol-related expectancies might be associated with the risk of excessive drinking (Marlatt & Gordon, 1985). Importantly, alcohol expectancies can be acquired through learning principles, similar to those that influence development of attentional bias (Vogel-Sprott & Fillmore, 2011). It could be that individual differences in positive alcohol outcome expectancies and attentional bias are related, such that drinkers holding more positive expectancies also show the most pronounced attentional bias. This is an intriguing possibility and an important avenue for future research, as positive expectancies could be a separate factor contributing to the development of attentional bias in heavy drinkers.
There are some potential limitations to this study. First, the lack of a sober control condition makes it difficult to interpret the degree to which attentional bias observed in the placebo condition is due to participants’ belief of having consumed alcohol. However, given that previous research has consistently shown marked attentional bias in heavy drinkers with no expectancy of alcohol (e.g., Duka & Townshend, 2004; Murphy & Garavan, 2011), it is unlikely that attentional bias was evident only because participants expected alcohol. Additionally, the current study focused on attentional bias soon after alcohol consumption, as BAC was rising. In order to fully understand fluctuations in attentional bias throughout a drinking episode, as well as the role of attentional bias in initiating or maintaining various phases of the drinking episode, it will be important to investigate attentional bias across the blood alcohol curve. Future studies investigating alcohol effects on both the ascending and descending limbs of the blood alcohol curve, with a particular emphasis on declining BACs, would provide valuable information concerning other potential means through which this mechanism might serve to promote excessive alcohol consumption. Finally, the impairing effects of alcohol on ocular functioning and attention could potentially reduce our ability to accurately measure attentional bias using the visual probe task at higher BACs (Miller & Fillmore, 2011; Rohrbaugh et al., 1988; Stapleton, Guthrie, & Linnoila, 1986). It will be important for future studies to replicate these findings using alternate measures of attentional bias to confirm that the current results are not an artifact of measurement bias.
In sum, the current study provides new information regarding the acute effects of alcohol on attentional bias towards alcohol-related cues in both heavy and moderate drinkers. The current findings point to a role of attentional bias as a motivational factor for alcohol consumption that might be specific to the initiation of a drinking episode, and less relevant in regard to continuation or prolonging of the episode. These findings have potential implications for understanding means through which attentional bias serves to promote alcohol consumption, and how that influence might fluctuate within a drinking episode.
Acknowledgments
This research was supported by National Institute on Alcohol Abuse and Alcoholism Grants R01 AA018274, R01 AA012895, and F31 AA018584. The content is solely the responsibility of the authors and does not necessarily represent the official views of the National Institute on Alcohol Abuse and Alcoholism or the National Institutes of Health.
References
- Ceballos NA, Komogortsev OV, Turner GM. Ocular imaging of attentional bias among college students: automatic and controlled processing of alcohol-related scenes. Journal of Studies on Alcohol and Drugs. 2009;70:652–659. doi: 10.15288/jsad.2009.70.652. [DOI] [PubMed] [Google Scholar]
- Collins RL, Gollnisch G, Izzo CV. Drinking restraint and alcohol-related outcomes: exploring the contributions of beverage instructions, beverage content and self-monitoring. Journal of Studies on Alcohol. 1996;57:563–571. doi: 10.15288/jsa.1996.57.563. [DOI] [PubMed] [Google Scholar]
- Dick DM, Bierut LJ. The genetics of alcohol dependence. Current Psychiatry Reports. 2006;8:151–157. doi: 10.1007/s11920-006-0015-1. [DOI] [PubMed] [Google Scholar]
- Duka T, Townshend JM. The priming effect of alcohol pre-load on attentional bias to alcohol-related stimuli. Psychopharmacology. 2004;176:353–361. doi: 10.1007/s00213-004-1906-7. [DOI] [PubMed] [Google Scholar]
- Fadardi JS, Cox WM. Alcohol-attentional bias and motivational structure as independent predictors of social drinkers’ alcohol consumption. Drug and Alcohol Dependence. 2008;97:247–256. doi: 10.1016/j.drugalcdep.2008.03.027. [DOI] [PubMed] [Google Scholar]
- Fadardi JS, Cox WM. Reversing the sequence: reducing alcohol consumption by overcoming alcohol attentional bias. Drug and Alcohol Dependence. 2009;101:137–145. doi: 10.1016/j.drugalcdep.2008.11.015. [DOI] [PubMed] [Google Scholar]
- Field M, Christiansen P, Cole J, Goudie A. Delay discounting and the alcohol Stroop in heavy drinking adolescents. Addiction. 2007;102:579–586. doi: 10.1111/j.1360-0443.2007.01743.x. [DOI] [PubMed] [Google Scholar]
- Field M, Cox WM. Attentional bias in addictive behaviors: a review of its development, causes, and consequences. Drug and Alcohol Dependence. 2008;97:1–20. doi: 10.1016/j.drugalcdep.2008.03.030. [DOI] [PubMed] [Google Scholar]
- Field M, Eastwood B. Experimental manipulation of attentional bias increases the motivation to drink alcohol. Psychopharmacology. 2005;183:350–357. doi: 10.1007/s00213-005-0202-5. [DOI] [PubMed] [Google Scholar]
- Field M, Wiers RW, Christiansen P, Fillmore MT, Verster JC. Acute alcohol effects on inhibitory control and implicit cognition: implications for loss of control over drinking. Alcoholism, Clinical and Experimental Research. 2010;34:1346–1352. doi: 10.1111/j.1530-0277.2010.01218.x. [DOI] [PMC free article] [PubMed] [Google Scholar]
- Fillmore MT. Cognitive preoccupation with alcohol and binge drinking in college students: alcohol-induced priming of the motivation to drink. Psychology of Addictive Behaviors. 2001;15:325–332. [PubMed] [Google Scholar]
- Fillmore MT. Drug abuse as a problem of impaired control: current approaches and findings. Behavioral and Cognitive Neuroscience Reviews. 2003;2:179–197. doi: 10.1177/1534582303257007. [DOI] [PubMed] [Google Scholar]
- Fillmore MT. Acute alcohol-induced impairment of cognitive functions: Past and present findings. International Journal of Disability and Human Development. 2007;6:115–125. [Google Scholar]
- Fillmore MT, Blackburn J. Compensating for alcohol-induced impairment: alcohol expectancies and behavioral disinhibition. Journal of Studies on Alcohol. 2002;63:237–246. doi: 10.15288/jsa.2002.63.237. [DOI] [PubMed] [Google Scholar]
- Flowers NT, Naimi TS, Brewer RD, Elder RW, Shults RA, Jiles R. Patterns of alcohol consumption and alcohol-impaired driving in the United States. Alcoholism: Clinical and Experimental Research. 2008;32:639–644. doi: 10.1111/j.1530-0277.2008.00622.x. [DOI] [PubMed] [Google Scholar]
- Goldman M, Del Boca FK, Darkes J. Alcohol expectancy theory: The application of cognitive neuroscience. In: Leonard KE, Blane HT, editors. Psychological theories of drinking and alcoholism. 2. New York, NY: Guilford Press; 1999. pp. 203–246. [Google Scholar]
- Holdstock L, King AC, de Wit H. Subjective and objective responses to ethanol in moderate/heavy and light social drinkers. Alcoholism: Clinical and Experimental Research. 2000;24:789–794. [PubMed] [Google Scholar]
- Jones BT, Bruce G, Livingstone S, Reed E. Alcohol-related attentional bias in problem drinkers with the flicker change blindness paradigm. Psychology of Addictive Behaviors. 2006;20:171–177. doi: 10.1037/0893-164x.20.2.171. [DOI] [PubMed] [Google Scholar]
- Marczinski CA, Bryant R, Fillmore MT. The relationship between cognitive preoccupation with alcohol and alcohol use in male and female college students. Addiction Research & Theory. 2005;13:383–394. [Google Scholar]
- Marczinski CA, Combs SW, Fillmore MT. Increased sensitivity to the disinhibiting effects of alcohol in binge drinkers. Psychology of Addictive Behaviors. 2007;21:346–354. doi: 10.1037/0893-164x.21.3.346. [DOI] [PubMed] [Google Scholar]
- Marczinski CA, Grant EC, Grant VJ. Binge drinking in adolescents and college students. Hauppauge, NY: Nova Science; 2009. [Google Scholar]
- Marlatt GA, Demming B, Reid JB. Loss of control drinking in alcoholics: an experimental analogue. Journal of Abnormal Psychology. 1973;81:233–241. doi: 10.1037/h0034532. [DOI] [PubMed] [Google Scholar]
- Marlatt GA, Gordon JR. Relapse prevention: Maintenance strategies in the treatment of addictive behaviors. New York, NY: Guilford Press; 1985. [Google Scholar]
- McKim WA. Drugs and behavior: An introduction to behavioral pharmacology. 6. New Jersey: Pearson Prentice Hall; 2007. [Google Scholar]
- Miller MA, Fillmore MT. The effect of image complexity on attentional bias towards alcohol-related images in adult drinkers. Addiction. 2010;105:883–890. doi: 10.1111/j.1360-0443.2009.02860.x. [DOI] [PMC free article] [PubMed] [Google Scholar]
- Miller MA, Fillmore MT. Persistence of attentional bias toward alcohol-related stimuli in intoxicated social drinkers. Drug and Alcohol Dependence. 2011;117:184–189. doi: 10.1016/j.drugalcdep.2011.01.016. [DOI] [PMC free article] [PubMed] [Google Scholar]
- Mulvihill LE, Skilling TA, Vogel-Sprott M. Alcohol and the ability to inhibit behavior in men and women. Journal of Studies on Alcohol. 1997;58:600–605. doi: 10.15288/jsa.1997.58.600. [DOI] [PubMed] [Google Scholar]
- Murphy P, Garavan H. Cognitive predictors of problem drinking and AUDIT scores among college students. Drug and Alcohol Dependence. 2011;115:94–100. doi: 10.1016/j.drugalcdep.2010.10.011. [DOI] [PubMed] [Google Scholar]
- National Institute on Alcohol Abuse and Alcoholism. NIAAA council approves definition of binge drinking. NIAAA Newsletter. 2004 Winter3 [Google Scholar]
- Presley CA, Pimentel ER. The introduction of the heavy and frequent drinker: a proposed classification to increase accuracy of alcohol assessments in postsecondary educational settings. Journal of Studies on Alcohol. 2006;67:324–331. doi: 10.15288/jsa.2006.67.324. [DOI] [PubMed] [Google Scholar]
- Quinn PD, Fromme K. Subjective response to alcohol challenge: a quantitative review. Alcoholism: Clinical and Experimental Research. 2011;35:1759–1770. doi: 10.1111/j.1530-0277.2011.01521.x. [DOI] [PMC free article] [PubMed] [Google Scholar]
- Robinson TE, Berridge KC. The neural basis of drug craving: an incentive-sensitization theory of addiction. Brain Research Reviews. 1993;18:247–291. doi: 10.1016/0165-0173(93)90013-p. [DOI] [PubMed] [Google Scholar]
- Robinson TE, Berridge KC. Incentive-sensitization and addiction. Addiction. 2001;96:103–114. doi: 10.1080/09652140020016996. [DOI] [PubMed] [Google Scholar]
- Rohrbaugh JW, Stapleton JM, Parasuraman R, Frowein HW, Adinoff B, Varner JL, Zubovic EA, Lane MJ, Exkardt MJ, Linnoila M. Alcohol intoxication reduces visual sustained attention. Psychopharmacology. 1988;96:442–446. doi: 10.1007/BF02180021. [DOI] [PubMed] [Google Scholar]
- Rose AK, Grunsell L. The subjective, rather than the disinhibiting, effects of alcohol are related to binge drinking. Alcoholism: Clinical and Experimental Research. 2008;32:1096–1104. doi: 10.1111/j.1530-0277.2008.00672.x. [DOI] [PubMed] [Google Scholar]
- Ryan F. Detected, selected, and sometimes neglected: cognitive processing of cues in addiction. Experimental and Clinical Psychopharmacology. 2002;10:67–76. doi: 10.1037//1064-1297.10.2.67. [DOI] [PubMed] [Google Scholar]
- Schoenmakers T, Wiers RW, Field M. Effects of a low dose of alcohol on cognitive biases and craving in heavy drinkers. Psychopharmacology. 2008;197:169–178. doi: 10.1007/s00213-007-1023-5. [DOI] [PMC free article] [PubMed] [Google Scholar]
- Schoenmakers TM, de Bruin M, Lux IF, Goertz AG, Van Kerkhof DH, Wiers RW. Clinical effectiveness of attentional bias modification training in abstinent alcoholic patients. Drug and Alcohol Dependence. 2010;109:30–36. doi: 10.1016/j.drugalcdep.2009.11.022. [DOI] [PubMed] [Google Scholar]
- Selzer ML, Vinokur A, van Rooijen L. A self-administered Short Michigan Alcoholism Screening Test (SMAST) Journal of Studies on Alcohol. 1975;36:117–126. doi: 10.15288/jsa.1975.36.117. [DOI] [PubMed] [Google Scholar]
- Sharma D, Albery IP, Cook C. Selective attentional bias to alcohol related stimuli in problem drinkers and non-problem drinkers. Addiction. 2001;96:285–295. doi: 10.1080/09652140020021026. [DOI] [PubMed] [Google Scholar]
- Sher KJ, Grekin ER, Williams NA. The development of alcohol use disorders. Annual Review of Clinical Psychology. 2005;1:493–523. doi: 10.1146/annurev.clinpsy.1.102803.144107. [DOI] [PubMed] [Google Scholar]
- Sobell LC, Sobell MB. Timeline follow-back: A technique for assessing self-reported alcohol consumption. In: Litten RZ, Allen JP, editors. Measuring alcohol consumption: Psychosocial and biochemical methods. Totowa, NJ: Humana Press; 1992. pp. 41–72. [Google Scholar]
- Stapleton JM, Guthrie S, Linnoila M. Effects of alcohol and other psychotropic drugs on eye movements: relevance to traffic safety. Journal of Studies on Alcohol. 1986;47:426–432. doi: 10.15288/jsa.1986.47.426. [DOI] [PubMed] [Google Scholar]
- Tibboel H, De Houwer J, Field M. Reduced attentional blink for alcohol-related stimuli in heavy social drinkers. Journal of Psychopharmacology. 2010;24:1349–1356. doi: 10.1177/0269881109106977. [DOI] [PubMed] [Google Scholar]
- Townshend JM, Duka T. Attentional bias associated with alcohol cues: differences between heavy and occasional social drinkers. Psychopharmacology. 2001;157:67–74. doi: 10.1007/s002130100764. [DOI] [PubMed] [Google Scholar]
- Vogel-Sprott M, Fillmore MT. Learning, expectancy, and behavioral control: Implications for drug abuse. In: Schachtman TR, Reilly S, editors. Associative learning and conditioning theory: Human and non-human applications. New York, NY: Oxford University Press; 2011. pp. 213–234. [Google Scholar]
- Watson PE, Watson ID, Batt RD. Prediction of blood alcohol concentrations in human subjects. Updating the Widmark Equation. Journal of Studies on Alcohol. 1981;42:547–556. doi: 10.15288/jsa.1981.42.547. [DOI] [PubMed] [Google Scholar]
- Weafer J, Fillmore MT. Individual differences in acute alcohol impairment of inhibitory control predict ad libitum alcohol consumption. Psychopharmacology. 2008;201:315–324. doi: 10.1007/s00213-008-1284-7. [DOI] [PMC free article] [PubMed] [Google Scholar]
- Wechsler H, Davenport A, Dowdall G, Moeykens B, Castillo S. Health and behavioral consequences of binge drinking in college. A national survey of students at 140 campuses. Journal of the American Medical Association. 1994;272:1672–1677. [PubMed] [Google Scholar]
- Wechsler H, Dowdall GW, Davenport A, Castillo S. Correlates of college student binge drinking. American Journal of Public Health. 1995;85:921–926. doi: 10.2105/ajph.85.7.921. [DOI] [PMC free article] [PubMed] [Google Scholar]
- Wechsler H, Nelson TF. Binge drinking and the American college student: what’s five drinks? Psychology of Addictive Behaviors. 2001;15:287–291. doi: 10.1037//0893-164x.15.4.287. [DOI] [PubMed] [Google Scholar]
- White AM, Kraus CL, Swartzwelder H. Many college freshmen drink at levels far beyond the binge threshold. Alcoholism: Clinical and Experimental Research. 2006;30:1006–1010. doi: 10.1111/j.1530-0277.2006.00122.x. [DOI] [PubMed] [Google Scholar]
- Wiers RW, Rinck M, Kordts R, Houben K, Strack F. Retraining automatic action-tendencies to approach alcohol in hazardous drinkers. Addiction. 2010;105:279–287. doi: 10.1111/j.1360-0443.2009.02775.x. [DOI] [PubMed] [Google Scholar]