Abstract
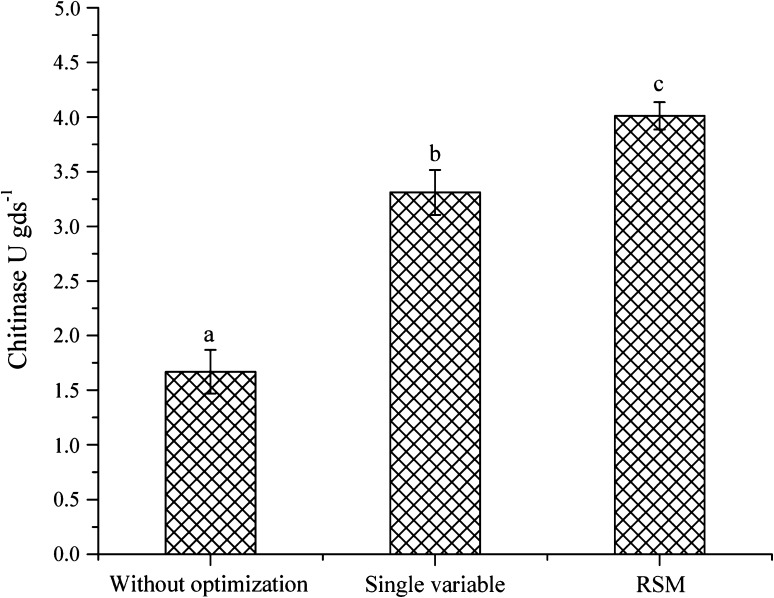
The growth conditions for chitinase production by Trichoderma asperellum UTP-16 in solid state fermentation was optimized using response surface methodology based on central composite design. The chitinase production was optimized, using one-factor at a time approach, with six independent variables (temperature, pH, NaCl, incubation period, nitrogen and carbon sources) and 3.31 Units per gram dry substrate (U gds−1) exo-chitinase yield was obtained. A 21.15% increase was recorded in chitinase activity (4.01 U gds−1) through surface response methodology, indicates that it is a powerful and rapid tool for optimization of physical and nutritional variables. Further, efficiency of crude enzyme was evaluated against phytopathogenic Fusarium spp. and a mycelial growth inhibition up to 3.5–6.5 mm was achieved in well diffusion assay. These results could be supplemented as basic information for the development of enzyme based formulation of T. asperellum UTP-16 and its use as a biocontrol agent.
Keywords: Chitinase, Central composite design, Solid state fermentation, Antifungal activity
Introduction
Chitinases (EC 3:2:1:14) are the key hydrolytic enzymes responsible for the degradation of chitin [1]. These enzymes has important roles in biological control of pests and diseases, as growth promoting factors, in food and feed, medicine, waste management, sweetners and in industries [2]. The chitinolytic enzymes of microbial origins, especially exo-chitinases of Trichoderma spp. can restrict the growth of soil-borne pathogens through hydrolysis of cell wall associated chitin [3]. Chitinase production by T. harzianum was found to be induced using wheat bran-based solid medium containing 1% colloidal chitin and the chitinase lead to the lysis of the phytopathogenic fungus Colletotrichum gloeosporioides [4]. In this context, solid state fermentation (SSF) has emerged as a promising technology for the enzyme production from cheaply available agro-industrial residues such as wheat bran, rice bran, oil cakes, etc. [5]. Optimization of growth parameters and media components for chitinase production in SSF following one-factor-at-a-time has been widely reported [6]. However, optimization with multivariable factors can be designed to produce more precise, appropriate and reproducible results for maximum production of enzymes with least cumbersome and cost effective way. Response Surface Methodology (RSM) has eased process development for designing experimental models for multivariable factors in order to interpret the effects of different substrates, nutrient concentrations, growth condition and their possible interactions for the higher production of the enzymes [6].
Each organism has its own special conditions or requirements for maximum enzyme production. Therefore, the present investigation was initiated with an aim to optimise wheat bran-to-carbon/nitrogen source ratio, pH level, NaCl concentration, temperature and incubation time for exo-chitinase production from T. asperellum UTP-16 using RSM and antifungal activity of crude extract of chitinase against phytopathogenic Fusaria.
Materials and Methods
Microbial Cultures Used
Trichoderma asperellum UTP-16 was isolated from Uttarakhand, India and maintained on Potato Dextrose Agar medium at 26 ± 2°C. The organism has been deposited in the culture collection of National Bureau of Agriculturally Important Microorganisms (NBAIM) with the accession no.: NAIMCC-F-1937.
Soil-borne pathogenic fungi viz.Fusarium oxysporum f. sp. lycopersici (NAIMCC-F-00899), F. oxysporum f. sp. ciceri (NAIMCC-F-00857) F. solani (NAIMCC-F-00977) and F. udum (NAIMCC-F-01038) were obtained from culture collection of NBAIM, Mau, Uttar Pradesh, India.
Solid State Fermentation and Enzyme Extraction
Five gram of sterilized solid substrate media (dry wheat bran) contained in 250 ml Erlenmeyer flask was supplemented with 2 ml salt solution (0.5% NH4NO3, 0.2% KH2PO4, 0.1% NaCl, and 0.1% MgSO4·7H2O). Initial moisture level in the substrate was maintained at 20% (w/v) by addition of adequate amount of double distilled water. Thoroughly mixed substrate was autoclaved (121.5°C for 1 h for two consecutive days) and allowed to cool at room temperature. The substrate was inoculated with 1 ml of fungal spore suspension (2 × 10⁷ spores/ml) and incubated at 26 ± 2°C for 72 h. Crude enzyme was extracted from fermented substrate by adding distilled water (100 ml) containing Tween 80 (0.1%) to the flasks. Flasks were kept on a rotary shaker at 150 rpm for 30 min for proper mixing, and centrifuged at 2240×g for 10 min at 4°C. The supernatant was collected and used as crude enzyme extract for enzyme estimation.
Estimation of Exo-Chitinase Activity
Exo-chitinase activity was estimated by dinitrosalicylic acid method [7] using colloidal chitin as substrate. One unit (U) of exo-chitinase activity is defined as the amount of enzyme that is required to release 1 μmol of N-acetyl-β-d-glucosamine per minute from 0.5% of dry colloidal chitin solution under standard bioassay conditions and expressed as Units per gram dry substrate (U gds−1) [8].
Single Variable Optimization for Exo-Chitinase Biosynthesis
Single variable optimization for maximum exo-chitinase yield in SSF was carried out. One variable was varied at a time keeping other variable constant, it included the incubation time (24–120 h), incubation temperature (20–45°C), pH (4–12), salt concentration (2–6% NaCl), effect of nitrogen sources such as peptone, yeast extract, urea, ammonium chloride, ammonium sulphate, casein and various carbon sources such as arabinose, fructose, d-glucose, mannose, starch, xylose. For each parameter optimization, three sets of independent experiments were carried out and the average values were reported.
Process Optimization Using RSM
Six variables, which were expected to have an effect on exo-chitinase production, identified by one-factor at a time approach was further analyzed using a two-level fractional factorial design developed by Montogomery [9]. According to two level six variable concepts, a fractional factorial design was considered with one centre point, which leads to 33 runs matrix. All the variables were taken as a central coded value considered as zero. The minimum and maximum ranges of variables investigated, and the full experimental plan with respect of their values in actual and coded form are listed in Table 1. The exo-chitinase yield was taken as the dependent variable or response (Y). The results of CCD were used to fit a second order polynomial equation represented as;
 |
where Y is predicted response; β0 is regression coefficient; β1, β2, β3, β4, β5 and β6 are linear coefficients; β12, β13, β14, β15, β16, β23, β24, β25, β26, β34, β35, β36, β45, β46 and β56 are interaction coefficients
Table 1.
Experimental range and levels of six independent variables studied using CCD in terms of actual and coded factors
| Variable(s) | Unit | Range of variables (coded/actual) | ||||
|---|---|---|---|---|---|---|
| −1.565 (α) | −1 | 0 | +1 | +1.565 (α) | ||
| Starch | g/l | 0.015 | 0.1 | 0.25 | 0.4 | 0.484 |
| Yeast extract | g/l | 0.015 | 0.1 | 0.25 | 0.4 | 0.484 |
| pH | 4–12 | 5.434 | 6 | 7 | 8 | 8.565 |
| NaCl (%) | g/l | 1.434 | 2 | 3 | 4 | 4.565 |
| Incubation temperature | oC | 27.174 | 30.0 | 35.0 | 40 | 42.825 |
| Incubation period | Hours | 24.698 | 36 | 56 | 76 | 87.301 |
Three dimensional response surface and contour presentations were plotted to find the optimal level of variables for maximum exo-chitinase production. The response surface curves were plotted for the variation in exo-chitinase yield as a function of the levels of two variables when all the other variables were kept at their central levels. The optimum level of each variable was identified based on the central point of the corresponding contour plot.
Evaluation of Enzyme Efficacy Against Fungal Pathogens Under In Vitro Condition
T. asperellum UTP-16 was cultured under SSF as optimized through RSM. The crude enzyme was extracted, as described above (SSF and enzyme extraction) and filtered through a sterile membrane (0.2 μm). The effect of the crude exo-chitinase on mycelial growth inhibition was evaluated against four phytopathogenic Fusaria (F. oxysporum f. sp. ciceri, F. oxysporum f. sp. lycopersici, F. solani and F. udum) using well diffusion method. Wells of 8 mm diameter were punched into the inoculated plates and filled with crude exo-chitinase (200 μl) in varied concentrations (100 and 50% diluted). The plates were incubated for 5–6 days at 26 ± 2°C and observed for growth inhibition zone.
Genomic DNA Extraction, ITS rRNA Gene Amplification and Sequencing
Genomic DNA was extracted using the method of Raeder and Broda [10]. ITS region was amplified using universal primer ITS1 and ITS4 [11]. The amplified PCR product were sequenced by ABI3100 Genetic Analyzer with both the primers. The sequences were compared with ITS rRNA gene sequence available in the NCBI GeneBank database using BLASTn program. Identification to the species level was determined as maximum homology (≥97%) to a strain sequence in the GenBank.
Statistical Analysis
In all the experiments, treatments were arranged in complete randomised block design. Analysis of variance was performed for each experiment and means were compared by using Turkey range test (P ≤ 0.05) (SPSS software Version 16). The analysis of central composite design (CCD) was carried out with the Design Expert ® software package (version 6.0, State-Ease Inc., Minneapolis, MN, USA).
Results and Discussion
Single Variable Optimization for Exo-Chitinase Production
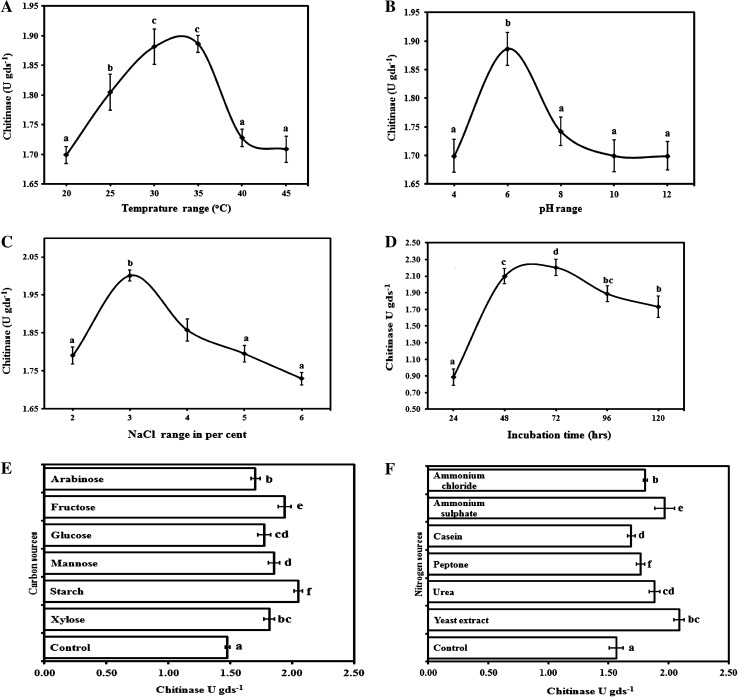
Every organism has its own restraint and optimal conditions for growth and enzyme production. T. asperellum UTP-16 showed significant amount of exo-chitinase production (1.67 U gds−1) on minimal media, and further selected for optimization. During single variable optimization (Fig. 1), T. asperellum UTP-16 gave maximum exo-chitinase yield (1.89 ± 0.01 U gds−1) at 35°C. Variation in incubation temperature adversely affected the exo-chitinase production, and on incubation period of 56 h, enzyme production (2.08 ± 0.10 U gds−1) was at peak. The different range of pH muscularly affects the growth and activity of all the microorganisms. Trichoderma spp. are well-known to grow on wide range of pH, but for enzymes production, it was reported from 4.6 to 6.8 [12]. T. asperellaum UTP 16 gave the maximum exo-chitinase activity at pH 6 (1.89 ± 0.03 U gds−1). Osmotic balances of cells are also equally important for enzyme production and maximum exo-chitinase activity (2.0 ± 0.01 U gds−1) was recorded at 3% NaCl. Similarly, the enhancement in exo-chitinase production was previously reported in Bacillus pumilus (SG-2) on addition of 3.5% of NaCl in SSF [13]. On the supplementation of wheat bran with most covenant carbon and nitrogen source for maximum enzyme production, maximum activity was observed on supplementation with starch (2.05 ± 0.04 U gds−1) as carbon source and yeast extract (2.09 ± 0.04 U gds−1) as nitrogen source as compared to others. This is in close conformity of the earlier report on utilization of cheap agricultural wastes for enzyme production such as rice bran and wheat bran supplemented with organic additives for many microorganism like Streptomyces violaceoruber, Trichoderma viride, and Penicillium chrysogenum [14–16].
Fig. 1.
Optimization of exo-chitinase production by T. asperellum UTP-16 using one variable at a time approach. The variables are A temperature, B pH, C NaCl, D incubation time, E carbon and F nitrogen sources
Process Optimization Using RSM
The interactions of six variables (starch, yeast extract, pH, NaCl, temperature and incubation time) having maximum influence on exo-chitinase activity were examined through CCD (Table 1). The resulted CCD experiments for investigating the effect of six independent variables along with the mean predicted and observed responses are presented in Table 2. The regression equation obtained after the analysis of variance (ANOVA) gave the level of exo-chitinase as a function of an initial value of the variables and the final response equation that represented a suitable model for exo-chitinase production is depicted below in terms of actual values.
 |
Table 2.
Results of CCD using six independent variables and eight centre points showing observed and predicted response
| Std | Starch (g) | Yeast extract (g) | pH | NaCl (%) | Temperature (oC) | Incubation period (h) | Actual value (U gds−1) | Predicted value (U gds−1) |
|---|---|---|---|---|---|---|---|---|
| 1 | 0.4 | 0.4 | 8 | 2 | 40 | 36 | 1.195 | 1.241 |
| 2 | 0.4 | 0.4 | 8 | 4 | 30 | 36 | 0.691 | 0.737 |
| 3 | 0.4 | 0.1 | 8 | 4 | 30 | 76 | 0.892 | 0.939 |
| 4 | 0.4 | 0.1 | 6 | 4 | 30 | 36 | 1.036 | 1.083 |
| 5 | 0.25 | 0.25 | 7 | 3 | 35 | 93.36 | 1.843 | 1.889 |
| 6 | 0.1 | 0.4 | 8 | 2 | 30 | 36 | 0.604 | 0.651 |
| 7 | 0.25 | 0.25 | 7 | 1.13 | 35 | 56 | 1.209 | 1.256 |
| 8 | 0.25 | 0.25 | 7 | 3 | 35 | 56 | 2.995 | 2.888 |
| 9 | 0.4 | 0.25 | 5.13 | 3 | 35 | 56 | 4.017 | 4.064 |
| 10 | 0.25 | 0.25 | 8.87 | 3 | 35 | 56 | 0.230 | 0.123 |
| 11 | 0.1 | 0.1 | 6 | 4 | 40 | 36 | 1.368 | 1.414 |
| 12 | 0.53 | 0.25 | 7 | 3 | 35 | 56 | 1.857 | 1.750 |
| 13 | 0.4 | 0.4 | 6 | 2 | 40 | 76 | 0.936 | 0.982 |
| 14 | 0.1 | 0.1 | 8 | 4 | 40 | 76 | 1.785 | 1.832 |
| 15 | 0.1 | 0.4 | 6 | 2 | 30 | 76 | 3.110 | 2.198 |
| 16 | 0.25 | 0.25 | 7 | 3 | 44.34 | 56 | 3.916 | 3.809 |
| 17 | 0.1 | 0.4 | 8 | 4 | 40 | 36 | 0.892 | 0.939 |
| 18 | 0.25 | 0.25 | 7 | 3 | 35 | 18.64 | 0.619 | 0.512 |
| 19 | 0.1 | 0.1 | 8 | 2 | 30 | 76 | 0.460 | 0.507 |
| 20 | 0.4 | 0.1 | 8 | 2 | 40 | 76 | 1.756 | 1.649 |
| 21 | 0.25 | 0.53 | 7 | 3 | 35 | 56 | 0.633 | 0.680 |
| 22 | 0.25 | 0.25 | 7 | 3 | 35 | 56 | 0.172 | 0.065 |
| 23 | 0.25 | 0.25 | 7 | 4.87 | 35 | 56 | 0.057 | 2.198 |
| 24 | 0.1 | 0.4 | 6 | 4 | 40 | 76 | 2.620 | 2.514 |
| 25 | 0.25 | 0.25 | 7 | 3 | 35 | 56 | 2.044 | 2.091 |
| 26 | 0.25 | 0.03 | 7 | 3 | 35 | 56 | 1.800 | 2.198 |
| 27 | 0.25 | 0.25 | 7 | 3 | 35 | 56 | 2.779 | 2.198 |
| 28 | 0.25 | 0.25 | 7 | 3 | 25.66 | 56 | 3.168 | 3.061 |
| 29 | 0.03 | 0.25 | 7 | 3 | 35 | 56 | 1.497 | 1.391 |
| 30 | 0.1 | 0.1 | 6 | 2 | 30 | 36 | 2.044 | 2.091 |
| 31 | 0.25 | 0.25 | 7 | 3 | 35 | 56 | 1.915 | 1.808 |
| 32 | 0.4 | 0.1 | 6 | 2 | 40 | 36 | 2.707 | 2.198 |
| 33 | 0.4 | 0.4 | 6 | 4 | 30 | 76 | 1.339 | 1.232 |
Where: Y is the level of exo-chitinase (response) as a function of starch (A), yeast extract (B), pH (C), NaCl (D), temperature (E) and incubation time (F).
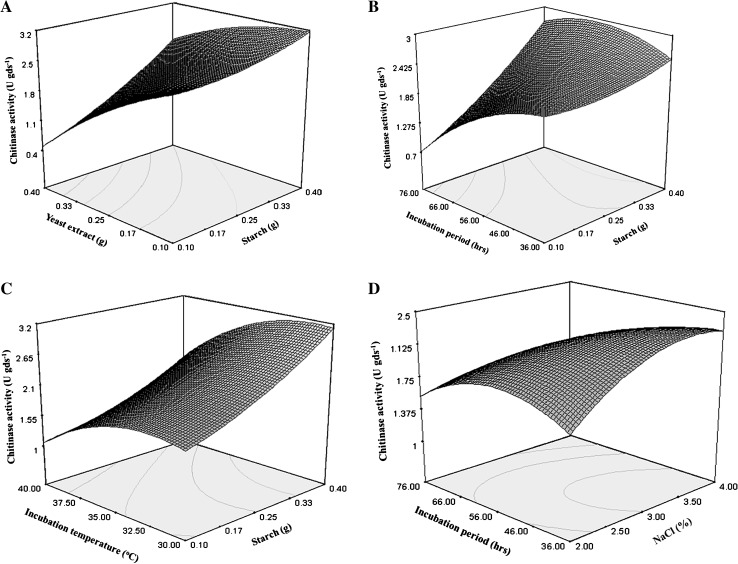
The regression equation indicates that coefficient of determination (R2) was 0.82 for exo-chitinase production. The R2 value provides a gauge of variability to observed activity response, value closer to 1 shows strength of model with all predictions, and present model explained 82% of variability. The optimal levels of variables were determined by constructing three dimensional surface plots of exo-chitinase response was plotted on z-axis against two independent variables. Figure 2 showed the response of exo-chitinase in presence of starch with yeast extract, incubation period and incubation temperature and incubation period with NaCl concentration. It was observed that exo-chitinase yield increased with increasing the level of starch supplementation to substrate up to 0.4% (3.20 U gds−1).
Fig. 2.
Response surface plots of exo-chitinase activity of T. asperellum UTP-16 at concentration as a function of: A yeast extract and starch, B incubation period and starch, C incubation temperature and starch, D incubation period and NaCl
The interactive effect of yeast extract and starch on exo-chitinase yield clearly showed that at lower amount of yeast extract with an increase in starch level significantly enhanced exo-chitinase yield. Al-Taweil and associates [15] reported that biomass production of T. viride increased significantly by increasing the carbon source while the nitrogen remains at lower levels. The chitinase yield was reached at maximum level on 56 h. of incubation followed by gradual decrease. This might be because of increase in biomass. However after a certain limit, the depletion of nutrient resulted in decreased metabolic activity, there was a stability between proliferating biomass and the availability of nutrients that supports the production of enzyme [13]. Contrarily, the present study recorded decrease in exo-chitinase yield with addition of yeast extract in substrate. A sharp increase in exo-chitinase yield was observed with decrease of pH. Incubation temperature and starch supplementation interaction showed that exo-chitinase production lessen with increase of incubation temperature while, rise with increase in starch level. Exo-chitinase yield was significantly influenced by NaCl concentration. Significant enhancement in exo-chitinase yield was observed with supplementation of NaCl up to 3% followed by gradual decline. The result clearly indicates that significant enhancement in exo-chitinase production could be achieved by T. asperellum UTP-16 using the statistical designs and the most critical factors identified in the present study. Medium optimization by a conventional one variable at-a time approach led to a substantial increase in enzyme yield. However, this approach is not only cumbersome and time consuming, but also has the limitation of ignoring the importance of interaction of various physiological parameters. The statistical approach using RSM can be efficiently used for multivariable optimization in biological systems [14, 17]. The RSM model developed in present study satisfied all the necessary arguments for its use in optimization with 21.15% increase in exo-chitinase activity.
Antifungal Activity of Exo-Chitinase Under In Vitro Conditions
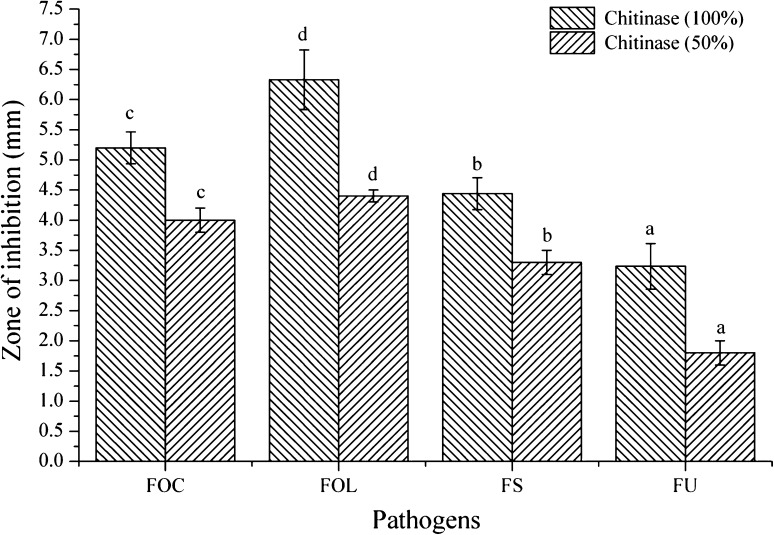
Antifungal activity of crude exo-chitinase extract was observed against all the fungal pathogens and maximum zone of inhibition was recorded against F. oxysporum f. sp. ciceri (5.2 mm), F. oxysporum f. sp. lycopersici (6.3 mm) followed by F. solani (4.4 mm) and F. udum (3.3 mm). Diluted (50%) enzyme extract showed similar pattern but zone of inhibition was marginally reduced (Figs. 3, 4, 5). It is known that the extracellular cell wall degrading enzymes are the main mechanism involved in the biological control of fungi by T. harzianum, moreover, the physiological function of exo-chitinase depends on their source [18].
Fig. 3.
Antifungal activity of crude exo-chitinase extract of T. asperellum UTP-16 against different phytopathogenic Fusarium (FOC F. oxysporum f. sp. ciceri, FOL F. oxysporum f. sp. lycopersici, FS F. solani, and FU F. udum)
Fig. 4.
Exo-chitinase production of T. asperellum UTP-16 under different experimental conditions
Fig. 5.
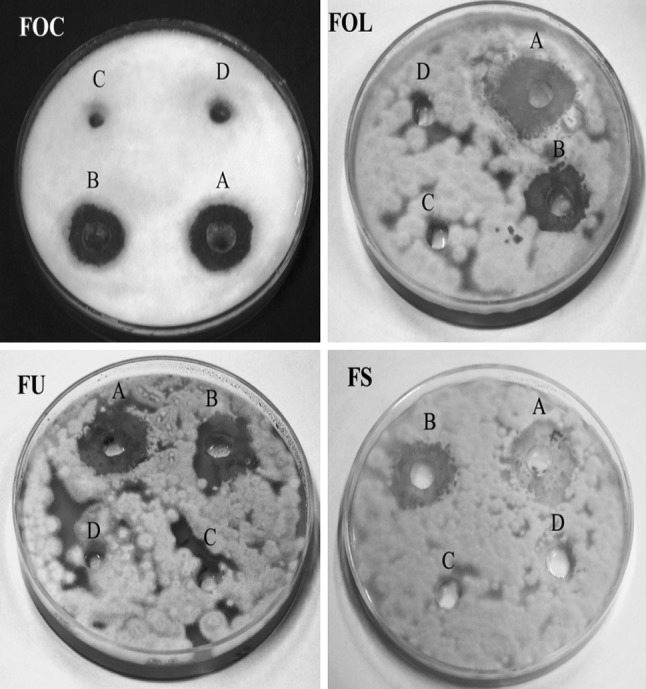
Antifungal activity of crude exo-chitinase extract of T. asperellum UTP-16 against F. oxysporum f. sp. Ciceri (FOC), F. oxysporum f. sp. lycopersici (FOL), F. solani (FS) and F. udum (FU) at different concentration [A-100%, B-50%, C-culture filtrate extract of bacteria not showing antagonism, and D-negative control (sterile water only)]
Identification
The isolate UTP-16 was identified as T. asperellum on the basis of ITS rDNA sequence similarity in the GeneBank database through BLASTn programme and the sequence was submitted to NCBI GeneBank database under the accession number FJ640576.
Conclusion
RSM is the most effective tool for optimization with multivariable factors to produce more precise, appropriate and reproducible results for maximum production of enzymes with least cumbersome and cost effective way. Wheat bran is a cheap agro waste substrate and can be used for biomass and exo-chitinase production by T. asperillum UTP-16. The mycelia growth inhibition of phytopathogenic Fusaria by crude exo-chitinase preparation indicates its possible use as a biocontrol agent against these pathogens. However, in fact, Trichoderma based products were stretched in disease management system but application of exo-chitinase in disease management is still limited. So, the present investigation could make a derivation to expand this narrative type of Trichoderma-protein based consortia’s for eco-friendly disease management. Moreover, extensive studies will be required to develop Trichoderma plus exo-chitinase based formulations.
Acknowledgment
This study has been carried out under the networking project ‘‘Application of Microorganisms in Agricultural and Allied Sectors’’ and financially supported by Indian Council of Agricultural Research (ICAR), New Delhi, India.
References
- 1.Henrissat B, Bairoch A. New families in the classification of glycosyl hydrolases based on amino acid sequence similarities. Biochem J. 1993;293:781–788. doi: 10.1042/bj2930781. [DOI] [PMC free article] [PubMed] [Google Scholar]
- 2.Aloise PA, Lumme M, Aynes CA. N-Acetyl-d-glucosamine production from chitin-waste using chitinases from Serratia marcescens. In: Muzzarelli RAA, editor. Chitin enzymology. Italy: Ncona; 1996. pp. 581–594. [Google Scholar]
- 3.Solanki MK, Singh N, Singh RK, Singh P, Srivastava AK, Kumar S, Kashyap PL and Arora DK (2010) Plant defense activation and management of tomato root rot by a chitin-fortified Trichoderma/Hypocrea formulation. Phytoparasitica. doi:10.1007/s12600-011-0188-y
- 4.Sandhya C, Sumantha A, Szakacs G, Pandey A. Comparative evaluation of neutral protease production by Aspergillus oryzae in submerged and solid-state fermentation. Process Biochem. 2005;40:2689–2694. doi: 10.1016/j.procbio.2004.12.001. [DOI] [Google Scholar]
- 5.Nampoothiri M, Baiju TV, Sandhya C, Sabu A, George S, Ashok P. Process optimization for antifungal chitinase production by Trichoderma harzianum. Process Biochem. 2004;39:1583–1590. doi: 10.1016/S0032-9592(03)00282-6. [DOI] [Google Scholar]
- 6.Nawani NN, Kapadnis BP. Optimization of chitinase production using statistics based experimental designs. Process Biochem. 2005;40:651–660. doi: 10.1016/j.procbio.2004.01.048. [DOI] [Google Scholar]
- 7.Miller GL. Use of dinitrosalicylic acid reagent for determination of reducing sugar. Anal Chem. 1959;31:426–429. doi: 10.1021/ac60147a030. [DOI] [Google Scholar]
- 8.Pandey A, Soccol CR, Mitchell DA. New development in solid state fermentation: 1-bioprocess and products. Process Biochem. 2000;35:1153–1169. doi: 10.1016/S0032-9592(00)00152-7. [DOI] [Google Scholar]
- 9.Montogomery DC. Design and analysis of experiments. 4. New York: Wiley; 1997. [Google Scholar]
- 10.Raeder U, Broda P. Rapid preparation of DNA from filamentous fungi. Lett Appl Microbiol. 1985;1:17–20. doi: 10.1111/j.1472-765X.1985.tb01479.x. [DOI] [Google Scholar]
- 11.White TJ, Bruns T, Lee S and Taylor J (1990) Amplification and direct sequencing of fungal ribosomal RNA genes for phylogenetics. In: PCR protocols: a guide to methods and applications. Academic Press, New York, pp 315–322
- 12.Kolombet LV, Zhigletsova SK, Kosareva NI, Bystrova EV, Derbyshe VV, Krasnova SP, Schisler D. Development of an extended shelf-life, liquid formulation of the biofungicide Trichoderma asperellum. World J Microbiol Biotechnol. 2008;24:123–131. doi: 10.1007/s11274-007-9449-9. [DOI] [Google Scholar]
- 13.Matsumoto Y, Saucedo CG, Revah S, Shirai K. Production of b-N-acetylhexosaminidase of Verticillium lecanii by solid state and submerged fermentations utilizing shrimp waste silage as substrate and inducer. Proc Biochem. 2004;39:665–671. doi: 10.1016/S0032-9592(03)00140-7. [DOI] [Google Scholar]
- 14.Khurana S, Kapoor M, Gupta S, Kuhad RC. Statistical optimization of alkaline xylanase production from Streptomyces violaceoruber under submerged fermentation using response surface methodology. Indian J Microbiol. 2007;47:144–152. doi: 10.1007/s12088-007-0028-4. [DOI] [PMC free article] [PubMed] [Google Scholar]
- 15.Al Taweil HI, Osman MB, Aidil AH, Yussof WMW. Optimizing of Trichoderma viride cultivation in submerged state fermentation. Am J Appl Sci. 2009;6:1277–1281. doi: 10.3844/ajassp.2009.1277.1283. [DOI] [Google Scholar]
- 16.Patidar P, Agrawal D, Banerjee T, Patil S. Optimization of process parameters for chitinase production by soil isolates of Penicillium chrysogenum under solid substrate fermentation. Proc Biochem. 2005;40:2962–2967. doi: 10.1016/j.procbio.2005.01.013. [DOI] [Google Scholar]
- 17.Maiza AL, Dayane SG, Maria GBK, Carlos PPI, Julio CDC, Aristoteles GN, Fabienne M. Use of response surface methodology to examine chitinase regulation in the basidiomycete Moniliophthora perniciosa. Mycol Res. 2008;112:399–406. doi: 10.1016/j.mycres.2007.10.017. [DOI] [PubMed] [Google Scholar]
- 18.Howell CR. Mechanisms employed by Trichoderma species in the biological control of plant diseases: the history and evolution of current concepts. Plant Dis. 2003;87:4–10. doi: 10.1094/PDIS.2003.87.1.4. [DOI] [PubMed] [Google Scholar]


