Figure 2.

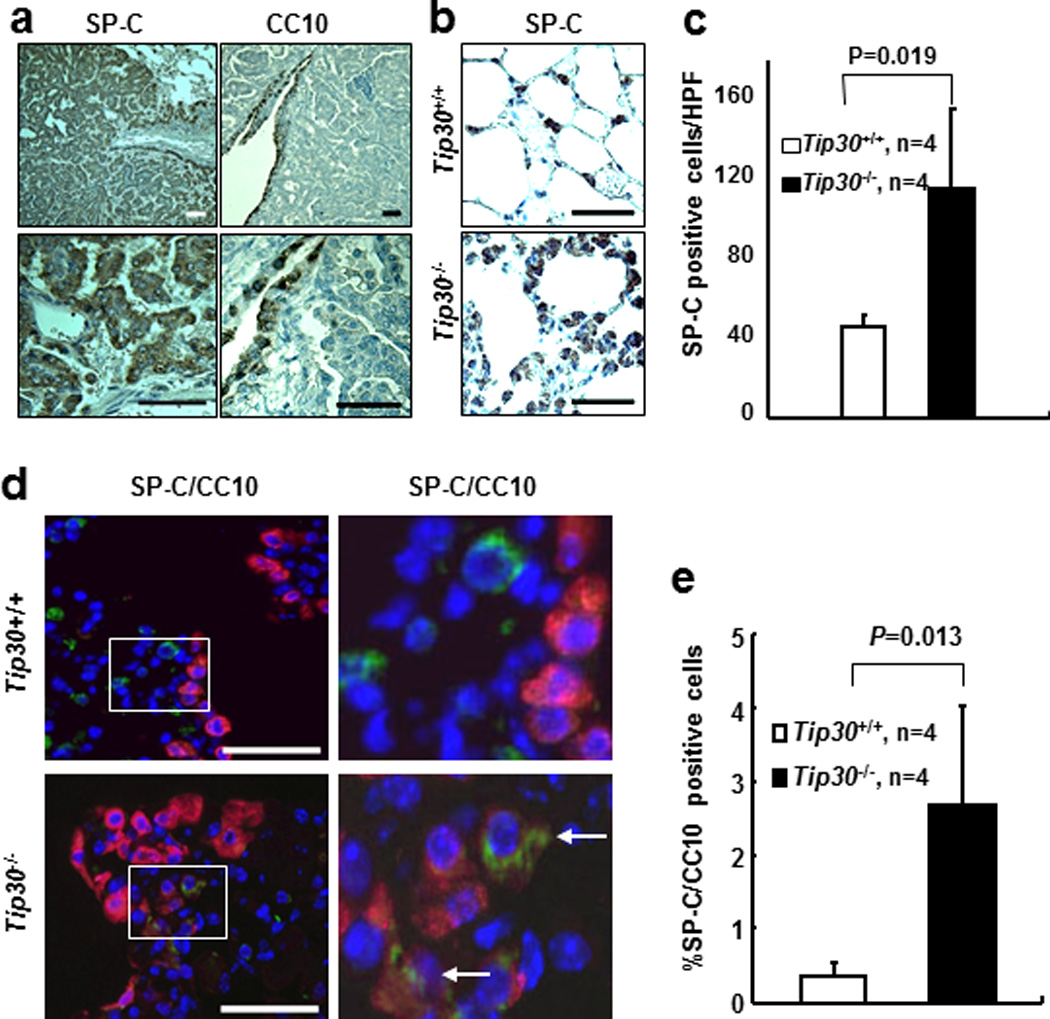
Immunostaining for SP-C, CC10 in lung tissues and tumors. Scales bar, 20µm. (a) Representative Images show SP-C positive cells in lung tumors and CC10 positive cells in the bronchiole. (b) Representative Images show SP-C positive cells in lung alveoli. (c) Quantification of SP-C positive cells in lung alveoli. SP-C positive cells were counted in 5 randomly selected high power fields (HPF) per slide. Graph shows the numbers (mean ± SEM) of SP-C positive cells per HPF. (d) Dual SP-C (green) and CC10 (red) positive cells at bronchoalveolar duct junction (BADJ). Dual SP-C/CC10 positive cells at BADJ are indicated with arrowheads. (e) Graph shows the percentages of dual SP-C/CC10 positive cells relative to CC10-positive cells at BADJ in lung sections.
