
Figure 5.
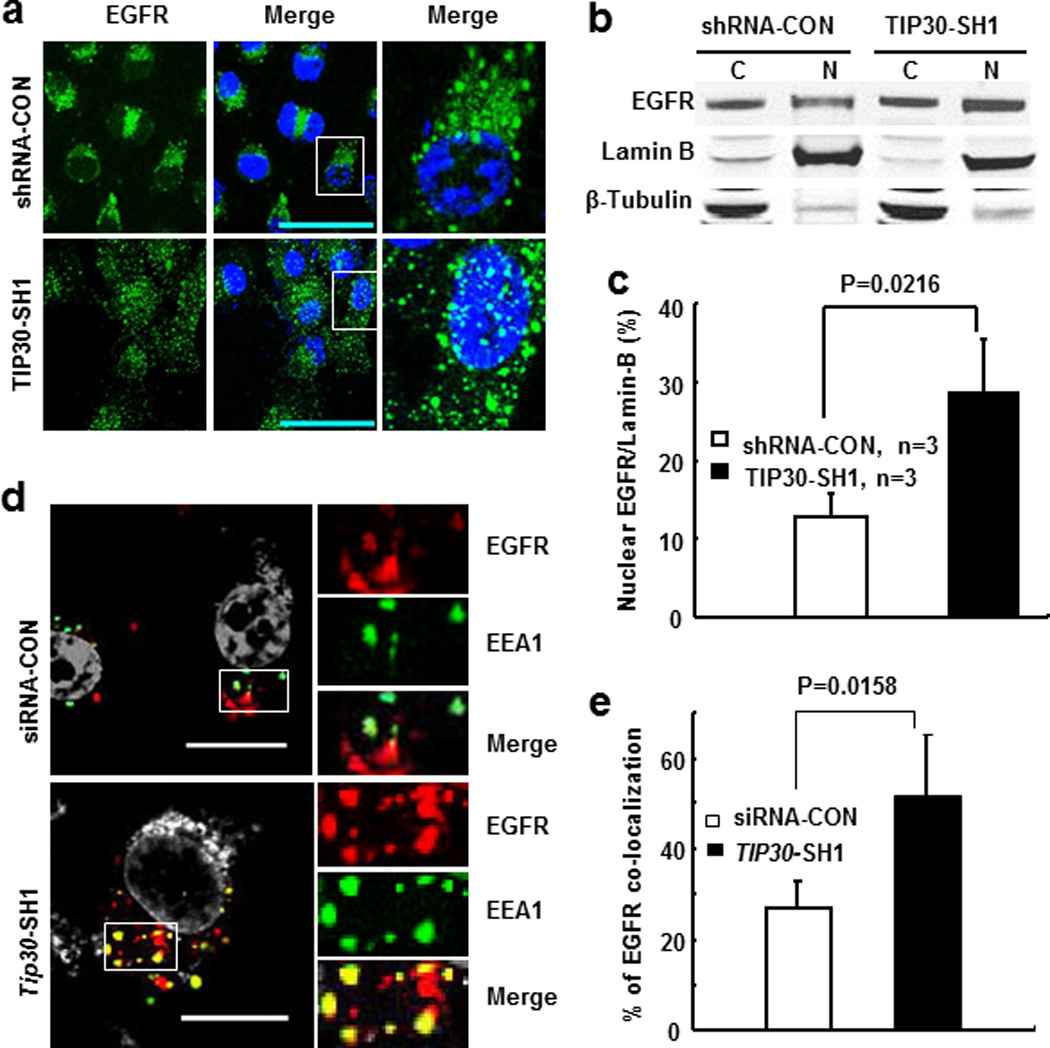
Effect of TIP30 knockdown on EGFR trafficking and nuclear localization inducing by EGF in A549 cells. (a) Representative images of EGFR (green) in human A549 cells. Cells were treated with 5 ng/ml EGF and 10 nM leptomycin B in DMEM for 2 hours were then stained for EGFR. Nuclei were stained by DAPI (blue). (b) Western blot analysis of EGFR nuclear localization. A549 cells were collected after EGF treatment for 3 hours. (c) Quantification of nuclear EGFR levels detected in Western blot analysis. Values are nuclear EGFR levels relative to Lamin-B levels. Data are represented as the means of three independent experiments. (d) Representative images show the localization of EGFR (red) in EEA-1 positive early endosomes (green) after 2 hours of EGF internalization. Yellow is due to overlap between red and green. Boxed areas are magnified. (e) Quantification of EGFR and EEA1 colocalization. * P < 0.05 versus control. Shown are representative of three experiments. Scale bars, 10 µm.