Abstract
A comprehensive transcriptome analysis has been performed on protein-coding RNAs of Strongylocentrotus purpuratus, including 10 different embryonic stages, six feeding larval and metamorphosed juvenile stages, and six adult tissues. In this study, we pooled the transcriptomes from all of these sources and focused on the insights they provide for gene structure in the genome of this recently sequenced model system. The genome had initially been annotated by use of computational gene model prediction algorithms. A large fraction of these predicted genes were recovered in the transcriptome when the reads were mapped to the genome and appropriately filtered and analyzed. However, in a manually curated subset, we discovered that more than half the computational gene model predictions were imperfect, containing errors such as missing exons, prediction of nonexistent exons, erroneous intron/exon boundaries, fusion of adjacent genes, and prediction of multiple genes from single genes. The transcriptome data have been used to provide a systematic upgrade of the gene model predictions throughout the genome, very greatly improving the research usability of the genomic sequence. We have constructed new public databases that incorporate information from the transcriptome analyses. The transcript-based gene model data were used to define average structural parameters for S. purpuratus protein-coding genes. In addition, we constructed a custom sea urchin gene ontology, and assigned about 7000 different annotated transcripts to 24 functional classes. Strong correlations became evident between given functional ontology classes and structural properties, including gene size, exon number, and exon and intron size.
The genome of Strongylocentrotus purpuratus, commonly known as the “purple sea urchin,” was published in 2006 (Sea Urchin Genome Sequencing Consortium 2006). This organism has long served as an important research model in many different fields of developmental and cell biology, and currently S. purpuratus is the focus of advanced studies on the gene regulatory networks underlying its embryonic development (Oliveri et al. 2008; Peter and Davidson 2009, 2011). For this and the many other areas of contemporary molecular and cell biology in which S. purpuratus plays a prominent role, progress is directly affected by the accuracy of the annotated gene models available in the current genome builds. The initial set of gene models was obtained by merging four different sequence-based approaches to computational gene prediction: Ensembl pipeline, NCBI gnomon, FgenesH, and Genscan, using the GLEAN algorithm (Sodergren et al. 2006). The GLEAN result was evaluated using a set of ∼600 cDNA/ESTs that were not used in any of the gene prediction programs, and was considered better than any single algorithm. But much subsequent experimental work indicated anecdotally that many of the computational gene models are in various respects inaccurate. Here we address this problem with the aid of a large-scale transcriptome analysis carried out using current RNA sequencing technology. This method has very low background noise, a large dynamic range, and single-nucleotide resolution (Wang et al. 2009). We have thus generated a comprehensive gene model data set for S. purpuratus, derived from analysis of transcriptomes of many embryonic stages, larvae, and adult tissues. Approximately half of all of the a priori computational gene models have been improved in one respect or another, many deeply revised, and the rest have been empirically confirmed. In addition, we report quantitative distributions of the structural characteristics of sea urchin protein-coding genes, and of sea urchin mRNA populations that have not previously been available.
Results
Quantitative aspects of the transcriptome data set
We are interested in protein-coding transcripts expressed at biologically meaningful levels. In sea urchin embryos, a very important class of transcripts for which expression is meaningful at relatively low levels is that encoding transcription factors. Fortunately there exists a great deal of quantitative information with respect to the levels of these mRNAs that could be meaningful, based on earlier measurements of many key kinetic parameters determining their interactions with DNA and their synthesis and turnover (Bolouri and Davidson 2003). In addition, a high-resolution NanoString data set providing the actual numbers of mRNAs per embryo through developmental time for almost 200 specific transcripts encoding regulatory proteins has recently been published by this laboratory (Materna et al. 2010). Thus, we set the sensitivity (depth) of our transcriptome analysis such that it would easily provide coverage in depth of mRNAs encoding transcription factors. In the sea urchin embryo, the number of regulatory mRNA molecules of each species, averaging over all regulatory genes at all embryonic time points, is typically only several hundred per embryo (fertilization to 48-h late gastrula; the embryo is a constant size, constant mass system over this period). This suffices to provide more than the minimal effectively meaningful level of a regulatory gene mRNA in those cells expressing each such gene, i.e., at least 10–40 molecules of mRNA of each active species per cell. Unlike some previous studies aimed at detecting extremely low levels of transcripts in mammalian cells (Blencowe et al. 2009; Toung et al. 2011), our objectives were to obtain reliable data regarding mRNAs that clearly function as protein-coding transcripts, rather than extremely rare noncoding transcripts, and previous work suggested that these objectives could be met at a modest depth of RNA sequence (Tarazona et al. 2011). Initial experiments were designed to determine the amount of sequencing necessary to measure reliably the abundance of mRNAs present at several hundred per embryo and up. If all transcripts >10/embryo are measured in an embryonic transcriptome, the mean value is 439/embryo (computed from data from Materna et al. 2010); in other words, most transcript species are relatively rare, but not below the levels that could be considered significant on a priori grounds.
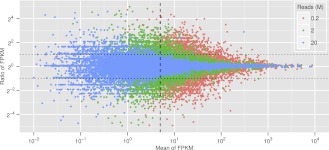
To carry out the necessary pilot experiment, mRNA was extracted from mesenchyme blastula-stage embryos (24 h post-fertilization, hpf), and it was spiked with known amounts of seven RNAs from heterologous species (Mortazavi et al. 2008). A sequencing library was run on an Illumina GAIIx instrument in two lanes, each generating ∼20 million (M) reads. The reads were mapped to the S. purpuratus genome using the standard RNA sequencing packages Bowtie (Langmead et al. 2009) and TopHat (Trapnell et al. 2009). The prevalence of each transcript species was estimated by Cufflinks (Trapnell et al. 2010) from the number of reads mapped to the respective GLEAN gene model, normalized by transcript length and by total mapped reads. Thus the prevalence reported by Cufflinks is given as FPKM (fragments per kilobase of transcript, per million fragments sequenced), similar to RPKM (reads per kilobase of gene model exon, per million mapped reads), a measure used earlier (Mortazavi et al. 2008). The complete 20M read set from each lane and randomly chosen subsets of 2M and 0.2M reads from each lane were then compared statistically (Fig. 1). Here we see for the three read depths a scatterplot showing on the ordinate the ratio of the two FPKM estimates of prevalence for each transcript species plotted against its mean prevalence on the abscissa, i.e., the average of the two FPKM values for each transcript species (“ratio-intensity” plot). In Figure 1 the ordinate is shown in units of log2 and the abscissa in units of log10. The vertical scatter clearly reveals the expected: the more reads the less scatter, particularly at lower prevalence. From the spiked standards, FPKM values can be expressed in absolute terms as numbers of transcripts in the sample, and this, in turn, can be expressed as number of transcripts of each given mRNA species per embryo, since the amount of mRNA per embryo is known (30 pg) (Davidson 1986). Thus, an FPKM of 5 (vertical dashed line in Fig. 1) is about 400 molecules of transcript per embryo, close to a general lower level of biological significance for one of the least prevalent classes of transcript, those encoding transcription factors. Figure 1 shows that in the 20M read sample, for the four orders of magnitude above FPKM = 5, replicate prevalence values fall within a factor of 2. This can be regarded as an acceptable variance, and we concluded that for the sea urchin embryo, a single Illumina GAIIx lane of 20M reads suffices to provide a reliable estimate of mRNA prevalence over the range of biological interest.
Figure 1.
Computational simulation of quantitative variations at different sequencing depths. The ordinate, ratio of FPKM per transcript species in the two data sets compared, is given in log2; the abscissa, mean of the two FPKM values, in log10. (Blue dots) 20 million (M) reads; (green dots) 2M reads; (red dots) 0.2M read. (Vertical dashed line) Average FPKM 5; (horizontal dotted lines) ± twofold change. The plot shows that in the 20M read data set, prevalence estimations for almost all mRNAs over FPKM 5 are within twofold.
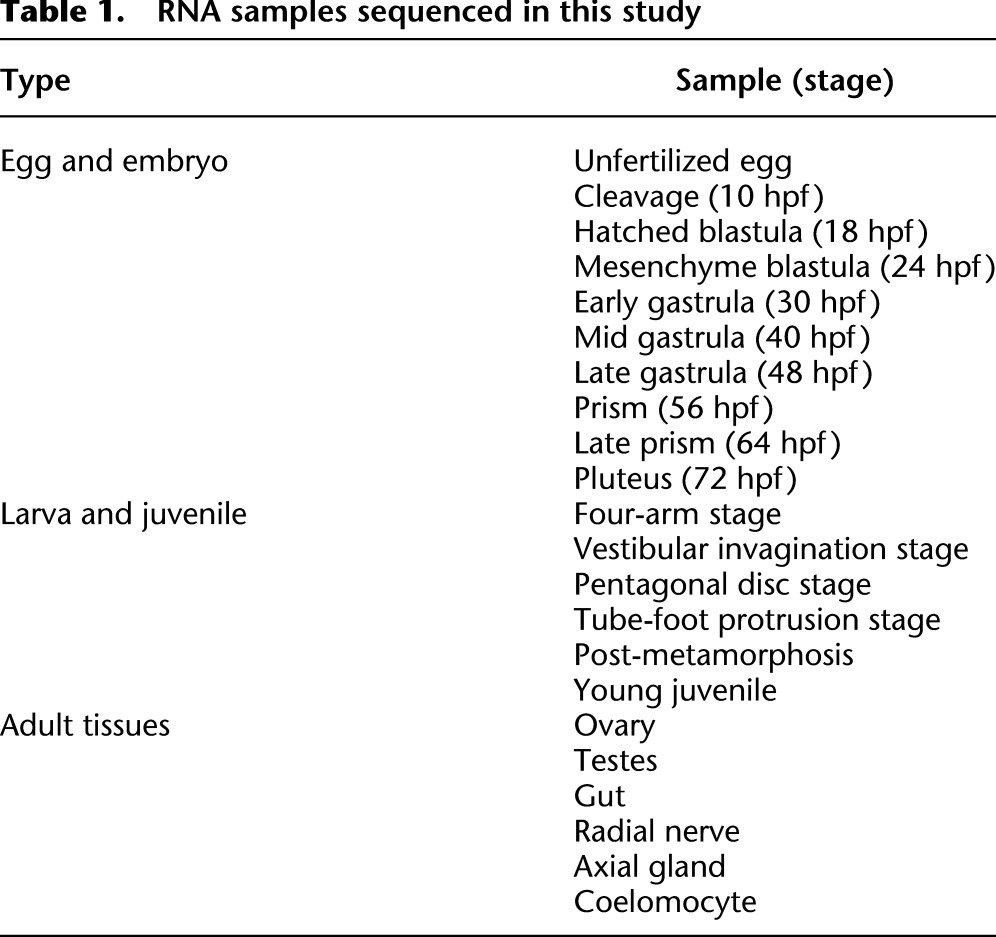
RNA samples were collected from 10 embryonic stages, from post-embryonic larval stages through metamorphosis, from juveniles, and from a variety of adult tissues (Table 1). In all, 22 samples were subjected to sequencing and analysis. All developmental stages (except that used for the experiment of Fig. 1) were from the same parental animals in order to minimize biological variation. On average, 35.6M 76-bp pair-end reads were obtained for each sample, and in total, the 22 samples yielded 784M reads. Of these 621M (79%) could be mapped to the S. purpuratus genome v3.0 downloaded from SpBase (Cameron et al. 2009).
Table 1.
RNA samples sequenced in this study
Transcriptome-based gene models
Raw gene models built by the Cufflinks assembly program are subject to various interpretive difficulties, particularly when they are generated from a very large data set. For example, loci that are represented by low-abundance transcripts in any one sample can sometimes be assembled into gene models by pooling samples, but such constructs may not be biologically meaningful. To remove as many false results as possible, and to ensure the best quality of the final outcome of the analysis, a set of conservative filters was applied to the assembly of raw gene models. To pass the filter, a gene model must meet all of the following three criteria: (1) the length of the model must be larger than 400 bp (since the cDNA fragments selected in the sequencing library preparation process are ∼300 bp, small transcripts are not likely to be sequenced anyway); (2) the FPKM of the model must be over 0.5, which equates to a minimum coverage of ∼50×; and (3) the model should have some potential protein-coding capacity. We accepted for this criterion any of the following: (3a) an exon of the model overlaps with an exon of the GLEAN gene model in the genomic sequence; (3b) the model has a significant (e-value < 1 × 10⁻¹⁰) hit in the SWISS-PROT database; or (3c) the model has an ORF longer than 500 bp and includes more than one exon. We noticed that some “isoforms” differ in only a few base pairs at the exon boundary, probably due to minor inaccuracies in read mapping, and these were pooled. Isoforms were regarded as true if they displayed distinct exon usage. In several instances, it was necessary to curate gene models manually.
After applying these filters, 21,092 transcript-based gene models were obtained. This is to be compared to the ∼23,000 genes predicted to exist in the S. purpuratus genome. From short read data it is, however, difficult to determine the number of isoforms that these genes generate. Most of the gene models satisfied more than one of the protein-coding criteria (Supplemental Fig. S1). More than half (56%) were supported by all three kinds of evidence for protein-coding capacity; 26% were supported by two; and 18% by only one. It is important to note that 16% (3421) of all of the transcriptome models are novel with respect to the GLEAN gene predictions. They were retained due to a significant match to the SWISS-PROT database (10.7%) or to the presence of a long ORF (6.5%; these possible genes require further validation). A large majority of the genes, 85% (17,942), are represented at significant levels of expression (FPKM > 5) in at least one of the transcriptomes studied.
The “vital statistics” of S. purpuratus protein-coding genes
Based on the filtered gene models, coding sequences (CDS) for the transcripts were predicted. For each reconstructed mRNA, ORFs (>150 bp) were identified and searched against the SWISS-PROT database by BLAST. The ORF with the best hit, or alternatively the longest one, is assigned as the CDS. However, many CDSs cannot be comprehensively assigned in this manner, since the reading frame runs off the end of the sequences. This could introduce an unknown bias when calculating the length distribution of CDS and 3′ untranslated regions (3′ UTRs). Thus, a subset of transcripts (19,998, 69%) that have both 5′ and 3′ UTRs was used for the calculation of CDS and UTR features in order to avoid distortions caused by the problem of uncertain 3′ UTRs.
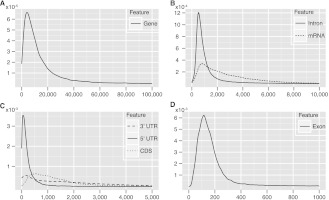
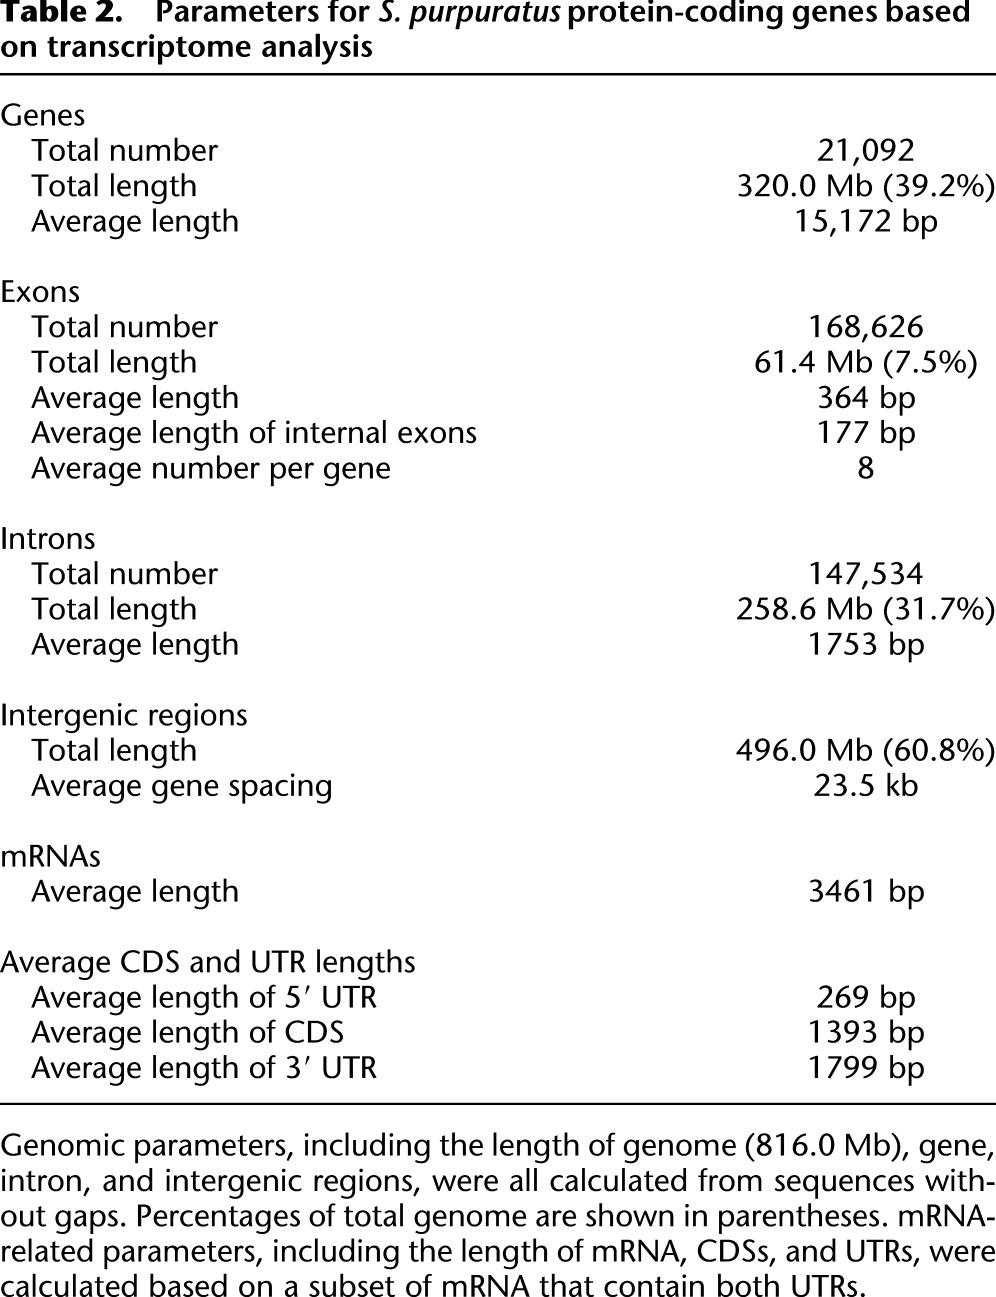
Several interesting parameters can be calculated from these data sets, as summarized in Figure 2 and Table 2. The length distributions of genes, exons, introns, complete mRNAs, 3′ UTRs, and CDS all display extremely long tails (Fig. 2). The lengths of mRNAs, CDSs, and 3′ UTRs extend over a large range, while the distribution of 5′-UTR lengths is typically narrow. An average sea urchin protein-coding gene is 15.2 kb long and contains eight exons, the average length of which is 364 bp, and all exons together add up to 7.5% of the genome. However, these values are skewed by inclusion of the 3′ terminal exon, which includes the long 3′ UTR. If we consider only the internal exons, which usually exclusively contain coding sequences, we see that the average length of 177 bp is directly comparable to that computationally predicted for protein-coding exons from the genomic sequences of other deuterostomes: for amphioxus, 204 bp (http://genome.jgi-psf.org/Brafl1/Brafl1.info.html) (Putnam et al. 2008) and for various vertebrates 150–180 bp (Zhu et al. 2009; Koralewski and Krutovsky 2011). The average length of an intron in a sea urchin gene is 1753 bp, and all introns together total 31.7% of genome, while the intergenic regions total 60.8% of the genome. On average, genes are spaced 23.5 kb apart. The mean mRNA length is 3.5 kb, of which the 5′ UTR, CDS, and 3′ UTR, respectively, account for ∼8%, 40%, and 52%, respectively. Thus the length of coding sequence in the genome, 40% of total exon length, is 24.6 Mb, only 3.0% of the whole genome.
Figure 2.
Length distributions of protein-coding genes and their components. Essentially these plots are smoothed versions of a histogram where the ordinate represents the frequency of the given length in base pairs. All distributions have very long tails, and the plots only show part of the distributions: (A) genes, 0–100 kb; (B) introns and mRNA, 0–10 kb; (C) UTRs and CDS, 0–5 kb; (D) exons, 0–1 kb.
Table 2.
Parameters for S. purpuratus protein-coding genes based on transcriptome analysis
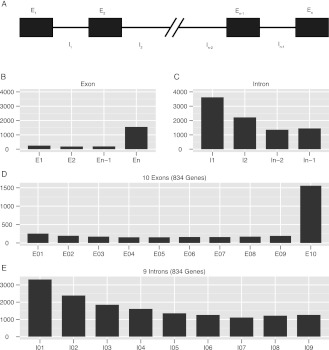
We also calculated average exon and intron length differences with respect to their relative positions in genes (Fig. 3). Genes with five or more exons were selected, and the average lengths of the first, second, last, and second to last exons, and the lengths of the introns were calculated (Fig. 3A). The last exon that encodes the 3′ UTR is always, of course, the longest (Fig. 3B), while the first intron is the longest (Fig. 3C); these results are consistent with previous reports on various genomes (Maroni 1996; Bradnam and Korf 2008). When length differences of exons and introns for genes as a function of number of exons were calculated, there emerged the clear trend that intron length becomes shorter the farther from the transcription start site. Statistics for genes with 10 exons and nine introns illustrate this, as shown in Figure 3, D and E.
Figure 3.
Lengths of exons and introns with respect to their relative positions in genes. (A) Labeling method for introns and exons used in the following panels. (B,C) Average length of exons and introns diagrammed in A. (D,E) Average length of each exon and intron in all genes containing 10 exons.
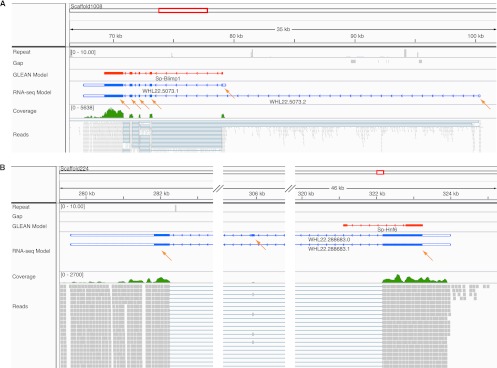
To facilitate the use of these gene models, we set up a query tool, which retrieves detailed information on the transcriptome-based gene models, including the corresponding GLEAN gene model, the functional ontology class to which the gene belongs (see below), the mRNA and protein sequences, and the expression dynamics of the gene in embryogenesis, by line plots or heat maps. The data including gene structure, sequencing coverage, and mapped reads are available through the Integrative Genomics Viewer (Robinson et al. 2011), which is a stand-alone desktop genome browser with the important characteristic of fast data loading and many other convenient features including pan and zoom capability. Multiple tracks are included on the data server, representing genomic sequence features, GLEAN gene models, transcriptome gene models, RNA sequencing coverage, and reads (Fig. 4). All of these query and visualization tools are available via SpBase, the public sea urchin genome database (http://www.spbase.org/SpBase/rnaseq/).
Figure 4.
Discrepant predicted and observed gene structure displayed in the IGV genome browser. A selectable variety of aligned features is shown in horizontal tracks with the feature label to the left: Repeat sequences (gray; shows the number of matches using 76-bp sequence windows in the whole genome, using Bowtie with the same parameters as when mapping the reads); Gap (gray; sequence regions of the genome assembly that lie in gaps and are therefore undetermined; several short gaps are shown in A); GLEAN model (red; the original gene model predicted by the GLEAN method); RNA-seq gene models (blue; the models produced by this study; the blank terminal regions are UTRs); Coverage (green; a graphical presentation of the number of sequencing reads that align at a particular location); Reads (gray; the alignment of individual reads to the genome sequence). (Orange arrows) Individual RNA sequence-derived exons. (A) The genomic structure of the gene blimp1. The overall structure of the GLEAN gene model is correct except longer UTRs are recovered and an alternatively spliced isoform that uses a distant 5′ exon is recovered. (B) The genomic structure of the gene hnf6. The GLEAN model predicted an incorrect exon1/intron1 boundary, and the 3′ exon is not supported by sequence. The correct 3′ exons and two isoforms were identified from the RNA sequence data.
Comparison between transcriptome-based gene models and predicted GLEAN gene models
Adequate comparison between the computationally predicted GLEAN gene models and transcriptome-based gene models requires manual curation, and we chose the subset of genes encoding transcription factors to evaluate the differences between these two types of model. This choice somewhat biases the comparison in that regulatory genes are in general simpler in structure than some other classes of protein-coding genes, for example, those encoding cell adhesion proteins, and the following results may well underestimate the actual amount of error in the computational GLEAN model predictions on a genome-wide scale. Results for all 406 regulatory genes analyzed here are summarized in Supplemental Table S1.
For the regulatory gene subset, 45% of the GLEAN models are essentially consistent with those derived from the transcriptome analysis. In about two-thirds of these, the GLEAN model and transcriptome-based models agree exactly, except that the 5′ and 3′ sequences could now be extended. This is to be expected, since computational gene models are generally based on predictions of coding regions, while the RNA sequence data include the whole of the mRNA (Supplemental Fig. S2A). In the remainder of the 45%, the RNA sequence-based models include one or more additional terminal exons, which could also be UTRs (Supplemental Fig. S2B,C). Figure 4A shows such a case for which there is also independent published evidence, the blimp1 gene model. The GLEAN model has five exons. A corresponding transcript model (WHL22.5073.1) shows the same structure with extended UTRs. Another transcript model also required by the transcriptome data (WHL22.5073.2) uses an alternative exon1, and this exon is made up of 5′-UTR sequence. This latter isoform was previously annotated as Blimp1a, while the GLEAN model corresponds to Blimp1b (Livi and Davidson 2006).
For 39% of the regulatory genes, the GLEAN models differ in fundamental ways from the RNA sequence-based results. Among these, in ∼80% of the cases, the gene models had to be revised dramatically (Supplemental Fig. S2D), while in the rest, a GLEAN model was simply a duplication of parts of another GLEAN model at the same locus (Supplemental Fig. S2E). Among discrepancies that could now be repaired were the addition of newly identified internal exons, correction of erroneous intron/exon boundaries, and false connections between models. To justify this evaluation, we compared these discrepant models with reliable third-party evidence, including known cDNA sequences from NCBI Refseq database and ESTs. cDNA/EST sequences were found for 32 genes, which support RNA-seq models in 29 genes, support the GLEAN model in one gene, and support neither in two genes (Supplemental Table S1). The invalidated RNA-seq models of the three genes were broken due to a missing single splice junction. It is clear that in most of these discrepant cases, RNA sequence-based models are better than GLEAN models. Figure 4B illustrates discrepancies for the hnf6 gene, where there is also additional earlier evidence. The GLEAN model shows two exons. But according to the RNA sequence-based model, the boundary of exon1/intron1 is wrong, and exon 2 is absent from the transcript, while two other exons should have been included. The three-exon transcriptome-based gene model (WHL22.288683.0) is identical in structure with a cDNA isolated previously (Otim et al. 2004). However, as pointed out (Otim et al. 2004), an α-isoform, in which the internal exon is spliced out, leaving two exons only exists in other species. Although the α-isoform had not previously been identified in sea urchins, it is present in the current transcriptomes and now could also be assembled (WHL22.288683.1). It differs from the GLEAN model in the corrected intron/exon boundaries.
For 11% of the GLEAN models in the regulatory gene subset, no corresponding RNA sequence-based model was identified, due to lack of transcription in any of the studied samples, i.e., too few reads (Supplemental Fig. S2F). In the remaining 5% of those considered, the comparison was moot, due to insufficient evidence to enable resolution (Supplemental Fig. S2G).
Functional classification
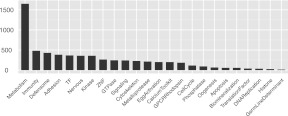
Although functional classification of transcripts is a critical aspect of downstream transcriptome analysis, the available standard classifications that are supposed to bridge across all genomes are error prone and often biologically arbitrary. We took advantage of the massive annotation effort made by the sea urchin community when the S. purpuratus genome was first released and, in particular, of a set of high-quality annotation papers published in 2006 in a special volume of Developmental Biology (Sea Urchin Genome: Implications and Insights, Volume 300, Number 1). These works cover many of the important functional transcript classes and have the advantage that they reflect the community's major research interests. These papers reported about 7000 annotated genes considered with respect to the functions of the encoded proteins. To develop a maximally useful sea urchin transcript classification, we manually collected, curated, and organized the published 2006 annotations into a new ontology suggested by the studies in these papers. The ontology has 24 major functional classes, as can be seen in Figure 5 (for example, transcription factors, immune-related genes, biomineralization genes, etc.), and up to three hierarchical levels (e.g., Signaling/TGFβ Signaling/TGFβ Signaling Receptors). The complete classification can be found in Supplemental Table S2, which includes 8954 annotations of 7000 GLEAN gene models. Using this custom-built sea urchin Gene Ontology, 5113 transcriptome gene models (24% of the total) were assigned into at least one function class; the number of diverse transcripts in each class is shown in Figure 5. Neither the ontology nor the annotations have until now been available in a computer-readable, easily accessible format, with the result that no large-scale analyses have been conducted on these gene sets. The current functional annotation, taken together with the improved and corrected gene models validated as above by reference to our transcriptome results, provides a high-quality data set for such analyses.
Figure 5.
Numbers of gene models associated with major functional classes. The distribution is based on the custom sea urchin ontology discussed in the text.
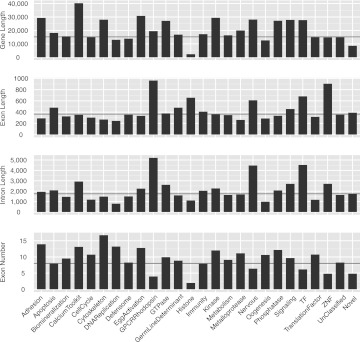
The elemental genomic parameters for sea urchin protein-coding genes of the different ontological classes, including gene length, exon length, intron length, and exon numbers, are shown in Figure 6. It is clear that the ontological classes of genes differ dramatically. For example, Calcium toolkit genes are the longest class due to the longest introns on average, and to an unusually large number of exons (Fig. 6). Additional unusually long classes of genes encode GTPases, kinases, and phosphatases, among others (Fig. 6). The classes of genes that have the largest number of exons are cell adhesion genes and cytoskeletal genes, although their individual intron, exon, and gene lengths are average or less than average (Fig. 6). Rhodopsin-type G-protein-coupled receptor genes have unusually few exons, but their introns and exons are unusually long (Fig. 6). Taken as a class, genes encoding transcription factors also tend to consist of fewer than average but longer exons and introns, a property also shared on average with genes expressed particularly in the nervous system (Fig. 6).
Figure 6.
Gene structure parameters for individual ontological classes. The four panels show average gene length, exon length, intron length, and exon number. (Black horizontal lines) The average value of the feature in the whole gene set. The “Unclassified” class refers to gene models that were not included in these ontological classes. The “Novel” class refers to gene models newly identified in this study as described in the text; these tend to be atypically small genes with few exons.
Although the manually curated functional transcript ontology on which Figure 6 is based is of high quality, it covers only 24% of all genes detected in the summed transcriptomes. As a complementary analysis, transcriptome models were also annotated using the generic Gene Ontology by Blast2GO (Götz et al. 2008). By this means, 15,475 genes (73%) could be assigned GO terms.
Leader trans-splicing
Spliced leader (SL) trans-splicing has been reported in several eukaryotes including euglenozoa, nematodes, flatworms, and tunicates. In this form of RNA processing, a small RNA sequence (SL RNA) is transferred to the 5′ end of many pre-mRNA molecules (Hastings 2005). To investigate the presence of SL trans-splicing in the sea urchin mRNAs, reads from two embryonic stages (18 hpf and 40 hpf) were separately assembled de novo using Trinity (Grabherr et al. 2011). The assembled sequences were first clustered to remove redundancy by CD-HIT, a program that clusters sequences by their similarity (Huang et al. 2010), and then the first 200 bp at the 5′ end of each sequence was used to search the genome. A potential spliced leader sequence would display matches with the ends of multiple transcripts and would show up as a “hotspot.” But we found no significant evidence for trans-splicing by this method and conclude that at least in sea urchin embryonic stages, there is very little, if any, SL trans-splicing.
Discussion
Transcriptomes enrich understanding in multiple ways. They illuminate developmental regulatory processes, they indicate structure/function properties of genes and classes of genes, they provide biological bases for custom-built gene expression ontologies, and they generate crucial empirical support for gene models. Here we focus on the interplay between the results of a comprehensive transcriptome analysis and the genomics of the sea urchin; the many developmental implications of this study are to be discussed elsewhere.
Limitations
Transcriptomes are the outputs of the gene regulatory processes that control system function in animals, and it is virtually impossible to sample RNAs representing every regulatory state that the genome is capable of generating. Thus, the repertoire of sequenced mRNAs, even when summed over many biological samples, as in this study, can never include transcripts of all protein-coding genes in the genome. Nonetheless, we were able to recover transcripts mapping to >90% of predicted protein-coding genes, of which 85% are expressed at clearly significant levels. This is better coverage than might have been expected, although it is unevenly distributed among ontology classes. Some genes, such as those encoding transcription factors, are used over and over again in the life cycle, and indeed an earlier study showed that >80% of predicted regulatory genes in S. purpuratus are expressed within 3 d of fertilization (Howard-Ashby et al. 2006). Housekeeping metabolic genes and many cytoskeletal genes are likely to be included in multiple of the transcriptome samples, as are all genes required for the differentiated cell types of the embryo and larva, etc. The current transcriptome analysis is consistent with prior studies. Models of genes known to be expressed have been recovered.
On the other hand, this should not be true of genes expressed facultatively, for example, in response to immune challenge, and indeed it is not. For example, more than 200 Toll-like receptors (TLRs) were identified in the sea urchin genome by the GLEAN prediction process (Rast et al. 2006). Even after an extensive effort, including use of de novo assembly on the specific transcriptome samples from coelomocytes, the immune cells that express TLRs (Hibino et al. 2006), followed by manual evaluation, we could identify only 28 different TLR transcripts. This most likely reflects differential expression of these receptors (Messier-Solek et al. 2010), most of which were not sampled in the healthy animals used to provide the (resting) coelomocyte preparation, although if some of the transcribed TLRs are particularly closely related in sequence, they could have been missed. Indeed, a second general limitation of transcriptome analysis is in distinguishing closely related transcripts deriving from large gene families, particularly in famously polymorphic genomes such as that of S. purpuratus (Sea Urchin Genome Sequencing Consortium 2006). Another limitation, which for some purposes could be crucial, is that the use of 300-bp RNA fragments in the preparation of the sequencing libraries (according to standard protocols) severely diminishes the information available on alternative splicing isoforms within each preparation. Finally, as a choice based on the principle that we wished to generate a transcriptional image exclusively of clearly functional protein-coding gene expression, we deliberately filtered out transcripts expressed at very low, probably meaningless levels, as well as all small transcripts, noncoding or otherwise (<400 bp).
The accuracy of RNA sequencing-based gene models is also limited by the computational analysis tools. In the comparison of GLEAN models and RNA-seq models, we used known cDNA sequences and ESTs to evaluate the discrepancies between the model sets. We found that occasionally splice junctions were not detected causing ∼10% of the RNA-seq models to be broken. This is probably due to some errors in mapping of reads that span a splice, since adjacent exons generally have enough coverage. We also noticed that in a few loci there were sufficient reads but no models were assembled, or erroneous fusion of adjacent models. This is likely due to the misbehavior of the gene model assembly program. Despite these limitations, RNA-seq analysis methods generally yield accurate results. Furthermore, the computational tools are evolving rapidly, and future versions may correct these problems.
Improved status of the S. purpuratus genome
In only the few most studied model system genomes, e.g., Caenorhabditis elegans, mouse, and Drosophila, have the initial sets of computationally generated gene model predictions been generally annotated and revised based on direct experimental evidence. As we show here, transcriptome mapping results in a significant improvement in the accuracy of the gene models in the S. purpuratus genome: Accessed by a manually curated subset, only about a third of the computational 2006 GLEAN predictions proved to represent the actual structures of the transcribed genes, and even these have now been augmented by addition of the 3′- and 5′-UTR sequences, which, in fact, include 60% of the length of the average sea urchin mRNA. For many experimental purposes, the UTRs are essential and required information. More importantly, missing exons have been replaced in the empirical gene models; falsely predicted exons removed; intermingled genes separated; intron/exon boundaries corrected; and overlapping models excised. Multiple comparisons to both published and unpublished full-length cDNA sequences, and to RACE-derived fragments, indicate that the transcriptome-based gene models are very accurate. Because of the high coverage of the pooled transcriptome data, a majority of the gene models in the S. purpuratus genome have now been systematically rederived from experimental data, and this includes most of the genes that are the main subjects of interest to the scientific consumers of genomic sequence information in experimental fields of sea urchin molecular and cellular biology. For gene network regulatory molecular biology, the primary focus of this laboratory, correct gene models are absolutely essential, and incorrect ones continuously generate severe impediments, even if they do usually succeed in indicating the presence of the gene in a given region of the genome. The correct models are needed for the design of every kind of probe and construct required for experimental assessment of regulatory interactions, including in situ hybridization probes, QPCR probes, Nanostring probes, reengineered BACs, expression constructs, and of course for locating relevant cis-regulatory modules as well. A fundamental strength of modern genomics is its computationally mediated and automatically accessible genome-wide informational content. Thus in this study we have also implemented new visualization and locational programs that link into SpBase the fruits of this analysis of the sea urchin transcriptome.
Methods
Animal culture and sample collection
Embryos were obtained by combining gametes from a single male and a single female animal, and cultured in filtered seawater at a density of 500/mL at 14°C with stirring to ensure proper development. The embryo samples were taken without further dilution. For larval stages, at 72 hpf the embryos were diluted from 10 to 1 embryo/mL and fed with the alga, Rhodomoas spp. (Wray et al. 2004). Timed larval samples were taken and the culture was kept until juveniles were harvested after ∼4 mo in culture. All embryonic and larval stages were collected from the same batch, except the pilot experiment of 24 hpf. Larval staging follows a recent morphological study (Smith et al. 2008). Adult tissues were collected by dissection from multiple animals.
After collection, samples were immediately lysed in TRIzol (Invitrogen) by vigorous shaking on a Vortex shaker (embryonic stages) or homogenization (larval stages and adult tissues), then frozen at −70°C until use.
RNA preparation and library building
The RNA preparation was as described previously (Mortazavi et al. 2008; Trapnell et al. 2010) with modifications (Dr. Brian Williams, California Institute of Technology, pers. comm.). Total RNA was prepared using TRIzol (Invitrogen), followed by DNase I treatment (Turbo DNAFree Kit; Ambion). mRNA was purified by a double selection with oligo(dT) beads (Dynabeads; Invitrogen). RNA quality was checked by BioAnalyzer (Agilent), and quantity was measured by Qubit (Invitrogen). For each sample, 100 ng of mRNA was taken, and internal standard RNA aliquots were added. The RNA was fragmented in the fragmentation buffer (3′ IVT Express Kit; Affymetrix) for 2.5 min at 94°C. The double-strand cDNA was synthesized by the SuperScript kit (Invitrogen).
The sequencing library construction followed the protocol suggested by the manufacturer. The sequencing was done by Illumina Genome Analyzer IIx. Both library building and sequencing were performed in the Millard and Muriel Jacobs Genetics and Genomics Laboratory, California Institute of Technology.
Computational analysis
The analysis was performed based on S. purpuratus genome v3.0, which was downloaded from SpBase (http://www.spbase.org) (Cameron et al. 2009). The genome v3.0 differs with the current v3.1 in only a few places due to the removal of contaminating microbial sequences. But the assembled transcript sequences remain the same. The reads were mapped by Bowtie 0.12.7 (Langmead et al. 2009) and TopHat 1.2.0 (Trapnell et al. 2009). Gene models were assembled based on the mapped reads, and abundance was estimated by Cufflinks 0.8.1 (Trapnell et al. 2010). Reads from coelomocytes were de novo assembled by Trinity (Grabherr et al. 2011). These computations were done on the Amazon Elastic Compute Cloud platform (http://aws.amazon.com/ec2/).
Gene models were visualized by Integrative Genomics Viewer (IGV) (Robinson et al. 2011). GO annotation was done by Blast2GO (Götz et al. 2008). In the analysis of spliced leader trans-splicing and TLR genes, sequence redundancy was removed by CD-HIT (Huang et al. 2010).
Data access
All data and the corresponding query and visualization tools are available via SpBase, the public sea urchin genome database (http://www.spbase.org/SpBase/rnaseq/). The assembled transcriptome sequences have been submitted to the NCBI Transcriptome Shotgun Assembly Sequence Database (http://www.ncbi.nlm.nih.gov/genbank/TSA.html) under accession numbers JT094275–JT123346, which can also be retrieved as a whole through the NCBI BioProject Database (http://www.ncbi.nlm.nih.gov/bioproject), accession number PRJNA81157. The read sequences have been submitted to the NCBI Sequence Read Archive (SRA) (http://www.ncbi.nlm.nih.gov/sra) under accession number SRA056880.
Acknowledgments
We are very grateful to Brian Williams (Caltech) for the RNA-seq protocol and technical advice. We thank Igor Antoshechkin and Lorian Schaeffer (Millard and Muriel Jacobs Genetics and Genomics Laboratory, Caltech) for library building and sequencing. We thank Ung-Jin Kim, Qiu Yuan, and Parul Kudtarkar (SpBase) for technical assistance. This work was supported by NIH (P40OD010959, P40RR015044).
Footnotes
[Supplemental material is available for this article.]
Article published online before print. Article, supplemental material, and publication date are at http://www.genome.org/cgi/doi/10.1101/gr.139170.112.
References
- Blencowe BJ, Ahmad S, Lee LJ 2009. Current-generation high-throughput sequencing: Deepening insights into mammalian transcriptomes. Genes Dev 23: 1379–1386 [DOI] [PubMed] [Google Scholar]
- Bolouri H, Davidson EH 2003. Transcriptional regulatory cascades in development: Initial rates, not steady state, determine network kinetics. Proc Natl Acad Sci 100: 9371–9376 [DOI] [PMC free article] [PubMed] [Google Scholar]
- Bradnam KR, Korf I 2008. Longer first introns are a general property of eukaryotic gene structure. PLoS ONE 3: e3093 doi: 10.1371/journal.pone.0003093 [DOI] [PMC free article] [PubMed] [Google Scholar]
- Cameron RA, Samanta M, Yuan A, He D, Davidson EH 2009. SpBase: The sea urchin genome database and web site. Nucleic Acids Res 37: D750–D754 [DOI] [PMC free article] [PubMed] [Google Scholar]
- Davidson EH 1986. Gene activity in early development, 3rd ed. Academic Press, Orlando, FL. [Google Scholar]
- Götz S, García-Gómez JM, Terol J, Williams TD, Nagaraj SH, Nueda MJ, Robles M, Talón M, Dopazo J, Conesa A 2008. High-throughput functional annotation and data mining with the Blast2GO suite. Nucleic Acids Res 36: 3420–3435 [DOI] [PMC free article] [PubMed] [Google Scholar]
- Grabherr MG, Haas BJ, Yassour M, Levin JZ, Thompson DA, Amit I, Adiconis X, Fan L, Raychowdhury R, Zeng Q, et al. 2011. Full-length transcriptome assembly from RNA-Seq data without a reference genome. Nat Biotechnol 29: 644–652 [DOI] [PMC free article] [PubMed] [Google Scholar]
- Hastings KEM 2005. SL trans-splicing: Easy come or easy go? Trends Genet 21: 240–247 [DOI] [PubMed] [Google Scholar]
- Hibino T, Loza-Coll M, Messier C, Majeske AJ, Cohen AH, Terwilliger DP, Buckley KM, Brockton V, Nair SV, Berney K, et al. 2006. The immune gene repertoire encoded in the purple sea urchin genome. Dev Biol 300: 349–365 [DOI] [PubMed] [Google Scholar]
- Howard-Ashby ML, Materna SC, Brown CT, Tu Q, Oliveri P, Cameron RA, Davidson EH 2006. High regulatory gene use in sea urchin embryogenesis: Implications for bilaterian development and evolution. Dev Biol 300: 27–34 [DOI] [PMC free article] [PubMed] [Google Scholar]
- Huang Y, Niu B, Gao Y, Fu L, Li W 2010. CD-HIT Suite: A web server for clustering and comparing biological sequences. Bioinformatics 26: 680–682 [DOI] [PMC free article] [PubMed] [Google Scholar]
- Koralewski TE, Krutovsky KV 2011. Evolution of exon–intron structure and alternative splicing. PLoS ONE 6: e18055 doi: 10.1371/journal.pone.0018055 [DOI] [PMC free article] [PubMed] [Google Scholar]
- Langmead B, Trapnell C, Pop M, Salzberg SL 2009. Ultrafast and memory-efficient alignment of short DNA sequences to the human genome. Genome Biol 10: R25 doi: 10.1186/gb-2009-10-3-r25 [DOI] [PMC free article] [PubMed] [Google Scholar]
- Livi CB, Davidson EH 2006. Expression and function of blimp1/krox, an alternatively transcribed regulatory gene of the sea urchin endomesoderm network. Dev Biol 293: 513–525 [DOI] [PubMed] [Google Scholar]
- Maroni G 1996. The organization of eukaryotic genes. Evol Biol 29: 1–19 [Google Scholar]
- Materna SC, Nam J, Davidson EH 2010. High accuracy, high-resolution prevalence measurement for the majority of locally expressed regulatory genes in early sea urchin development. Gene Expr Patterns 10: 177–184 [DOI] [PMC free article] [PubMed] [Google Scholar]
- Messier-Solek C, Buckley KM, Rast JP 2010. Highly diversified innate receptor systems and new forms of animal immunity. Semin Immunol 22: 39–47 [DOI] [PubMed] [Google Scholar]
- Mortazavi A, Williams BA, McCue K, Schaeffer L, Wold B 2008. Mapping and quantifying mammalian transcriptomes by RNA-Seq. Nat Methods 5: 621–628 [DOI] [PubMed] [Google Scholar]
- Oliveri P, Tu Q, Davidson EH 2008. Global regulatory logic for specification of an embryonic cell lineage. Proc Natl Acad Sci 105: 5955–5962 [DOI] [PMC free article] [PubMed] [Google Scholar]
- Otim O, Amore G, Minokawa T, McClay DR, Davidson EH 2004. SpHnf6, a transcription factor that executes multiple functions in sea urchin embryogenesis. Dev Biol 273: 226–243 [DOI] [PubMed] [Google Scholar]
- Peter IS, Davidson EH 2009. Modularity and design principles in the sea urchin embryo gene regulatory network. FEBS Lett 583: 3948–3958 [DOI] [PMC free article] [PubMed] [Google Scholar]
- Peter IS, Davidson EH 2011. A gene regulatory network controlling the embryonic specification of endoderm. Nature 474: 635–639 [DOI] [PMC free article] [PubMed] [Google Scholar]
- Putnam NH, Butts T, Ferrier DEK, Furlong RF, Hellsten U, Kawashima T, Robinson-Rechavi M, Shoguchi E, Terry A, Yu JK, et al. 2008. The amphioxus genome and the evolution of the chordate karyotype. Nature 453: 1064–1071 [DOI] [PubMed] [Google Scholar]
- Rast JP, Smith LC, Loza-Coll M, Hibino T, Litman GW 2006. Genomic insights into the immune system of the sea urchin. Science 314: 952–956 [DOI] [PMC free article] [PubMed] [Google Scholar]
- Robinson JT, Thorvaldsdóttir H, Winckler W, Guttman M, Lander ES, Getz G, Mesirov JP 2011. Integrative genomics viewer. Nat Biotechnol 29: 24–26 [DOI] [PMC free article] [PubMed] [Google Scholar]
- Sea Urchin Genome Sequencing Consortium 2006. The genome of the sea urchin Strongylocentrotus purpuratus. Science 314: 941–952 [DOI] [PMC free article] [PubMed] [Google Scholar]
- Smith MM, Cruz Smith L, Cameron RA, Urry LA 2008. The larval stages of the sea urchin, Strongylocentrotus purpuratus. J Morphol 269: 713–733 [DOI] [PubMed] [Google Scholar]
- Sodergren E, Shen Y, Song X, Zhang L, Gibbs RA, Weinstock GM 2006. Shedding genomic light on Aristotle's lantern. Dev Biol 300: 2–8 [DOI] [PubMed] [Google Scholar]
- Tarazona S, García-Alcalde F, Dopazo J, Ferrer A, Conesa A 2011. Differential expression in RNA-seq: A matter of depth. Genome Res 21: 2213–2223 [DOI] [PMC free article] [PubMed] [Google Scholar]
- Toung JM, Morley M, Li M, Cheung VG 2011. RNA-sequence analysis of human B-cells. Genome Res 21: 991–998 [DOI] [PMC free article] [PubMed] [Google Scholar]
- Trapnell C, Pachter L, Salzberg SL 2009. TopHat: Discovering splice junctions with RNA-Seq. Bioinformatics 25: 1105–1111 [DOI] [PMC free article] [PubMed] [Google Scholar]
- Trapnell C, Williams BA, Pertea G, Mortazavi A, Kwan G, van Baren MJ, Salzberg SL, Wold BJ, Pachter L 2010. Transcript assembly and quantification by RNA-Seq reveals unannotated transcripts and isoform switching during cell differentiation. Nat Biotechnol 28: 511–515 [DOI] [PMC free article] [PubMed] [Google Scholar]
- Wang Z, Gerstein MB, Snyder M 2009. RNA-Seq: A revolutionary tool for transcriptomics. Nat Rev Genet 10: 57–63 [DOI] [PMC free article] [PubMed] [Google Scholar]
- Wray GA, Kitazawa C, Miner B 2004. Culture of echinoderm larvae through metamorphosis. In Development of sea urchins, ascidians, and other invertebrate deuterostomes: Experimental approaches (ed. CA Ettensohn et al.), Method in Cell Biology, Vol. 74. Academic Press, Amsterdam [DOI] [PubMed] [Google Scholar]
- Zhu L, Zhang Y, Zhang W, Yang S, Chen J-Q, Tian D 2009. Patterns of exon–intron architecture variation of genes in eukaryotic genomes. BMC Genomics 10: 47 doi: 10.1186/1471-2164-10-47 [DOI] [PMC free article] [PubMed] [Google Scholar]


