

Abstract
Niemann-Pick disease (types A and B), or acid sphingomyelinase deficiency, is an inherited deficiency of acid sphingomyelinase, resulting in intralysosomal accumulation of sphingomyelin in cells throughout the body, particularly within those of the reticuloendothelial system. These cellular changes result in hepatosplenomegaly and pulmonary infiltrates in humans. A knockout mouse model mimics many elements of human ASMD and is useful for studying disease histopathology. However, traditional formalin-fixation and paraffin embedding of ASMD tissues dissolves sphingomyelin, resulting in tissues with a foamy cell appearance, making quantitative analysis of the substrate difficult. To optimize substrate fixation and staining, a modified osmium tetroxide and potassium dichromate postfixation method was developed to preserve sphingomyelin in epon-araldite embedded tissue and pulmonary cytology specimens. After processing, semi-thin sections were incubated with tannic acid solution followed by staining with toluidine blue/borax. This modified method provides excellent preservation and staining contrast of sphingomyelin with other cell structures. The resulting high-resolution light microscopy sections permit digital quantification of sphingomyelin in light microscopic fields. A lysenin affinity stain for sphingomyelin was also developed for use on these semi-thin epon sections. Finally, ultrathin serial sections can be cut from these same tissue blocks and stained for ultrastructural examination by electron microscopy.
Keywords: Niemann-Pick disease, acid sphingomyelinase deficiency, epon-araldite, tannic acid
Acid sphingomyelinase deficiency (ASMD) is a lysosomal storage disease resulting from an inherited deficiency of the enzyme acid sphingomyelinase. This enzyme deficiency causes the accumulation of sphingomyelin (SM) in cells of the reticuloendothelial system (monocyte-macrophage lineage), which are often referred to as Niemann-Pick (NP) cells. These cells become particularly prominent in the spleen, liver, and lung, resulting in hepatosplenomegaly and pulmonary disease. There is a broad spectrum of disease severity, and in mildly affected patients, the splenomegaly may not be noted until adulthood (Chan et al. 1977; Dawson and Dawson 1982) and there may be minimal disease manifestations. Clinically significant pancytopenia due to secondary hypersplenism may require partial or complete splenectomy. Severely affected patients have liver involvement leading to life-threatening cirrhosis, portal hypertension, and ascites (Tassoni et al. 1991). Patients can also develop significant respiratory problems, including dyspnea and infection due to alveolar infiltration by NP cells (Volk et al. 1972; Kovesi et al. 1996; McGovern et al. 2008). At diagnosis, evidence of mild pulmonary involvement is usually detected as a diffuse reticular or finely nodular infiltration on chest X-ray. A knockout mouse model (ASMKO) of ASMD possesses a similar histopathological phenotype to that of patients, with foamy cell infiltration of multiple organs, including liver, spleen, and lung (Horinouchi et al. 1995). This model allows investigators to study the pathogenesis of the disease and to evaluate the efficacy of enzyme replacement therapy (ERT).
The use of image analysis for severity assessment of any lysosomal storage disease requires consistent preservation of the substrate in target tissues (Lynch et al. 2005). Traditionally, pathologists have identified NP cells as foamy, vacuolated cells in paraffin sections stained with hematoxylin and eosin (H&E). The solvents used to dehydrate and clear tissue during paraffin processing remove the lipid component of the SM, leaving holes in the cells and making accurate quantification of SM difficult. Pauline Hall (Hall et al. 1980) described a method used to preserve fat by adding a potassium dichromate to osmium tetroxide postfixation step, followed by embedding into resins. In the present study, we describe modifications to Hall’s procedure, which improves sphingolipid preservation and retention in both whole tissue and pulmonary cytology specimens. This new processing method results in epon-araldite (resin) embedded tissues, which can be cut into semi-thin sections followed by staining with tannic acid/toluidine blue for optimal light microscopy viewing and quantitative analysis by MetaMorph. Lysenin affinity staining for SM can also be performed on these semi-thin sections for additional confirmation of substrate. Furthermore, the same resin tissue blocks can be cut into ultrathin sections and processed for transmission electron microscopy (TEM) when further ultrastructural analysis is needed. The result is a versatile, reliable histopathological biomarker for preclinical and clinical applications.
Materials and Methods
Tissue Harvesting
Animal experiments were conducted in the Department of Comparative Medicine (Genzyme, a Sanofi Company; Framingham, MA) according to Institutional Animal Care and Use Committee standards. The ASMKO mice were developed at Mt. Sinai School of Medicine (Horinouchi et al. 1995). Control C57Bl/6 mice were obtained from Taconic labs (Taconic Farms, Inc.; Germantown, NY). Both male and female age-matched (12 weeks) mice were sacrificed for use in the development and validation of these processing methods. The mice were euthanized by CO2 asphyxiation, and multiple tissues were collected from ASMKO and control mice.
A liver needle biopsy and 3-mm punch biopsy of skin from ASMD patients were obtained as part of a phase 1 clinical trial of enzyme replacement therapy. The institutional review boards at all sites approved the phase 1 protocol, and all patients gave written informed consent.
Cytology Harvesting from Bronchoalveolar Lavage
ASMKO (20- to 28-week-old) mice were euthanized as described above. Using a 25-gauge cannula, the lungs were lavaged three times with 1 ml PBS. All three of the lavages from one animal were then pooled into 15-ml conical tubes. Samples were transported back to the lab on wet ice. These 3-ml samples were centrifuged in an Allegra X-15 bench-top centrifuge (Beckman Coulter, Inc.; Indianapolis, IN) at 1000 rpm for 15 min at 4C. The supernatant was removed and 2 ml of 2% paraformaldehyde and 2% glutaraldehyde in 0.2 M cacodylate buffer (Electron Microscopy Sciences; Hatfield, PA) was added on top of the cell pellet. All samples were stored in fixative at 4C until processing for electron microscopy.
For clinical lavage samples that cannot be immediately processed into 2% paraformaldehyde and 2% glutaraldehyde fixative, an equal volume (equal to that of the lavage volume) of Shandon Mucolexx (Thermo Electron Corporation; Pittsburgh, PA) can be added, and the samples may be stored at 4C for up to 48 hr prior to centrifugation and fixation as described below.
Paraffin Processing for Light Microscopy
Liver from a human needle biopsy was immersion fixed in 10% neutral buffered formalin (NBF) for 48 hr, dehydrated in ascending grades of reagent alcohol, cleared in xylenes, infiltrated, and embedded into Paraplast X-TRA paraffin (McCormick Scientific, LLC; St. Louis, MO) on a Tissue-Tek VIP tissue processor (Sakura Finetek Japan Co.; Tokyo, Japan). Five-micrometer sections were cut on a Leica microtome (Leica Microsystem, Inc.; Buffalo Grove, IL) and placed onto Superfrost Plus Slides (VWR Scientific; Bridgeport, NJ) and stained with a routine H&E method as described below.
H&E Staining of Paraffin Sections
Hematoxylin and eosin staining was performed using an automated stainer. Following a standard deparaffinization, slides were stained in Hematoxylin 1 (Richard-Allan Scientific; Kalamazoo, MI) for 7 min followed by a running water wash. After 1 min each in Clarifier 2 (Richard-Allan Scientific) and Bluing solution (Richard-Allan Scientific), the slides were stained in Eosin Y with Phloxine (Richard-Allan Scientific) for 1 min, dehydrated, cleared and mounted with TBS SHUR/Mount Xylene-Based Mounting Medium (Triangle Biomedical Systems, Inc.; Durham, NC), and then coverslipped.
Epon-Araldite Processing Method
The reagents, methodology, and resin formulations used are outlined in Tables 1 to 3. All of the following steps were done manually in a fume hood to maintain proper fixation, processing, and embedding. After fixations, the tissue samples were placed in screened baskets and then into EM vials provided from a Leica EM TP processor to aid in ease of solution changes. Tissue samples, 1-mm cubes, were fixed for a minimum of 24 hr in 2% glutaraldehyde, 2% paraformaldehyde in 0.2 mol/L sodium cacodylate buffer, pH 7.3. The tissues were then washed in 0.2 mol/L sodium cacodylate buffer overnight and then placed in a working solution of 2.5% potassium dichromate and 0.5% osmium tetroxide in reverse-osmosis/de-ionized (RO/DI) water for 6 hr at ambient temperature, followed by washing in running water for 1 hr. The tissues were then stored overnight in 30% ethanol at 4C, followed by dehydration in acetones (70%, 100% acetones for 30 min each). After dehydration, the tissues were infiltrated with 70% resin (15 ml DDSA, 5 ml LX-112, 5 ml Araldite 502, and 0.5 ml DMP-30 [Ladd Research Industries; Williston, VT]) in acetone for 1 hr. The tissues were then infiltrated with two changes of 100% resin, one at 3 hr and one overnight. Embedding was done in a “00” Beem capsule in 100% resin and polymerized at 60C for a minimum of 48 hr. The resin formulation used is given in Table 3. One-micrometer sections were cut using a Leica EM UC6 microtome (Leica Microsystems) with an ultra diamond knife (Diatome; Hatfield, PA). The sections were collected on Superfrost Plus Slides (VWR Scientific) and dried overnight on a 40C slide warmer.
Table 1.
Choosing Reagents for Epon-Araldite Processing
| Steps | Reagents in Processing through | Results (Advantages) |
|---|---|---|
| Fixation | 2% glutaraldehyde, 2% paraformaldehyde | Preserves proteins well |
| Penetrates rapidly | ||
| Postfixation | 2.5% potassium dichromate, 0.5% osmium tetroxide | Easily fixed phospholipids |
| Dichromate interferes with the osmification of phospholipids in cell membranes | ||
| Dehydration | Acetone | Does extract phospholipids, but far less than that by ethanol |
| Infiltration | Acetone:resin | Less lipids solvent |
| Polymerization | Epon-araldite mixture | Less brittle and harder than epon alone |
| Prestaining | 0.5% tannic acid in Ringer’s solution | Enhances the preservation/staining of the sphingomyelin (SM), acts as mordant between osmium-treated structures and lead stains |
| Staining | 1% toluidine blue/borax, pH 8.4 | It is metachromatic stain and accentuates cytoplasmic differentiation: SM area—purple, nuclei; dark blue, cytoplasm; and other tissue elements, light blue |
Table 3.
Resin Formulation
| Araldite 502 | BisPhenol A epoxy resin/dibutyl phthalate | Ladd Research Industries, Inc. | 5 ml |
| LX 112 | Glycerol polyglycidyl | Ladd Research Industries, Inc. | 5 ml |
| DDSA | Dodecenyl succinic anhydride | Ladd Research Industries, Inc. | 15 ml |
| DMP-30 | 2,4,6-Tri-dimethylaminomethyl phenol (accelerator) | Ladd Research Industries, Inc. | 0.5 ml |
Table 2.
Epon-Araldite Processing Method
| Step | Reagents | Time | Temperature |
|---|---|---|---|
| 1 | 0.2 mol/L sodium cacodylate buffer | Overnight | Ambient |
| 2 | 2.5% potassium dichromate:0.5% osmium tetroxide | 6 hr | Ambient (cover with foil) |
| 3 | Running water | 1 hr | |
| 4 | 30% ethanol | Overnight | 4C |
| 5 | 70% acetone | 30 min | 4C |
| 6 | 100% acetone | 30 min | 4C |
| 7 | 70% resin in acetone | 1 hr | |
| 8 | 100% resin | 3 hr | |
| 9 | 100% resin | Overnight | |
| 10 | 100% resin (embedding) | 48 hr | 60C |
For isolated pulmonary macrophages from bronchoalveolar lavage samples, processing was done manually in the original collection tube due to the delicate nature of the specimens. Prior to processing, the fixed cells were recentrifuged in the original tubes to capture the cells in pellet form. The fixative supernatant was removed, and fresh 2% glutaraldehyde, 2% paraformaldehyde fixative was added until processing. A working solution of 2.5% potassium dichromate and 0.5% osmium tetroxide made in RO/DI water was added on top of the cell pellet, which was gently dislodged from the bottom of the tube and allowed to sit for 6 hr at ambient temperature, followed by a gentle centrifugation and removal of supernatant. The pellet was then subject to washing with 1 ml distilled water and allowed to sit for 15 min at ambient temperature followed by a gentle centrifugation (to preserve the cell pellet and its fragments). This step was repeated three to four times over an hour. The pellets were then stored overnight in 30% ethanol at 4C. On day 2, the pellet samples were transferred to safe-lock Eppendorf 0.5-ml tubes. The samples were then dehydrated in acetones (70%, 100% acetones for 30 min each). After dehydration steps, the pellets were infiltrated in 70% resin (15 ml DDSA, 5 ml LX-112, 5 ml Araldite 502, and 0.5 ml DMP-30 [Ladd Research Industries]) in acetone for 1 hr followed by two changes of 100% resin: one for 3 hr and one overnight. All steps were performed by collecting the cells in a microfuge for 1 min and removing the supernatant before adding the next reagent. The samples were embedded the following day in fresh resin using the same tube in which all of the resin changes had occurred. The cells were centrifuged for a longer time (5 min in a microfuge) due to the viscosity of the resin to ensure an ideal pellet and polymerized at 60C for 48 hr. Polymerized blocks were cut at 1-micrometer on a Leica EM UC6 microtome with an ultra diamond knife (Diatome). The sections were collected on Superfrost Plus Slides and dried overnight on a 40C slide warmer. Cytology sections were stained using the same protocol described for tissues sections below.
Staining of Epon-Araldite Sections for High-Resolution Light Microscopy
Slides were hydrated in water for 1 min. The slides were then treated with a filtered 0.5% of tannic acid in Ringer’s solution buffer, pH 6.8 (Electron Microscopy Sciences), for 15 min, followed by rinsing in running water for 5 min. Slides were then stained for 2 min with a 1% solution of toluidine blue/borax, pH 8.4 (heated to 60C). After staining, sections were washed in running water for 5 min and then dried completely in a 60C oven and coverslipped with TBS SHUR/Mount Xylene-Based Mounting Medium. The areas containing SM stained purple, nuclei stained dark blue, and cytoplasm and other elements stained light blue. The distinct color contrast thus rendered these slides suitable for MetaMorph image analysis.
Lysenin Affinity Staining of Epon-Araldite Sections
Resin sections were hydrated in TBS (Dako; Carpinteria, CA) with 0.1% Tween-20 (TBS-T; DAKO) for 5 min. A 5-µg/mL solution of lysenin protein (Peptides International, Inc.; Louisville, KY) diluted in TBS with 0.5% BSA (TBS-B; DAKO) was placed on the slides and incubated at 37C for 1 hr. After rinsing in TBS-T for 5 min, a 1:2500 dilution of anti-lysenin antiserum (Peptides International, Inc.) diluted in Antibody Diluent with Background Reducing Components (Dako) was added to the slides for 30 min at ambient temperature. Following another TBS-T rinse, MACH-2 Rabbit ALP polymer (Biocare Medical; Concord, CA) was applied for 30 min at ambient temperature. After rinsing in TBS-T, slides were developed in Vulcan Fast Red chromogen (Biocare Medical) and then rinsed in running water for at least 5 min and counterstained in a 1:10 dilution of Richardson’s stain (heated to 60C) for 15 sec. Slides were rinsed in running RO/DI water, air dried, mounted with TBS SHUR/Mount Xylene-Based Mounting Medium, and coverslipped.
Morphological Analyses
MetaMorph analysis was performed as described elsewhere (Lynch et al. 2005). Briefly, one representative field from each slide was photographed with a Nikon DXM1200 digital camera and acquired with the Nikon Act 1 photo image capture software for the DXM1200 digital camera, version 1.12 (Nikon, Inc., Instrument Group; Melville, NY). Each digital image was photographed at a fixed magnification (using the 40× or 60× objective) and formatted at fixed pixel density (8 × 10 inches at 150 dpi) using Adobe Photoshop software (version 5.5; Adobe, San Jose, CA). Each digital image was then opened using the MetaMorph Imaging Processing and Analysis software (version 6.3; Universal Imaging Corporation, Buckinghamshire, UK) for histomorphometric analysis.
MetaMorph was used to quantify the SM in each digital image; SM load was expressed as a percentage of total tissue area (Figure 2). The area of total tissue (designated as image B and represented by purple and blue staining together) and the area occupied by SM only (designated as image C and represented by purple staining only) were calculated in terms of pixels. The co-localization function of MetaMorph then calculated the percentage of pixels in common between image in B and image in C and automatically exported the calculation into an Excel spreadsheet (Microsoft Corp.; Redmond, WA).
Figure 2.
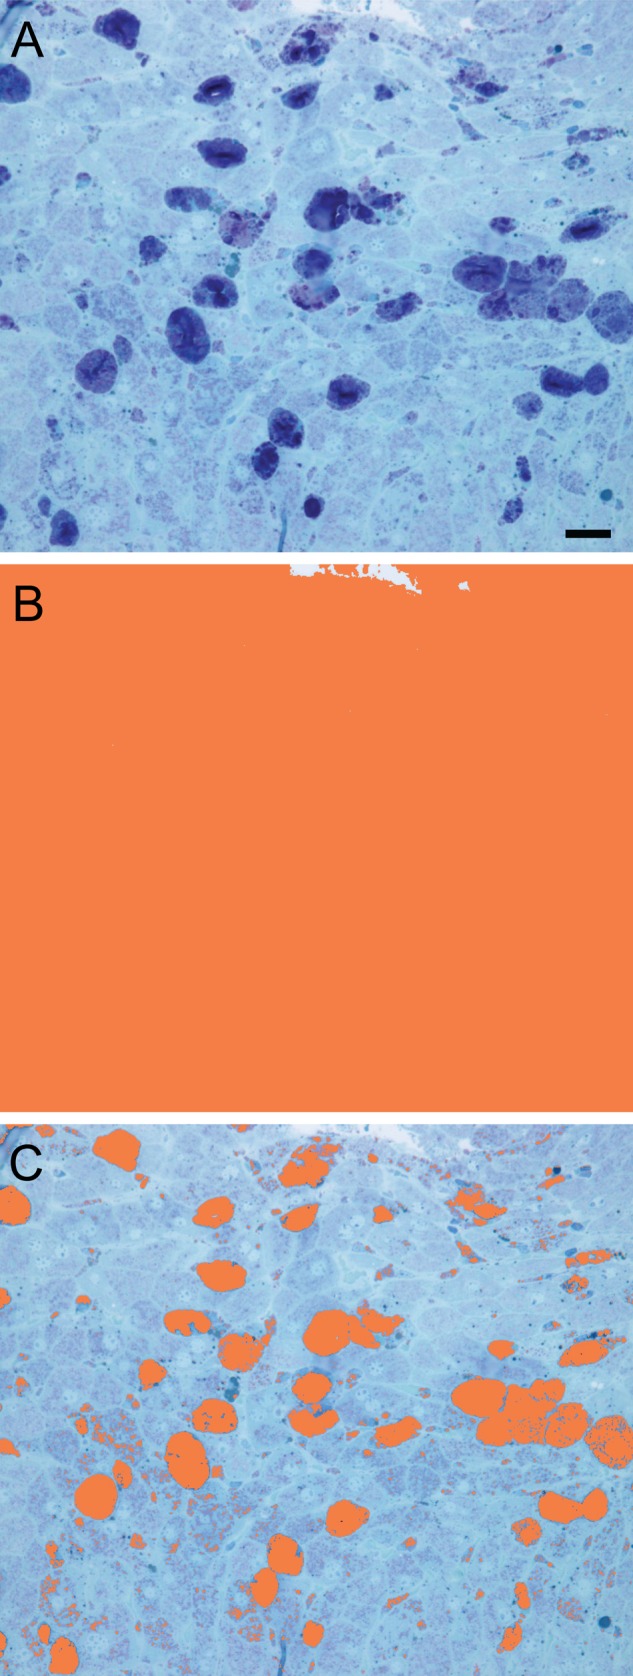
(A) MetaMorph analysis of an epon-araldite mouse liver section. Toluidine blue staining on tannic acid–treated epon liver sections provides high-resolution light microscopy (HRLM) images suitable for digital analysis. A digital image of the mouse liver section was opened using the MetaMorph Imaging Processing and Analysis software. The area of total tissue represented by purple and blue staining together (B) and the area occupied by SM only (C) were calculated in terms of pixels. The co-localization function of MetaMorph then calculated the percentage of pixels in common between the image in B and the image in C and represents the percent area of tissue occupied by SM. Percent tissue area occupied by SM = 12.6%. Bar = 20 µm.
Transmission Electron Microscopy
Ultrathin sections were cut at 70 nm from ASMKO mouse epon blocks and mounted on 200 mesh copper grids. The grids were stained on a Leica EM Stainer (Leica Microsystems) with 0.5% aqueous uranyl acetate and 3% lead citrate solution. Images were acquired on a JEOL JEM-1400 transmission electron microscope (TEM) (JEOL; Peabody, MA) using a Gatan 785 Erlangshan ESW1000 digital camera (Gatan, Inc.; Pleasanton, CA).
Results
Optimization of Sphingomyelin Preservation in Liver Using a Modified Epon-Araldite Methodology
Liver samples were processed using the reagents and methods outlined in Tables 1 through 3. One-micrometer sections of ASMKO liver treated with tannic acid followed by toluidine blue developed a sharp metachromatic staining pattern, with SM acquiring a dense purple hue against a light blue background (Fig. 1B) in contrast to the typical monochromatic blue color pallette of toluidine blue in the absence of tannic acid treatment (Fig. 1A). Figure 1C demonstrates the typical foamy cell appearance observed in human ASMD liver sections processed routinely in paraffin, which occurs due to the loss of SM. Human liver processed using our optimized methodology resulted in high-resolution light microscopy (HRLM) sections with preservation and enhanced staining of SM (Fig. 1D). Sphingomyelin in the mouse model is located predominantly in Kupffer cells (Fig. 1B, black arrow), whereas it is present abundantly in both Kupffer cells (k) and hepatocytes (h) in human liver (Fig. 1D). These HRLM sections can be used for digital quantification of SM (Fig. 2).
Figure 1.

Optimization of SM preservation in liver with traditional and improved methods. (A) A 1-µm-thick epon-araldite section of ASMKO mouse liver stained without tannic acid yields pale, light blue SM–filled Kupffer cells (arrow). Bar = 20 µm. (B) ASMKO mouse liver section treated with tannic acid followed by staining with toluidine blue. After treatment with tannic acid, Kupffer cells (black arrow) filled with SM appear dense with the new metachromatic staining pattern, whereas deposits with neutral lipid stains green (yellow arrow). Bar = 20 µm. (C) Human acid sphingomyelinase deficiency (ASMD) liver section: This traditional paraffin processing using 10% neutral buffered formalin (NBF) fixation and hematoxylin and eosin (H&E) staining gives 5-µm-thick liver sections a foamy cell appearance due to loss of most of SM substrate (arrows) by the use of chemical solvents. Bar = 20 µm. (D) The application of our new methodology to human liver yields dramatic preservation of SM, which accumulates in both Kupffer cells (k) and hepatocytes (h). Bar = 20 µm. (E) Wild-type (WT) mouse liver used as control shows negative SM storage and greenish appearance of neutral lipid (arrows). Bar = 20 µm.
Application of the Modified Epon-Araldite Method to Multiple Tissues
We tested our new methodology on ASMKO mouse tissues from multiple organs to confirm that SM is preserved equally well across tissues of varying density, SM quantity, and SM cell localization, including pulmonary lavage cytology.
Pulmonary tissue from the ASMKO mouse contained numerous alveolar macrophages enlarged by well-preserved SM (Fig. 3A). In the spleen, white and particularly red pulp were infiltrated with enlarged macrophages, which stained purple for SM (Fig. 3B). The red pulp provides a marked contrast and represents the densest concentration of SM. Sphingomyelin-laden neurons and capillary endothelial cells were also well preserved in sections of cerebral cortex (Fig. 3C) and within the dermis of the footpad (Fig. 3D). Cells of the renal glomeruli and tubules also contained SM (Fig. 3E). Sphingomyelin was also well-preserved in cytology preparations of pulmonary macrophages isolated from bronchoalveolar lavage (Fig. 3F).
Figure 3.

The modified epon-araldite method could be successfully applied to multiple ASMKO mouse tissues: (A) The examination of lung revealed the presence of SM in the enlarged alveolar macrophages (arrow), (B) spleen shows SM positively stained splenic macrophages (arrow), (C) cerebral cortex demonstrates the moderate SM storage within neuronal cell bodies (arrow), (D) foot pad has positive accumulation of SM in the dermis macrophages (arrow), (E) kidney shows accumulation of SM in the glomerula cells (black arrow) as well as in the Bowman’s capsule (yellow arrow), and (F) isolated pulmonary macrophages are shown from bronchoalveolar lavage (BAL) cytology of ASMKO mouse. Bars = 20 µm.
Lysenin Affinity Staining
Lysenin affinity stain could also be applied to semi-thin sections of these epon blocks, providing an additional method for identifying SM in ASMD tissues. Figure 4 shows SM highlighted with a Vulcan Fast Red chromogen in ASMKO liver (Fig. 4A) and ASMKO mouse pulmonary macrophages from pulmonary lavage cytology (Fig. 4B). The lysenin stain also identifies SM-laden dermal macrophages on a section of skin from an ASMD patient (Fig. 4C). The negative control demonstrates the lack of staining in wild-type (WT) mouse liver (Fig. 4D).
Figure 4.

Lysenin affinity staining for SM identification may also be performed on epon-araldite sections. (A) ASMKO liver section, (B) ASMKO pulmonary macrophages from pulmonary lavage cytology samples. (C) Dermal macrophages (arrow) are positive in ASMD patient skin. (D) Wild-type (WT) liver shows negative storage of SM. Bars = 20 µm.
Electron Microscopy
Ultrathin sections were cut from epon blocks of both ASMKO mouse liver and pulmonary lavage samples and processed for electron microscopy. Figures 5A, B show the preservation of the SM ultrastructure with its characteristic “fingerprint” or myelin figure appearance. Sections of cytology blocks processed for electron microscopy also demonstrated impressive SM ultrastructure (Fig. 5B).
Figure 5.

Transmission electron microscopic images of ASMKO mouse liver and pulmonary lavage samples. (A) The SM is present in Kupffer cells of the ASMKO liver as tight, fingerprint-like scroll figures (arrow). Bar = 2 µm. (B) Isolated pulmonary macrophages also demonstrated excellent preservation of SM ultrastructure. Bar = 1 µm.
Discussion
Over the past 10 to 15 years, the increased interest in the development of therapies for lysosomal storage disorders has driven a demand for better histologic preservation of the accumulating substrate. Investigators have recognized the utility of observing changes in tissue pathology with treatment and its value as a biomarker of therapeutic efficacy. The development of enzyme replacement for Fabry disease necessitated the routine use of semi-thin sections cut from epon-araldite embedded tissues and stained with Richardson’s stain (methylene blue/Azure II) to perform semi-quantitative analysis of substrate clearance (Thurberg et al. 2002, 2004, 2009). Similar HRLM methods were later developed and customized for the study of glycogen accumulation in Pompe disease (Lynch et al. 2005). For Pompe disease, optimized color contrast staining allowed the addition of computer morphometry for quantitative analysis of glycogen, before and after treatment (Thurberg et al. 2006). In this study, we have developed a customized processing and staining protocol for another lysosomal storage disorder, Niemann-Pick disease (types A and B), also known as acid sphingomyelinase deficiency.
First, the SM must be adequately fixed in the tissue so that subsequent processing removes as little SM as possible. Lipid in general is difficult to preserve for light and electron microscopy. Epon-araldite resin is recognized as a superior method for obtaining greater morphological detail in tissue sections. The standard processing protocol provided by the resin manufacturer (Electron Microscopy Sciences) resulted in chatter of our SM-laden tissue sections, most likely due to routine glutaraldehyde fixation and overdehydration during processing. We found that fixing ASMKO tissue for epon-araldite in a mixture of 2% paraformaldehyde and 2% glutaraldehyde penetrates rapidly with the least amount of tissue shrinkage. To further improve the quality of sectioning and preservation of SM, a postfixation step during processing with osmium tetroxide and potassium dichromate was also added. Osmium tetroxide is soluble in fats and forms a black reduction compound at the double carbon-to-carbon bond by the addition of one molecule of osmium tetroxide to one double bond. The resulting ester may, in turn, attach to other double bonds, forming double coordinate linkages. Complexes formed are no longer soluble in the usual fat solvents (Sheehan and Hrapchak 1980). At the same time, potassium dichromate renders lipids insoluble in lipid solvents and acts as an effective mordant during staining. The dehydration steps must be performed with acetone, because it extracts phospholipids far less than does ethanol. Immersion fixation in 2% glutaraldehyde and 2% paraformaldehyde, postfixation with osmium tetroxide and potassium dichromate, and dehydration with acetone dramatically improved cellular ultrastructure and preserved the lysosomal structures characteristic of NP disease by TEM (Fig. 5).
Second, the staining method must show the SM clearly and specifically, and from our current observations, the tannic acid in Ringer’s solution method enhances SM visualization after counterstaining with toluidine blue. If this stain is to be used, it is essential to adhere strictly to the times stated in the method to minimize background staining. It is also necessary to have high-quality sections of uniform thickness.
Retention of SM was also visualized by lysenin staining. It identified the accumulations of SM in Kupffer cells of the ASMKO liver (Fig. 4A) and in pulmonary macrophages obtained by lavage (Fig. 4B) as well as dermal macrophages of patient skin (Fig. 4C). WT mouse liver used as controls showed negative SM storage using improved (Fig. 4D) or traditional methods (data not shown).
Both methods were suitable for identification of SM in NP tissue and yielded comparable results with superior tissue morphology and optimal SM preservation. The preservation of SM at the electron microscopy level was equally impressive, particularly in the cytology from pulmonary lavage samples. This was likely due to the rapid preservation of single cells in suspension.
This modified epon-araldite processing method allows investigators to visualize well-preserved SM from sections cut from a single block of prepared tissue by HRLM (using either tannic acid/toluidine blue or lysenin stains) and by electron microscopy. The development of these methods has allowed the use of pathology samples as biomarkers of disease and therapeutic efficacy in the study of enzyme replacement therapy in both preclinical models and in ASMD patient samples.
Acknowledgments
We express our appreciation to the Dr. Edward H. Schuchman from the Mount Sinai School of Medicine for providing the animal model for NP disease and to Robert Thomas and Brian DelGiudice from Biomedical Media Services for image support.
Footnotes
Declaration of Conflicting Interests: The authors declared a potential conflict of interest (e.g. a financial relationship with the commercial organizations or products discussed in this article) as follows: All authors are employees of Genzyme, a Sanofi Company which supported this research.
Funding: The authors disclosed receipt of the following financial support for the research, authorship, and/or publication of this article: This work was supported by the Genzyme, a Sanofi Company.
References
- Chan WC, Lai KS, Todd D. 1977. Adult Niemann-Pick disease—a case report. J Pathol. 121:177–181 [DOI] [PubMed] [Google Scholar]
- Dawson PG, Dawson G. 1982. Adult Niemann-Pick disease with sea-blue histiocytes in the spleen. Hum Pathol. 13:1115–1120 [DOI] [PubMed] [Google Scholar]
- Hall P, Gormley BM, Jarvis LR, Smith RD. 1980. A staining method for the detection and measurement of fat droplets in hepatic tissue. Pathology. 12:605–608 [DOI] [PubMed] [Google Scholar]
- Horinouchi K, Erlich S, Perl DP, Ferlinz K, Bisgaier CL, Sandhoff K, Desnick RJ, Stewart CL, Schuchman EH. 1995. Acid sphingomyelinase deficient mice: a model of types A and B Niemann-Pick disease. Nat Genet. 10:288–293 [DOI] [PubMed] [Google Scholar]
- Kovesi TA, Lee J, Shuckett B. 1996. Pulmonary infiltration in Niemann-Pick disease type C. J Inherit Metab Dis. 19:792–793 [DOI] [PubMed] [Google Scholar]
- Lynch C, Johnson J, Vaccaro C, Thurberg BL. 2005. High-resolution light microscopy (HRLM) and digital analysis of Pompe disease pathology. J Histochem Cytochem. 53:63–73 [DOI] [PubMed] [Google Scholar]
- McGovern MM, Wasserstein MP, Giugliani R, Bembi B, Vanier MT, Mengel E, Brodie SE, Mendelson D, Skloot G, Desnick RJ, et al. 2008. A prospective, cross-sectional survey study of the natural history of Niemann-Pick disease type B. Pediatrics. 122:341–349 [DOI] [PMC free article] [PubMed] [Google Scholar]
- Sheehan DC, Hrapchak BB. 1980. Theory and practice of Histotechnology. 2nd ed. Columbus, OH: Battelle Press [Google Scholar]
- Tassoni JP, Fawaz KA, Johnson DE. 1991. Cirrhosis and portal hypertension in a patient with adult Niemann-Pick disease. Gastroenterology. 100:567. [DOI] [PubMed] [Google Scholar]
- Thurberg BL, Byers HR, Granter SR, Phelps RG, Gordon RE, O’Callaghan M. 2004. Monitoring the three year efficacy of enzyme replacement therapy in Fabry disease by repeated skin biopsies. J Invest Dermatol. 122:900–908 [DOI] [PubMed] [Google Scholar]
- Thurberg BL, Fallon JT, Mitchell R, Aretz T, Gordon RE, O’Callaghan M. 2009. Cardiac microvascular pathology in Fabry disease: evaluation of endomyocardial biopsies before and after enzyme replacement therapy. Circulation. 118:2561–2567 [DOI] [PubMed] [Google Scholar]
- Thurberg BL, Lynch Maloney C, Vaccaro C, Afonso K, Chun-Hui Tsai A, Bossen E, Kishnani PS, O’Callaghan M. 2006. Characterization of pre- and post-treatment pathology after enzyme replacement for Pompe disease. Lab Invest. 86:1208–1220 [DOI] [PubMed] [Google Scholar]
- Thurberg BL, Rennke H, Colvin RB, Dikman S, Gordon RE, Collins AB, Desnick RJ, O’Callaghan M. 2002. Globotriaosylceramide accumulation in the Fabry kidney is cleared from multiple cell types after enzyme replacement therapy. Kidney Int. 62:1933–1946 [DOI] [PubMed] [Google Scholar]
- Volk BW, Adachi M, Schneck L. 1972. Pathology of sphingolipidoses. Semin Hematol. 9:327–329 [PubMed] [Google Scholar]