Abstract
Objectives
The aim of this study was to evaluate fully quantitative myocardial blood flow (MBF) at a pixel level based on contrast-enhanced first-pass cardiac magnetic resonance (CMR) imaging in dogs and patients.
Background
Microspheres can quantify MBF in subgram regions of interest but CMR perfusion imaging may be able to quantify MBF and differentiate blood flow at much higher resolution.
Methods
First-pass CMR perfusion imaging was performed in a dog model with local hyperemia induced by intracoronary adenosine. Fluorescent microspheres were the reference standard for MBF validation. CMR perfusion imaging was also performed on patients with significant coronary artery disease (CAD) by invasive coronary angiography. Myocardial time-signal intensity curves of the images were quantified on a pixel-by-pixel basis using a model-constrained deconvolution analysis.
Results
Qualitatively, color CMR perfusion pixel maps were comparable to microsphere MBF bull’s-eye plots in all animals. Pixel-wise CMR MBF estimates correlated well against subgram (0.49 ± 0.14 g) microsphere measurements (r=0.87 to 0.90) but showed minor underestimation of MBF. To reduce bias due to misregistration and minimize issues related to repeated measures, one hyperemic and one remote sector per animal were compared to the microsphere MBF which improved the correlation (r=0.97 to 0.98) and the bias was close to zero. Sector-wise and pixel-wise CMR MBF estimates also correlated well (r=0.97). In patients, color CMR stress perfusion pixel maps showed regional blood flow decreases and transmural perfusion gradients in territories served by stenotic coronary arteries. MBF estimates in endocardial versus epicardial subsectors, and ischemic versus remote sectors, were all significantly different (p<0.001 and p<0.01).
Conclusions
Myocardial blood flow can be quantified at the pixel level (~32 microliters of myocardium) on CMR perfusion images and results compared well with microsphere measurements. High-resolution pixel-wise CMR perfusion maps can quantify transmural perfusion gradients in patients with CAD.
Keywords: cardiac magnetic resonance imaging, myocardial perfusion, gadolinium, myocardial ischemia
INTRODUCTION
First-pass gadolinium-enhanced cardiac magnetic resonance (CMR) perfusion imaging is effective in detecting and diagnosing coronary artery disease (CAD) in patients (1–11). Several studies have used semi-quantitative approaches to measure first-pass CMR perfusion images. While these methods are generally simple, semi-quantitative perfusion estimates compress the effects of vasodilation into a narrower range of perfusion values compared with fully quantitative estimates (12,13). Myocardial blood flow (MBF) can be estimated from first-pass CMR perfusion images (12,14–18). These validation studies showed that fully quantitative MBF estimates from CMR correlated well with absolute MBF as measured by microspheres. However, these studies were performed on a sector-by-sector basis to improve signal-to-noise ratio and to mitigate motion artifacts. This approach inherently downgrades the resolution of CMR perfusion information to significantly larger regions of interest.
The aim of this study was to evaluate whether first-pass CMR perfusion imaging has sufficient spatial resolution to estimate fully quantitative MBF at the pixel level. We developed a computer based method for pixel-wise MBF quantification from CMR perfusion images. The results of the fully quantitative pixel-wise CMR MBF estimates were compared with absolute MBF as determined by microsphere measurements in canines. The heterogeneity of pixel-wise CMR perfusion MBF estimates was studied within myocardial sectors. To evaluate the feasibility of this method in a clinically relevant model, pixel-wise CMR perfusion maps were examined in patients with significant coronary stenosis as determined by invasive coronary angiography to determine whether endocardial to epicardial perfusion gradients could be detected.
METHODS
Experimental preparation
The study protocol was reviewed and approved by the Animal Care and Use Committee of the National Heart, Lung, and Blood Institute (NHLBI). Seven healthy mongrel dogs weighing between 10 to 22 kg were used in this study. The animals were anesthetized with 1–2% isoflurane during the experiment. Instrumentation of the animal included two femoral arterial lines for blood pressure monitoring and microsphere blood sample withdrawals, a left atrial catheter for microsphere injection, and a catheter in a right ventricular branch of the left anterior descending for a local adenosine infusion.
Approximately 5 million 15-micrometer fluorescent labeled microspheres (Interactive Medical Technologies, Irvine, CA, USA) were administered during reference blood sampling (10 mL/min for three minutes) to measure absolute MBF (in mL/min/g) at baseline and during adenosine infusion. Adenosine was infused at 20 μg/kg/min and diluted with normal saline to provide an intracoronary injection rate of 1 ml/min to produce a local hyperemic zone. Microspheres and CMR perfusion imaging was performed within 5 to 10 minutes during the same adenosine infusion.
CMR perfusion imaging
The CMR perfusion images were acquired with a 1.5 Tesla scanner (Magnetom Avanto, Siemens Healthcare, Erlangen, Germany) using a steady-state free precession (SSFP) sequence with saturation recovery magnetization preparation (19). A dual-bolus technique (12) was used which consisted of two doses of gadolinium diethylenetriamine pentaacetic acid (DTPA) (Magnevist; Berlex Laboratories, Wayne, NJ, USA) at 0.005 mmol/kg and 0.05 mmol/kg diluted into equal volumes and injected at 2 mL/sec followed by a 20 mL saline flush. Two or three short-axis images were collected every R-R interval for 60 heartbeats for each bolus during a breath-hold by transiently stopping a mechanical ventilator.
Typical imaging parameters included a 90° composite saturation preparation pulse, 50° read out pulse, saturation recovery time 90 msec, repetition time 2.6 msec, echo time 1.3 msec, field of view 260 x 179 mm, acquisition matrix 128 x 80, image matrix 256 x 176 after interpolation, slice thickness 7 mm. Each voxel represents approximately 32 microliters of myocardium (or 33 mg/voxel). Parallel imaging with an acceleration factor of 2 was used. Two proton density weighted images were also acquired to allow correction of surface coil B1-field inhomogeneity.
Microsphere processing
After perfusion imaging, the animals were euthanized with potassium chloride while under anesthesia. The heart was removed and placed in agar to facilitate cutting into 3.5 mm short-axis slices. The papillary muscles and right ventricular walls were excluded before microsphere processing. A pair of adjacent pathologic slices was matched to a 7 mm short-axis CMR perfusion image based on anatomic landmarks. The pair of the pathologic slices was divided into 8 circumferential sectors which were further subdivided into epicardial and endocardial sectors (16 sectors per slice). Tissue samples and blood reference samples were processed to provide microsphere measurements of MBF (mL/min/g) per specimen.
Clinical CMR Protocol
The clinical study protocol was reviewed and approved by the institutional review board of the NHLBI, and all participants gave written informed consent. Dipyridamole stress (0.56 mg/kg) and rest CMR perfusion imaging were performed on a healthy volunteer and five patients (4 men and 1 woman, mean age 59±12) with known or suspected CAD. All patients had coronary artery stenosis confirmed by coronary catheterization within 60 days of the CMR. The CMR imaging was performed using a SSFP dual-sequence method (20) with imaging parameters similar to the animal study. This dual-sequence method obtains a low-resolution arterial input function image and three myocardial images during each R-R interval. A gadolinium DTPA contrast at 0.05 mmol/kg was injected at 5 mL/sec during the first-pass perfusion imaging.
Sector-wise CMR perfusion image analysis
To compare sector-wise MBF measurements from CMR perfusion images and microsphere MBF, endocardial and epicardial borders of the left ventricular (LV) myocardium were manually traced on a perfusion image series using Argus CMR software (Syngo, Siemens Healthcare, Erlangen, Germany). The myocardial region of interest defined by these borders was divided into 8 circumferential sectors, and then subdivided into epicardial and endocardial sectors to match the corresponding 16 sectors of the pathologic slice in all animals.
Myocardial time-signal intensity curves were generated from the myocardial region of interest of the perfusion image series. The arterial input function was measured from the low-dose contrast or low-resolution image series. B1 normalized time-signal intensity curves were quantified using a model-constrained deconvolution (as explained in a later section) to obtain sector-wise MBF estimates.
Pixel-wise CMR perfusion image analysis
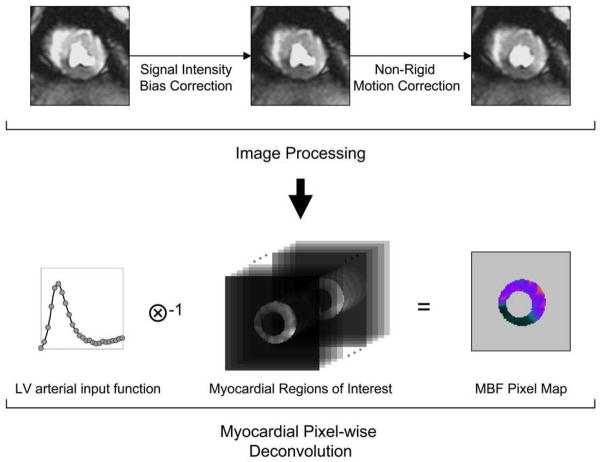
To compute pixel-wise MBF from CMR perfusion images, a series of image processing steps were performed using custom software developed in Interactive Data Language (ITT Visual Information Solutions, Boulder, CO, USA) to obtain the time-signal intensity curve of each pixel in the myocardial regions of interest (Figure-1). First, B1-field inhomogeneity was approximated by using a high order polynomial surface fit with a hierarchical weighting scheme to the proton density weighted image (21). The estimated signal intensity bias field was then applied to the T1 weighted perfusion image series to correct for the B1 inhomogeneity.
Figure 1. Diagram for Quantifying CMR Perfusion at a Pixel-level.
(a) The flow diagram of the image processing pipeline for CMR myocardial perfusion analysis. (b) Pixel-wise myocardial blood flow (MBF) was quantified from the time-signal intensity curves of the LV blood pool and myocardial regions of interest.
Next, rigid and non-rigid image registration methods were performed on the CMR perfusion images to ensure proper propagation of time-signal intensity of the myocardial pixels. All images of the same slice were first registered to the center of the myocardial regions of interest to compensate rigid body translational motion. A user selected landmark at the anterior right ventricular and LV junction line was then used to adjust rigid body rotational motion. Finally, a non-rigid image registration algorithm was used to correct geometric deformation of the myocardium. This was based on mapping endocardial and epicardial borders of the perfusion image series to two common concentric circles that define a new region of interest. The size of the two concentric circles was calculated by using average radii of the endocardial and epicardial borders from all images. A closest distance measure was used to obtain the correspondence of control points between myocardial borders and the concentric circles. The myocardial region of interest in each image was then processed by a thin-plate spline warping to compensate for possible deformation of the myocardium.
These image processing steps were used to improve the spatial consistency of the image pixels in the myocardium and to extract pixel-wise myocardial time-signal intensity curves. Pixel-wise time-signal intensity curves were quantified using a model-constrained deconvolution to obtain MBF pixel maps.
Myocardial blood flow quantification
The central volume principle described by Zierler (22,23) in indicator-dilution methods was the basis for myocardial blood flow quantification. It assumes the system response of contrast transport within a tissue to be linear and stationary. The contrast concentration curve of the tissue can then be expressed as a convolution of the arterial input function and an impulse response function. The impulse response function is a probability density function that characterizes contrast transit times through the system. This function, h(t), can be obtained through a reverse process of deconvolution. Since deconvolution is sensitive to noise, the shape of h(t) is constrained to a mathematical model. The best parameters describing the model are determined by iterative calculations. This overall process is called model-constrained deconvolution (15,24).
Here we propose a logistic impulse response function, , where F represents the magnitude of the function, t and k describe the temporal delay length and decay rate of h(t) due to dynamically changing contrast concentration. This model differs from the commonly used Fermi function (15,25) by the introduction of an interstitial offset term I. This parameter provides a linear shift of the impulse response function from zero during and after the first-pass, which accounts for leakage of the contrast into the interstitial space and the slow clearance relative to the first-pass kinetics. MBF in both pixel-wise and sector-wise analyses was estimated using this model from the LV arterial input and myocardial time-signal intensity curves.
Statistical analysis
Data are expressed as mean ± standard deviation (SD) unless specified. The relationship between CMR estimates of MBF and microsphere reference absolute MBF was evaluated by linear correlation. Limits of agreement were assessed by Bland-Altman plots. Coefficient of variation (CV) was defined as the ratio of the SD to the mean. P<0.05 was considered statistically significant.
CMR MBF pixel maps of all animals were divided then averaged to 8 endocardial and 8 epicardial subsectors to compare with microspheres. Additionally, subsector averages of MBF pixel maps were also compared with MBF estimates from sector-wise time-signal intensity curves.
In CMR perfusion pixel maps of patients with CAD, endocardial MBF, epicardial MBF, and endocardial to epicardial MBF ratios were measured with regions of interest in remote myocardium, and in myocardium served by coronary arteries with significant coronary stenoses. MBF and MBF ratios were compared using a paired Student’s t-test.
RESULTS
Physiological measurements remained reasonably stable during the experiment. The average heart rate was 101 ± 18 and 98 ± 19 before and during adenosine infusion. The average systolic and diastolic blood pressures were 115 ± 11 mmHg and 68 ± 10 mmHg, respectively, before the adenosine infusion. Both systolic and diastolic blood pressures dropped slightly to 112 ± 14 mmHg and 61 ± 8 mmHg, respectively, during the adenosine infusion. For microsphere processing, the endocardial sectors weighed 0.41 ± 0.09 g (n=56), epicardial sectors weighed 0.58 ± 0.13 g (n=56), and transmural sectors averaged 0.99 ± 0.20 g (n=56). The median microsphere count in endocardial sectors was 2974 (range 926 to 9569) and in epicardial sectors was 4677 (range 1318 to 15811). Microsphere results showed successful vasodilation for all canines defined as at least a two-fold higher microsphere MBF in hyperemic sectors relative to remote sectors.
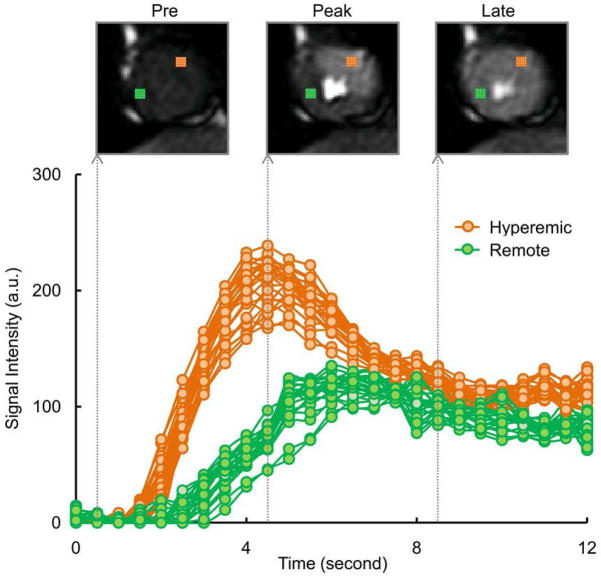
Figure-2 compares pixel-wise time-signal intensity curves for hyperemic versus remote regions. A similar time course of contrast enhancement was observed between pixels within the same region. There was a hyperemic response on the adenosine affected regions as shown by faster contrast wash-in and wash-out kinetics, and a higher overshoot in the pixel-wise time-signal intensity curves.
Figure 2. CMRTime-Signal Intensity Curves at a Pixel-level.
Pixel-wise myocardial time-signal intensity curves show hyperemic response in an adenosine induced region (25 pixels in orange color) compared to a remote region (25 pixels in green color). A similar time course of contrast enhancement was observed between neighboring pixels within the same region. Example perfusion images at different time points are shown at pre, peak, and late contrast enhancement.
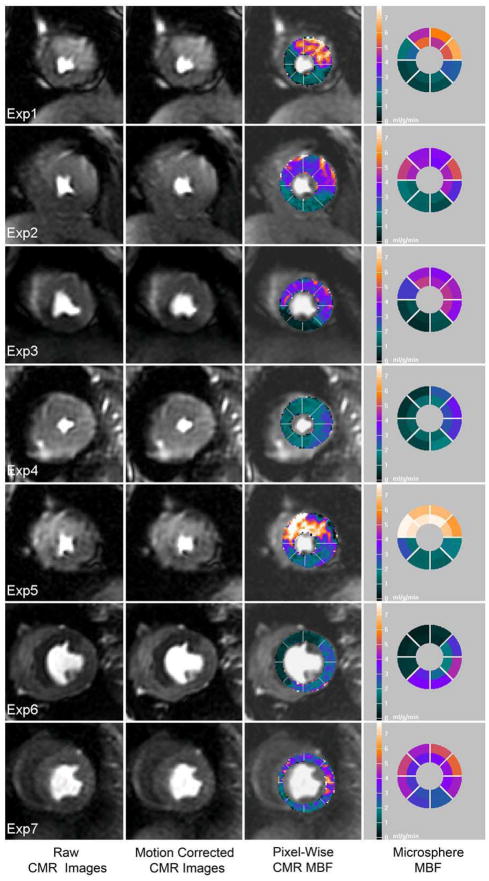
For qualitative comparisons, Figure-3 shows colorized CMR perfusion pixel maps of all animals with corresponding microsphere MBF on the same absolute color scale. Regional differential blood flow was clearly seen in all animals. Qualitatively, the dynamic range of color perfusion maps from CMR was comparable to microsphere bull’s-eye plots in all animals. At the same time, there were also sectors which did not correspond perfectly due to spatial misregistration between CMR imaging slice versus pathological microsphere slice. Nevertheless, CMR perfusion pixel maps had a higher spatial resolution (0.033 g/voxel) than sector-wise microsphere maps (0.49 g/sector).
Figure 3. Qualitative Comparison of MBF by Pixel-Wise CMR and Microspheres.
CMR perfusion pixel maps showing myocardial blood flow (MBF) estimates were in a similar range with microsphere absolute MBF (mL/min/g). From left to right columns: a raw image during early contrast enhancement, the result of non-rigid motion correction, the result of pixel-wise CMR MBF estimates, reference microsphere absolute MBF.
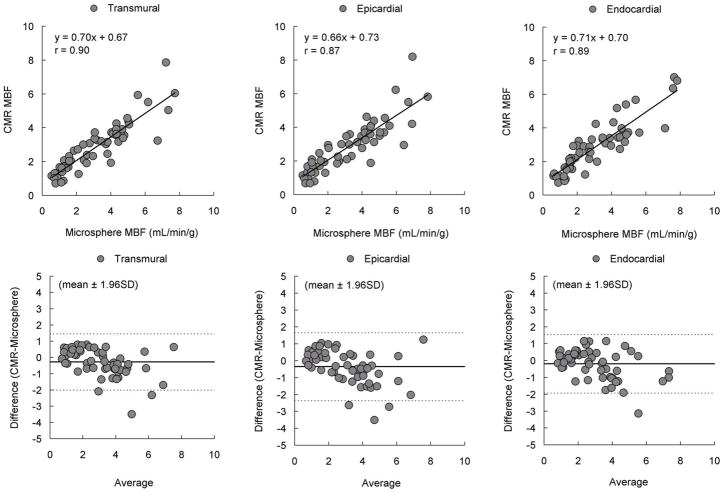
For quantitative comparisons, Figure-4 shows pixel-wise CMR MBF estimates averaged into sector-wise measures which correlate well with microsphere MBF in transmural, endocardial, and epicardial sectors (n=56; r=0.90, r=0.89 and r=0.87, respectively). However, Bland-Altman analysis shows there is a small bias suggesting CMR understimates microsphere MBF or spatial misregistration adds systematic errors to the comparisons.
Figure 4. Comparison of MBF by Pixel-Wise CMR and Microspheres.
Pixel-wise CMR perfusion myocardial blood flow (MBF) estimates correlated well with microsphere absolute MBF measurements but showed minor underestimation of MBF.
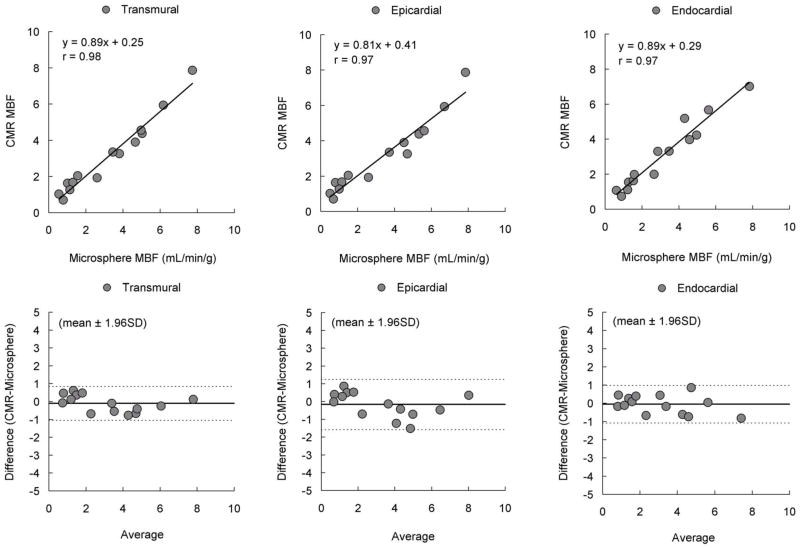
To reduce the probability of misregistration, further comparisons were performed by selecting one hyperemic and one remote sector from the center of each zone on both CMR perfusion images and the pathological slice for each animal. There were even tighter correlations between CMR estimates of MBF and microsphere measurements in transmural, endocardial, and epicardial sectors (n=14; r=0.98, r=0.97 and r=0.97, respectively, Figure-5). Bland-Altman analysis also showed minimal residual bias for these comparisons.
Figure 5. Higher Correlation and Smaller Bias After Reducing Misregistration.
There were higher correlation and smaller bias between pixel-wise CMR perfusion myocardial blood flow (MBF) estimates and microsphere absolute MBF after reducing misregistration.
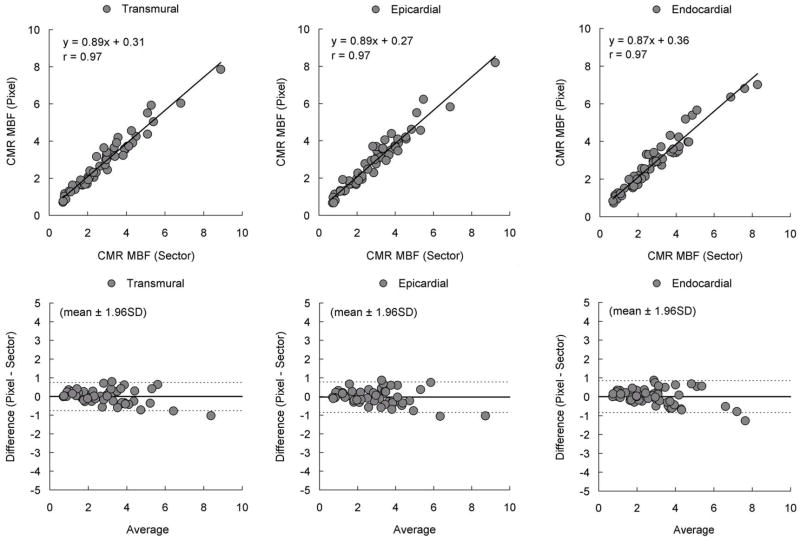
To address whether quantification of CMR time-signal intensity curves at a pixel level introduces biases relative to quantification of sector-wise time-signal intensity curves, additional correlation and Bland-Altman analysis were performed (Figure-6). There was a strong correlation in transmural, endocardial, and epicardial comparisons (r=0.97 for all comparisons). Similarly, there was no significant bias in all Bland-Altman plots. This indicates that MBF quantified at the pixel level does not intrinsically alter the perfusion information content of the CMR images as estimated from conventional sector-wise analysis.
Figure 6. Comparison of MBF by Pixel-Wise and Sector-Wise CMR.
Correlations between CMR myocardial blood flow (MBF) estimated from pixel-wise and sector-wise time-signal intensity curves were excellent. Bland-Altman analysis showed there is no significant bias. MBF quantified at the pixel level does not intrinsically degrade the perfusion information content of the CMR images as estimated from sector-wise analysis.
To analyze transmural perfusion gradients in our animal model. endocardial MBF, epicardial MBF, and endocardial to epicardial MBF ratio were measured on CMR perfusion pixel maps and microspheres. For both hyperemic and remote regions, there were no significant blood flow differences between endocardial and epicardial MBF by CMR or microspheres measurements (Table-1, all p=NS). When comparing CMR and microspheres MBF measurements, there were also no significant differences between the two methods for endocardial hyperemic MBF, epicardial hyperemic MBF, or corresponding measurements in the remote region (Table-1, all p=NS). However, CMR perfusion pixel maps and microspheres both detected significant differences in MBF between hyperemic and remote regions (Table-1, all p<0.01).
Table 1.
Analysis of endocardial MBF, epicardial MBF, and endocardial to epicardial ratio in dogs CMR perfusion pixel maps and microspheres measurements. Results are expressed in mean ± standard deviation.
| CMR | Endocardial | Epicardial | Ratio |
|---|---|---|---|
| Hyperemic | 4.64 ± 1.31 | 4.55 ± 1.08 | 1.05 ± 0.15 |
| Remote | 1.43 ± 0.48 | 1.44 ± 0.50 | 0.99 ± 0.19 |
| Microspheres | Endocardial | Epicardial | Ratio |
|---|---|---|---|
| Hyperemic | 4.53 ± 1.62 | 5.11 ± 0.38 | 0.88 ± 0.14 |
| Remote | 1.47 ± 0.64 | 1.32 ± 0.74 | 1.16 ± 0.17 |
To study the heterogeneity of pixel-wise CMR perfusion MBF in hyperemic and remote regions, the coefficient of variation of pixel-wise MBF in transmural, endocardial, and epicardial sectors was measured (Table-2). There was less variability of pixel-wise MBF estimates in hyperemic sectors compared to the remote. This smaller variability was consistent in transmural, endocardial, and epicardial sectors.
Table 2.
The variability of pixel-wise CMR MBF in hyperemic and remote sectors as represented by coefficient of variation (CV).
| CMR | Endocardial | Epicardial | Transmural |
|---|---|---|---|
| Hyperemic | 0.15 | 0.18 | 0.19 |
| Remote | 0.19 | 0.23 | 0.22 |
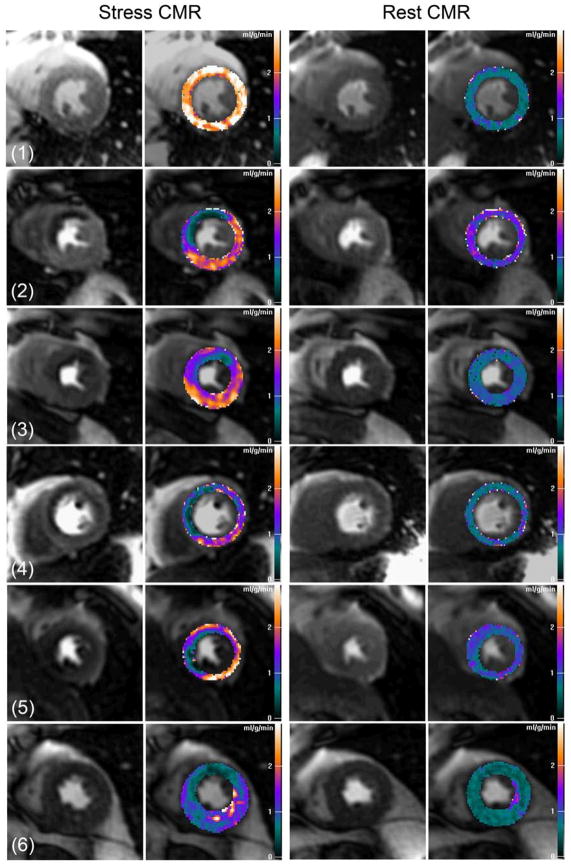
Since the selective coronary infusion of adenosine did not create transmural perfusion gradients in the dogs, we analyzed transmural perfusion gradients in patients with significant coronary artery stenosis as determined by invasive coronary angiography. Figure-7 shows examples of pixel-wise MBF maps for human first-pass perfusion CMR imaging at rest and during stress. Pixel-wise perfusion maps of the healthy volunteer (subject 1) show MBF estimates in the range of 0.5 to 1.0 ml/g/min at rest, and increase to above 2.5 ml/g/min range during stress for all 3 coronary territories.
Figure 7. Clinical CMR Perfusion Pixel Maps.
Pixel-wise CMR myocardial perfusion maps of a healthy volunteer (subject 1) and patients with various degrees of coronary artery disease (subject 2–6). See results section for details and quantitative analysis.
For two patients with single vessel LAD disease (subject 2 and 3), pixel-wise MBF maps of stress CMR showed transmural perfusion gradients in the LAD territory. In subject 4, stress CMR maps showed a severe LAD perfusion defect corresponding to a 70% ostial stenosis and a less severe subendocardial perfusion defects corresponding to intermediate stenoses in the RCA and circumflex coronary arteries. In subject 5, there were obvious stress induced perfusion defects in the LAD (80% stenosis) and RCA territory (collateral dependent occluded vessel), and a mild subendocardial perfusion defect associated with a terminal obtuse marginal branch with a 70% stenosis. There were reduced MBF in all myocardial regions on the stress CMR perfusion map of another patient with 3 vessel disease (subject 6). Overall, CMR perfusion maps were more homogeneous at rest compared to stress CMR maps in all patients with CAD.
To quantify transmural gradient in patients with significant coronary stenosis, endocardial MBF, epicardial MBF, and endocardial to epicardial MBF ratio of the ischemic and remote regions in CMR perfusion pixel maps were compared. Table-3 shows there were no differential blood flows between endocardial to epicardial subsectors in the remote regions (p=NS). However, there were significant blood flow differences between endocardial and epicardial subsectors in the ischemic territories (p<0.001). Both endocardial and epicardial MBF estimates in the ischemic regions were also significantly lower than in the remote regions (p<0.001 for endocardial and p<0.01 for epicardial comparisons).
Table 3.
Analysis of endocardial MBF, epicardial MBF, and endocardial to epicardial ratio CMR perfusion pixel maps in patients. Results are expressed in mean ± standard deviation.
| CMR | Endocardial | Epicardial | Ratio |
|---|---|---|---|
| Ischemic | 0.76 ± 0.38 | 1.31 ± 0.45 | 0.58 ± 0.22 |
| Remote | 2.03 ± 0.30 | 2.05 ± 0.58 | 1.03 ± 0.20 |
DISCUSSION
The importance of this paper resolves the concept that perfusion information encoded in the first-pass CMR images is quantifiable at a pixel level (around 32 microliters of tissue per pixel) in a canine model. We present an approach to generate comprehensive pixel-wise MBF maps for high resolution quantitative visualization of first-pass gadolinium-enhanced perfusion CMR images. Both pixel-wise and sector-wise comparisons showed MBF estimates from CMR closely correlated with absolute microsphere measurements over a wide range of MBF values, particularly in analyses done in ways to minimize misregistration. The results of pixel-wise perfusion maps displayed on a calibrated color scale are qualitatively comparable to microsphere bull’seye plots when displayed on the same absolute MBF color scale but at 15 times higher resolution. While the animal model did not create statistically significant transmural perfusion gradients, such transmural perfusion gradients were present qualitatively and quantitatively on stress CMR perfusion maps in patients with significant coronary artery stenoses.
Theoretically and empirically CMR imaging has sufficient spatial resolution to differentiate perfusion between subendocardial and subepicardial regions (26). Transmural gradients of myocardial perfusion from CMR images have been compared in animal models (16,27), in normal volunteers (28), and in patients (29). These studies used a sector-by-sector basis approach and showed transmural flow differences in CMR perfusion. Pixel-wise semi-quantitative perfusion maps can identify patients with CAD (5,8,30) but lack consistent scales for differentiating normal from abnormal. Pixel-wise fully quantitative perfusion maps have also been evaluated in normal animal models using intravascular contrast (31) and in normal human subjects (32). Although these studies have shown global perfusion differences between resting and hyperemic myocardium, regional perfusion changes have not previously been demonstrated at a pixel level.
Flow heterogeneity of myocardial perfusion
Flow heterogeneity within the heart is well documented in pre-clinical models (33) and represents an interplay amongst the heterogeneity of metabolism/physiology of the myocardium (34), coronary vascular anatomy at small scale, and technical limitations related to perfusion methods such as microspheres (35). Bassingthwaighte showed that microspheres tend to systematically overestimate regions of high flow and underestimate regions of low flow yet are sufficient for estimating regional flow in the heart (36). The current pixel-wise CMR MBF results (Table-2) have comparable or less variability than prior microsphere flow measurements with respect to absolute rest flow, vasodilated flow, and flow heterogeneity (33,37). With regard to flow heterogeneity versus sample size, the CMR pixel-wise perfusion estimates are less variable than predicted by the fractal-model derived from the microspheres for such small tissue masses (37).
Compensating for non-rigid motion
Image registration is an essential image processing step for quantifying CMR perfusion images at a pixel level. Motion artifacts are inevitable. Rigid body image registration (38–44) has been studied but these methods do not correct for local deformations. Some techniques compensate for non-rigid image motion semi-automatically (45) or automatically (46). In this study we implemented a semi-automated non-rigid image registration method and this method performed well on all data sets.
Compensating for interstitial loading
CMR Gadolinium contrast agents are imperfect perfusion tracers as they rapidly enter the extracellular space. While the first-pass myocardial time-signal intensity are heavily perfusion dependent, interstitial loading of contrast can distort the measured time-signal intensity curves from what would be expected for an intravascular agent. Practically, the early phase of the myocardial time-signal intensity curves is less sensitive to the capillary leakage of contrast agent compared to the later portion of the curves (27). However, the interstitial loading during the later phase of contrast enhancement results in a large plateau in the myocardium several times higher than expected for the second-pass of contrast.
Although the Fermi function approximates the shape of the impulse response of an intravascular tracer (25), it does not account for interstitial loading of the gadolinium contrast. As a result, Fermi function constrained deconvolution should be limited to the first myocardial contrast passage (15,24). The proposed impulse response function compensates for these problems by incorporating an offset term into the deconvolution model to allow the time intensity curve fitting beyond the first-pass of the contrast. This approach can reduce the subjectivity of selecting the first-pass range in CMR perfusion quantification and facilitate automating perfusion quantification.
Nonlinear signal intensity in CMR perfusion imaging
The nonlinearity between myocardial signal intensity and gadolinium contrast concentration might affect MBF quantification (47). The current study used dual-bolus contrast administration (12) and a half-dose contrast with FISP imaging sequence parameters to improve the linearity of CMR signal intensity and to minimize the need for nonlinear signal intensity calibration.
Clinical implications
Quantitative and objective analysis of CMR perfusion images has potential to improve clinical diagnosis. Objective semi-quantitative methods have become important clinical tools in SPECT myocardial perfusion imaging (48,49). Quantitative measurements of myocardial perfusion may have similar impact in CMR imaging. Examples of pixel-wise CMR perfusion maps as presented in this study show transmural perfusion gradients can be differentiated in patients with various degrees of ischemia. Thus first-pass CMR perfusion imaging provides sufficient spatial resolution to estimate MBF at the pixel level which may someday improve the diagnosis of CAD in patients.
Study limitations
The reference standard microsphere MBF has a resolution about 15 times lower than pixel-wise CMR MBF estimates. This difference in spatial resolution limits the direct comparison of MBF between CMR and microspheres to the sector level. However, internal comparisons of pixel-wise and sector-wise CMR MBF estimates are consistent and do not appear limited by the pixel-wise signal-to-noise ratio.
Misregistration between CMR imaging slice versus pathological microsphere slice is always a potential source of errors. Minimizing probability of misregistration improves the correlations between CMR and microspheres estimates of MBF as shown in Figure-4 and Figure-5 comparisons.
The current study used manual tracing of myocardial borders for non-rigid image registration. Although the method is effective, it is time-consuming. Automated non-rigid image registration (46) may compensate for motion artifacts and may improve the workflow of pixel-wise CMR perfusion quantification.
The number of animals used in this study was limited and the animal model chosen did not include different levels of coronary stenoses or complete occlusion which may limit the accuracy of pixel-wise MBF estimates under total ischemic conditions. The sample size of clinical studies was also limited, although various degrees of ischemia were incorporated to demonstrate pixel-wise CMR perfusion maps can detect transmural perfusion gradients or differential blood flow from single or multiple vessel stenoses. Further trials are required to evaluate whether pixel-wise CMR perfusion quantification may improve the diagnostic accuracy for detecting CAD compared to conventional sector-based approach.
CONCLUSIONS
Myocardial blood flow in gadolinium-enhanced first-pass CMR perfusion image can be quantified at a pixel level which is equivalent to 32 microliters per sample in this canine model. The heterogeneity of pixel-wise CMR MBF estimates is comparable or smaller than previously published microsphere results in canines. High-resolution pixel-wise CMR perfusion maps can detect transmural perfusion gradients and may someday improve the objectivity of diagnosing CAD in patients.
Acknowledgments
We are grateful to Joni Taylor, Katherine Lucas, and the NHBLI Laboratory of Animal Medicine and Surgery staff for their assistance with operative procedures and animal care.
Funded by the intramural program of the National Heart, Lung and Blood Institute (1 Z01 HL004607-08 CE). Supported in part by US Government Cooperative Research and Development Award between NHLBI and Siemens Medical Solution (HL-CR-05-004).
Abbreviations
- CAD
coronary artery disease
- CMR
cardiac magnetic resonance
- CV
coefficient of variation
- DTPA
diethylenetriamine pentaacetic acid
- LAD
left anterior descending
- LV
left ventricular
- MBF
myocardial blood flow
- NS
not statically significant
- RCA
right coronary artery
- SD
standard deviation
- SPECT
single photon emission computed tomography
- SSFP
steady-state free precession
Footnotes
Publisher's Disclaimer: This is a PDF file of an unedited manuscript that has been accepted for publication. As a service to our customers we are providing this early version of the manuscript. The manuscript will undergo copyediting, typesetting, and review of the resulting proof before it is published in its final citable form. Please note that during the production process errors may be discovered which could affect the content, and all legal disclaimers that apply to the journal pertain.
References
- 1.Al-Saadi N, Nagel E, Gross M, et al. Noninvasive detection of myocardial ischemia from perfusion reserve based on cardiovascular magnetic resonance. Circulation. 2000;101:1379–1383. doi: 10.1161/01.cir.101.12.1379. [DOI] [PubMed] [Google Scholar]
- 2.Giang TH, Nanz D, Coulden R, et al. Detection of coronary artery disease by magnetic resonance myocardial perfusion imaging with various contrast medium doses: first European multi-centre experience. European Heart Journal. 2004;25:1657–1665. doi: 10.1016/j.ehj.2004.06.037. [DOI] [PubMed] [Google Scholar]
- 3.Nagel E, Klein C, Paetsch I, et al. Magnetic resonance perfusion measurements for the noninvasive detection of coronary artery disease. Circulation. 2003;108:432–437. doi: 10.1161/01.CIR.0000080915.35024.A9. [DOI] [PubMed] [Google Scholar]
- 4.Paetsch I, Jahnke C, Wahl A, et al. Comparison of dobutamine stress magnetic resonance, adenosine stress magnetic resonance, and adenosine stress magnetic resonance perfusion. Circulation. 2004;110:835–842. doi: 10.1161/01.CIR.0000138927.00357.FB. [DOI] [PubMed] [Google Scholar]
- 5.Panting JR, Gatehouse PD, Yang GZ, et al. Echo-planar magnetic resonance myocardial perfusion imaging: Parametric map analysis and comparison with thallium SPECT. Journal of Magnetic Resonance Imaging. 2001;13:192–200. doi: 10.1002/1522-2586(200102)13:2<192::aid-jmri1029>3.0.co;2-n. [DOI] [PubMed] [Google Scholar]
- 6.Schwitter J, Nanz D, Kneifel S, et al. Assessment of myocardial perfusion in coronary artery disease by magnetic resonance - A comparison with positron emission tomography and coronary angiography. Circulation. 2001;103:2230–2235. doi: 10.1161/01.cir.103.18.2230. [DOI] [PubMed] [Google Scholar]
- 7.Plein S, Radjenovic A, Ridgway JP, et al. Coronary artery disease: Myocardial perfusion MR imaging with sensitivity encoding versus conventional angiography. Radiology. 2005;235:423–430. doi: 10.1148/radiol.2352040454. [DOI] [PubMed] [Google Scholar]
- 8.Thiele H, Plein S, Breeuwer M, et al. Color-encoded semiautomatic analysis of multi-slice first-pass magnetic resonance perfusion: comparison to tetrofosmin single photon emission computed tomography perfusion and X-ray angiography. International Journal of Cardiovascular Imaging. 2004;20:371–384. doi: 10.1023/b:caim.0000041938.45383.a4. [DOI] [PubMed] [Google Scholar]
- 9.Bunce NH, Reyes E, Keegan J, et al. Combined coronary and perfusion cardiovascular magnetic resonance for the assessment of coronary artery stenosis. Journal of Cardiovascular Magnetic Resonance. 2004;6:527–539. doi: 10.1081/jcmr-120030580. [DOI] [PubMed] [Google Scholar]
- 10.Doyle M, Fuisz A, Kortright E, et al. The impact of myocardial flow reserve on the detection of coronary artery disease by perfusion Imaging methods: An NHLBI WISE Study. Journal of Cardiovascular Magnetic Resonance. 2003;5:475–485. doi: 10.1081/jcmr-120022263. [DOI] [PubMed] [Google Scholar]
- 11.Ibrahim T, Nekolla SG, Schreiber K, et al. Assessment of coronary flow reserve: Comparison between contrast-enhanced magnetic resonance imaging and positron emission tomography. Journal of the American College of Cardiology. 2002;39:864–870. doi: 10.1016/s0735-1097(01)01829-0. [DOI] [PubMed] [Google Scholar]
- 12.Christian TF, Rettmann DW, Aletras AH, et al. Absolute myocardial perfusion in canines measured by using dual-bolus first-pass MR imaging. Radiology. 2004;232:677–684. doi: 10.1148/radiol.2323030573. [DOI] [PubMed] [Google Scholar]
- 13.Hsu LY, Rhoads KL, Holly JE, Kellman P, Aletras AH, Arai AE. Quantitative myocardial perfusion analysis with a dual-bolus contrast-enhanced first-pass MRI technique in humans. Journal of Magnetic Resonance Imaging. 2006;23:315–322. doi: 10.1002/jmri.20502. [DOI] [PubMed] [Google Scholar]
- 14.Jerosch-Herold M, Swingen C, Seethamraju RT. Myocardial blood flow quantification with MRI by model-independent deconvolution. Medical Physics. 2002;29:886–897. doi: 10.1118/1.1473135. [DOI] [PubMed] [Google Scholar]
- 15.Jerosch-Herold M, Wilke N, Stillman AE, Wilson RF. Magnetic resonance quantification of the myocardial perfusion reserve with a Fermi function model for constrained deconvolution. Medical Physics. 1998;25:73–84. doi: 10.1118/1.598163. [DOI] [PubMed] [Google Scholar]
- 16.Lee DC, Simonetti OP, Harris KR, et al. Magnetic resonance versus radionuclide pharmacological stress perfusion imaging for flow-limiting stenoses of varying severity. Circulation. 2004;110:58–65. doi: 10.1161/01.CIR.0000133389.48487.B6. [DOI] [PubMed] [Google Scholar]
- 17.Klocke FJ, Simonetti OP, Judd RM, et al. Limits of detection of regional differences in vasodilated flow in viable myocardium by first-pass magnetic resonance perfusion imaging. Circulation. 2001;104:2412–2416. doi: 10.1161/hc4501.099306. [DOI] [PubMed] [Google Scholar]
- 18.Christian TF, Aletras AH, Arai AE. Estimation of absolute myocardial blood flow during first-pass MR perfusion imaging using a dual-bolus injection technique: Comparison to single-bolus injection method. Journal of Magnetic Resonance Imaging. 2008;27:1271–1277. doi: 10.1002/jmri.21383. [DOI] [PubMed] [Google Scholar]
- 19.Schreiber WG, Schmitt M, Kalden P, Mohrs OK, Kreitner KF, Thelen M. Dynamic contrast-enhanced myocardial perfusion imaging using saturation-prepared TrueFISP. Journal of Magnetic Resonance Imaging. 2002;16:641–652. doi: 10.1002/jmri.10209. [DOI] [PubMed] [Google Scholar]
- 20.Gatehouse PD, Elkington AG, Ablitt NA, Yang GZ, Pennell DJ, Firmin DN. Accurate assessment of the arterial input function during high-dose myocardial perfusion cardiovascular magnetic resonance. Journal of Magnetic Resonance Imaging. 2004;20:39–45. doi: 10.1002/jmri.20054. [DOI] [PubMed] [Google Scholar]
- 21.Hsu LY, Aletras AH, Arai AE. Correcting surface coil intensity inhomogeneity improves quantitative analysis of cardiac magnetic resonance images. Proceeding of 5th IEEE International Symposium on Biomedical Imaging (ISBI): From Nano to Macro; Paris, France. 2008. pp. 1425–1428. [Google Scholar]
- 22.Zierler KL. Theoretical Basis of Indicator-Dilution Methods for Measuring Flow and Volume. Circulation Research. 1962;10:393. [Google Scholar]
- 23.Zierler KL. Equations for Measuring Blood Flow by External Monitoring of Radioisotopes. Circulation Research. 1965;16:309. doi: 10.1161/01.res.16.4.309. [DOI] [PubMed] [Google Scholar]
- 24.Jerosch-Herold M, Seethamraju RT, Swingen CM, Wilke NM, Stillman AE. Analysis of myocardial perfusion MRI. Journal of Magnetic Resonance Imaging. 2004;19:758–770. doi: 10.1002/jmri.20065. [DOI] [PubMed] [Google Scholar]
- 25.Axel L. Tissue Mean Transit-Time from Dynamic Computed-Tomography by a Simple Deconvolution Technique. Investigative Radiology. 1983;18:94–99. doi: 10.1097/00004424-198301000-00018. [DOI] [PubMed] [Google Scholar]
- 26.Wilke NM, Jerosch-Herold M, Zenovich A, Stillman AE. Magnetic resonance first-pass myocardial perfusion imaging: Clinical validation and future applications. Journal of Magnetic Resonance Imaging. 1999;10:676–685. doi: 10.1002/(sici)1522-2586(199911)10:5<676::aid-jmri10>3.0.co;2-l. [DOI] [PubMed] [Google Scholar]
- 27.Jerosch-Herold M, Wilke N, Wang Y, et al. Direct comparison of an intravascular and an extracellular contrast agent for quantification of myocardial perfusion. International Journal of Cardiac Imaging. 1999;15:453–464. doi: 10.1023/a:1006368619112. [DOI] [PubMed] [Google Scholar]
- 28.Muehling OM, Jerosch-Herold M, Panse P, et al. Regional heterogeneity of myocardial perfusion in healthy human myocardium: Assessment with Magnetic Resonance Perfusion Imaging. Journal of Cardiovascular Magnetic Resonance. 2004;6:499–507. doi: 10.1081/jcmr-120030570. [DOI] [PubMed] [Google Scholar]
- 29.Muehling OM, Wilke NM, Panse P, et al. Reduced myocardial perfusion reserve and transmural perfusion gradient in heart transplant arteriopathy assessed by magnetic resonance imaging. Journal of the American College of Cardiology. 2003;42:1054–1060. doi: 10.1016/s0735-1097(03)00924-0. [DOI] [PubMed] [Google Scholar]
- 30.Su MYM, Yang KC, Wu CC, et al. First-pass myocardial perfusion cardiovascular magnetic resonance at 3 Tesla. Journal of Cardiovascular Magnetic Resonance. 2007;9:633–644. doi: 10.1080/10976640601093661. [DOI] [PubMed] [Google Scholar]
- 31.Goldstein TA, Jerosch-Herold M, Misselwitz B, Zhang H, Gropler RJ, Zheng J. Fast mapping of myocardial blood flow with MR first-pass perfusion imaging. Magnetic Resonance in Medicine. 2008;59:1394–1400. doi: 10.1002/mrm.21559. [DOI] [PubMed] [Google Scholar]
- 32.Pack NA, DiBella EVR, Rust TC, et al. Estimating myocardial perfusion from dynamic contrast-enhanced CMR with a model-independent deconvolution method. Journal of Cardiovascular Magnetic Resonance. 2008;10 doi: 10.1186/1532-429X-10-52. [DOI] [PMC free article] [PubMed] [Google Scholar]
- 33.Austin RE, Jr, Aldea GS, Coggins DL, Flynn AE, Hoffman JI. Profound spatial heterogeneity of coronary reserve. Discordance between patterns of resting and maximal myocardial blood flow. Circ Res. 1990;67:319–31. doi: 10.1161/01.res.67.2.319. [DOI] [PubMed] [Google Scholar]
- 34.Decking UK. Spatial heterogeneity in the heart: recent insights and open questions. News Physiol Sci. 2002;17:246–50. doi: 10.1152/nips.01393.2002. [DOI] [PubMed] [Google Scholar]
- 35.Decking UK, Pai VM, Bennett E, et al. High-resolution imaging reveals a limit in spatial resolution of blood flow measurements by microspheres. Am J Physiol Heart Circ Physiol. 2004;287:H1132–40. doi: 10.1152/ajpheart.00119.2004. [DOI] [PubMed] [Google Scholar]
- 36.Bassingthwaighte JB, Malone MA, Moffett TC, et al. Molecular and particulate depositions for regional myocardial flows in sheep. Circ Res. 1990;66:1328–44. doi: 10.1161/01.res.66.5.1328. [DOI] [PMC free article] [PubMed] [Google Scholar]
- 37.Bassingthwaighte JB, King RB, Roger SA. Fractal nature of regional myocardial blood flow heterogeneity. Circ Res. 1989;65:578–90. doi: 10.1161/01.res.65.3.578. [DOI] [PMC free article] [PubMed] [Google Scholar]
- 38.Dornier C, Ivancevic MK, Thevenaz P, Vallee JP. Improvement in the quantification of myocardial perfusion using an automatic spline-based registration algorithm. J Magn Reson Imaging. 2003;18:160–8. doi: 10.1002/jmri.10351. [DOI] [PubMed] [Google Scholar]
- 39.Bidaut LM, Vallee JP. Automated registration of dynamic MR images for the quantification of myocardial perfusion. Journal of Magnetic Resonance Imaging. 2001;13:648–655. doi: 10.1002/jmri.1092. [DOI] [PubMed] [Google Scholar]
- 40.Gupta SN, Solaiyappan M, Beache GM, Arai AE, Foo TKF. Fast method for correcting image misregistration due to organ motion in time-series MRI data. Magnetic Resonance in Medicine. 2003;49:506–514. doi: 10.1002/mrm.10394. [DOI] [PubMed] [Google Scholar]
- 41.Wong KK, Yang ES, Wu EX, Tse HF, Wong ST. First-pass myocardial perfusion image registration by maximization of normalized mutual information. Journal of Magnetic Resonance Imaging. 2008;27:529–537. doi: 10.1002/jmri.21254. [DOI] [PubMed] [Google Scholar]
- 42.Milles J, van der Geest RJ, Jerosch-Herold M, Reiber JH, Lelieveldt BP. Fully automated motion correction in first-pass myocardial perfusion MR image sequences. IEEE Trans Med Imaging. 2008;27:1611–21. doi: 10.1109/TMI.2008.928918. [DOI] [PubMed] [Google Scholar]
- 43.Delzescaux T, Frouin F, de Cesare A, et al. Using an adaptive semiautomated self-evaluated registration technique to analyze MRI data for myocardial perfusion assessment. J Magn Reson Imaging. 2003;18:681–90. doi: 10.1002/jmri.10414. [DOI] [PubMed] [Google Scholar]
- 44.Comte A, Lalande A, Aho S, Walker PM, Brunotte F. Realignment of myocardial first-pass MR perfusion images using an automatic detection of the heart-lung interface. Magn Reson Imaging. 2004;22:1001–9. doi: 10.1016/j.mri.2004.01.058. [DOI] [PubMed] [Google Scholar]
- 45.Yang GZ, Burger P, Panting J, et al. Motion and deformation tracking for short-axis echo-planar myocardial perfusion imaging. Med Image Anal. 1998;2:285–302. doi: 10.1016/s1361-8415(98)80024-8. [DOI] [PubMed] [Google Scholar]
- 46.Xue H, Zuehlsdorff S, Kellman P, et al. Unsupervised inline analysis of cardiac perfusion MRI. Medical Image Computing and Computer-Assisted Intervention (MICCAI): Lecture Notes in Computer Science. 2009:741–749. doi: 10.1007/978-3-642-04271-3_90. [DOI] [PubMed] [Google Scholar]
- 47.Hsu LY, Kellman P, Arai AE. Nonlinear myocardial signal intensity correction improves quantification of contrast-enhanced first-pass MR perfusion in humans. Journal of Magnetic Resonance Imaging. 2008;27:793–801. doi: 10.1002/jmri.21286. [DOI] [PubMed] [Google Scholar]
- 48.Germano G, Kavanagh PB, Slomka PJ, Van Kriekinge SD, Pollard G, Berman DS. Quantitation in gated perfusion SPECT imaging: the Cedars-Sinai approach. J Nucl Cardiol. 2007;14:433–54. doi: 10.1016/j.nuclcard.2007.06.008. [DOI] [PubMed] [Google Scholar]
- 49.Slomka PJ, Nishina H, Abidov A, et al. Combined quantitative supine-prone myocardial perfusion SPECT improves detection of coronary artery disease and normalcy rates in women. J Nucl Cardiol. 2007;14:44–52. doi: 10.1016/j.nuclcard.2006.10.021. [DOI] [PubMed] [Google Scholar]


