

Background: Cancer stem cells (CSC) are responsible for tumor resistance and relapse.
Results: Spheroids formed by CSC and neural stem cells (NSC) were compared by proteomics and functional studies. DCA, a glycolytic modulator, sensitizes CSC but not NSC to apoptosis.
Conclusion: DCA can eradicate glioma stem cells.
Significance: DCA could be a new efficient anti-CSC treatment in glioma.
Keywords: Apoptosis, Bcl-2 Proteins, Glioblastoma, Glycolysis, Stem Cells, Tumor Metabolism, Tumor Therapy
Abstract
Cancer stem cells (CSCs) are thought to be partially responsible for cancer resistance to current therapies and tumor recurrence. Dichloroacetate (DCA), a compound capable of shifting metabolism from glycolysis to glucose oxidation, via an inhibition of pyruvate dehydrogenase kinase was used. We show that DCA is able to shift the pyruvate metabolism in rat glioma CSCs but has no effect in rat neural stem cells. DCA forces CSCs into oxidative phosphorylation but does not trigger the production of reactive oxygen species and consecutive anti-cancer apoptosis. However, DCA, associated with etoposide or irradiation, induced a Bax-dependent apoptosis in CSCs in vitro and decreased their proliferation in vivo. The former phenomenon is related to DCA-induced Foxo3 and p53 expression, resulting in the overexpression of BH3-only proteins (Bad, Noxa, and Puma), which in turn facilitates Bax-dependent apoptosis. Our results demonstrate that a small drug available for clinical studies potentiates the induction of apoptosis in glioma CSCs.
Introduction
Mammalian cells generate ATP mainly through mitochondrial oxidative phosphorylation. However, cancer cells adopt an alternative metabolic pathway and increase their glycolytic activity through a process called the Warburg effect (1). The Warburg effect is necessary for cancer cells to resist oxidative stress and to adapt to hypoxic conditions (2). Thus, glycolysis could play an essential role in tumorigenesis during both the immortalization and transformation steps (3). It is still unknown and controversial whether or not the emergence of glycolysis in cancer is either (i) an early or late event or (ii) a genetically inherited dysfunction (essentially affecting mitochondria) or induced by metabolic modifications (mainly due to the hypoxic tumor environment) (4–6). Nonetheless, this metabolic transformation confers a selective growth advantage and/or resistance to apoptosis (7, 8) and thus might represent an important therapeutic target to be exploited (9, 10). The anti-cancer effects of modulators of glycolysis have been assessed in many different models (2). Dichloroacetate (DCA)2 is a small pharmacological inhibitor of pyruvate dehydrogenase kinase that promotes a shift in metabolism from glycolysis to oxidative phosphorylation (11). Bonnet et al. (12) have shown that DCA efficiently kills some cancer cells most likely because these cells are unable to produce ATP through mitochondria. Recently, the same group has shown that DCA induced apoptosis in glioblastoma multiforme (GBM) cells and thus could be beneficial to patients (13). Because gliomas are one of the most deadly malignant tumors with virtually no successful treatment (14), this discovery opens new promising therapeutic avenues. Michelakis et al. (13) have shown that DCA was also efficient against gliomas including a small population of tumor cells, called cancer stem cells (CSCs), which are highly resistant to cell death inducers and thus could be responsible for tumor recurrence (15). This is important because the eradication of CSCs represents a major therapeutic goal (15, 16). DCA has been shown to induce apoptosis in GBM CSCs but not in normal cells through a mechanism that remains elusive (13). Apoptosis is a complex process, which is often deregulated in cancer (17). Metabolism, and in particular oxidative phosphorylation, is essential for Bax and/or Bak activation (18, 19); the core pro-apoptotic proteins of the Bcl-2 family (20). In this report, we have studied the influence of DCA on the apoptotic pathway and in particular the Bax activation pathway. We used a rat model, which allowed the comparison of the effect of this compound on neurospheres enriched in CSCs and neural stem cells (NSCs).
EXPERIMENTAL PROCEDURES
Materials
Cell culture material was obtained from Invitrogen. Unless stated otherwise, all chemicals were purchased from Sigma. Antibodies used were the following: Bax (2772, Cell Signaling), pan-actin (MAB1501R, Chemicon), Bad (610391, BD), Bim (AB17002, Chemicon), Noxa (AP1316a, Tebu), Puma (AP1317a, Chemicon), Foxo3 (07–702, Millipore), Bax 6A7 (731731, BD), and p53 (Pab 122, 554167, BD Bioscience). ABT737 was purchased from Euromedex, France. Results shown are the mean values of at least three independent experiments (±S.D.) unless expressively mentioned. The images were quantified using ImageJ software. Statistical analyses were performed using the GraphPad software (Student unpaired t test, *, p < 0.05; **, p < 0.01).
Methods
Cell Culture
Glioma primary cultures (P7 and M7) were obtained from Sprague-Dawley rats following antenatal ENU induction as described in Pouliquen et al. (21). The enrichment of CSC was obtained by culturing the cells in defined medium (DMEM/Ham's F-12 containing 2 mm l-glutamine, 100 units/ml of penicillin, 100 μg/ml of streptomycin, N2- and B27-supplement, 20 ng/ml of EGF, 25 ng/ml of bFGF, and 2 μg/ml of heparin).
NSCs were obtained from E14 Sprague-Dawley rat embryos. Briefly, embryo brains were rinsed, freed from meninges, incubated with trypsin 0.25% for 15 min at 37 °C then with 10 μg/ml of DNase I for 10 min at 37 °C. Cells obtained were plated in complete medium (DMEM (glucose 1 g/liter) containing 10% fetal calf serum, 2 mm l-glutamine, 100 units/ml of penicillin, and 100 μg/ml of streptomycin) overnight at 37 °C. The nonadherent cells recuperated and were cultured in defined medium (DMEM containing 2 mm l-glutamine, 100 units/ml of penicillin, 100 μg/ml of streptomycin, N2- and B27-supplement, 20 ng/ml of EGF, 25 ng/ml of bFGF, and 2 μg/ml of heparin (supplemental Fig. S1)).
RT and Quantitative PCR
Cells were washed twice in PBS, then total RNA was isolated using the RNeasy MiniKit (Qiagen) following the manufacturer's instructions and DNase I treatment. After RNA quantification by NanoDrop (NanoDrop ND-1000, Thermo Fisher Scientific, Waltham, MA), 1 μg of RNA was reverse transcribed using Reverse Transcriptase AffinityScript (Agilent-Stratagene, Massy, France) for cDNA synthesis. Quantitative real-time PCR assays were performed and monitored in triplicate using a MX4000 multiplex quantitative PCR system (Agilent-Stratagene). The PCR contained 40 ng of cDNA in a reaction volume of 25 μl (1× Brilliant II SYBR Green Quantitative PCR master mix, 200 nm reverse and forward primers, and 30 nm SYBR Green). Thermocycling conditions were 95 °C for 10 min followed by 40 cycles at 95 °C for 30 s, 60 °C for 1 min, and 72 °C for 1 min. Gene expression values were normalized to the housekeeping gene (Ubiquitin) and relative expression values were calculated based on the comparative ΔΔCT method. The following primers were used: Foxo3: sense primer, 5′-GGGGAGTTTGGTCAATCAGA-3′; antisense primer, 5′-TTTGCATAGACTGGCTGACG-3′; p53: sense primer, 5′-CTGGACGACAGGCAGACTTT-3′, antisense primer, 5′-GCACAAACACGAACCTCAAA-3′; UBQ: sense primer, 5′-GAAACTAAGACACCTCCCCATCA-3′, antisense primer, 5′-TCGTACCTTTCTCACCACAGTATCTAG-3′; Bmi1: sense primer, 5′-GTGACTCTGGGAGCGACAAG-3′, antisense primer, 5′-CGAGGTCTACTGGCAAAGGA-3′; Nanog: sense primer, 5′-TGCGGACTGTGTTCTCTCAG-3′, antisense primer, 5′-CATTGGTTTTTCTGCCACCT-3′; Oct1: sense primer, 5′-ACTTCAGCCAAACCACCATC-3′,antisense primer, 5′-CTACGATTCAAGCCCTCAGC-3′; Nestin: sense primer, 5′-TCTGCTGGAGGCTGAGAACT-3′, antisense primer, 5′-GTATTAGGCAAGGGGGAAGG-3′; Sox2: sense primer, 5′-AGAACCCCAAGATGCACAAC-3′, antisense primer, 5′-CGGGAAGCGTGTACTTATCC-3′; and Msi1: sense primer, 5′-TCAGCCAAAGGAGGTGATGT-3′, antisense primer, 5′-CGGGGAACTGGTAGGTGTAA-3′.
Tumor Xenograft
5 × 10⁴ glioma cells grown in defined medium were injected subcutaneously into the flank of male nude mice. Mice were evaluated twice a week over a 3-week period. Tumor volume was measured with a caliper. Mice were treated with DCA (0.075 g/liter, drinking water) and/or etoposide (200 μg/mice, intraperitoneal injection, 5 of 7days ).
Two-dimensional DIGE Experiments
Cell pellets were resuspended in lysis buffer (7 m urea, 2 m thiourea, 4% CHAPS) and proteins were further precipitated using the Two-dimensional Clean-Up kit (Amersham Biosciences). Four biological replicates (50 μg) were used under each condition. Fluorescent CyDye labeling of proteins for DIGE was performed according to the manufacturer's instructions (GE Healthcare). Isoelectrofocusing was performed on 18-cm pI 3–11 NL Immobilin Dry strip gels (GE Healthcare) and SDS-PAGE were run using the Ettan DALTsix system (GE Healthcare). CyDye-labeled gels were scanned in an Ettan DIGE Imager (GE Healthcare). Gels images were processed using Progenesis SameSpots software (Nonlinear Dynamics Ltd.) for spot detection and statistical analysis. Spots considered for further analyses were chosen according to the following criteria: p > 0.05 (one-way analysis of variance test), fold-change >1.3, q < 0.05 and power >80% (False Discovery Rate approach). Spots were recovered using the Ettan Spot picker (GE Healthcare) and individually treated with the Proteoextract All-in-one Trypsin Digestion kit (Calbiochem) according to the manufacturer's instructions. Peptide digests were concentrated on C18-Zip Tips (Millipore) and eluted with 1.5 μl of α-cyano-4-hydroxycinnamic acid matrix solution (50% acetonitrile, 0.05% trifluoroacetic acid) onto a MALDI-TOF target plate (Opti-TOF 384 well Insert, Applied Biosystems). Peptide spectra acquisition was done on a 4800 MALDI TOF/TOF Analyzer (Applied Biosystems). After screening the sample position in MS-positive reflector mode using 1500 laser shots, the fragmentation of automatically selected precursors was performed at collision energy of 1 kV using air as the collision gas (pressure of 2 × 10⁻⁶ torr). MS spectra were acquired between m/z 800 and 4000. Up to 12 of the most intense ion signals having a S/N > 12 were selected as precursors for MS/MS acquisition. Peaklist generation and protein identification were performed with ProteinPilotTM Software version 2.0 (Applied Biosystems) using the Paragon algorithm. Each MS/MS spectrum was searched for all species against the Uniprot_Sprot_20080123 database. The searches were run using the fixed modification of iodoacetamide-labeled cysteine parameter enabled. Other parameters such as tryptic cleavage specificity, precursor ion mass accuracy, and fragment ion mass accuracy are MALDI 4800 built-in functions of ProteinPilot software. The ProteinPilot software calculates a confidence percentage (the unused score), which reflects the probability that the hit is a false positive, meaning that at 95% confidence level, there is a false positive identification chance of about 5%.
Protein Extraction and Immunoblotting
Total proteins were extracted in 1% Nonidet P-40, 0.5% sodium deoxycholate, 0.1% SDS supplemented with protease inhibitor mixture from Roche Diagnostics (Mannheim, Germany). Protein concentration was determined using the Bradford assay (Bio-Rad). Protein extracts were separated by SDS-PAGE, transferred onto PVDF membrane (Millipore), and revealed with ECL (Roche Diagnostics). Primary antibodies were used at 1:1000 dilution. HRP-conjugated secondary antibodies were from Bio-Rad. Quantification was performed with ImageJ software from at least three independent experiments.
Flow Cytometry
After treatment, the cells were dissociated, washed, and labeled. The level of 6A7 Bax was assessed by flow cytometry measuring the Fl1 fluorescence in a FACScalibur (BD Biosciences). Analyses were performed using the CellQuest software (BD Biosciences). A primary gate based on physical parameters (forward and side light scatter) was set to exclude dead cells or debris. The background level was estimated by omitting the primary antibody.
LDH Activity Measurement
Cells were plated at a density of 104 cells/100 μl in 96-well plates. The cells were lysed by the addition of 10 μl of lysis solution incubated at 37 °C for 45 min. 50 μl of supernatant was used to determine the LDH concentration according to the manufacturer's instructions (Promega, France).
Glucose-6-phosphate Dehydrogenase (Glu-6-PD) Activity
Cells were harvested and washed with PBS, then sonicated for 2 min in 100 μl of PBS and centrifuged for 15 min at 13,000 × g. Protein concentration was assessed using Bradford assay (Bio-Rad). Glc-6-PD activity was assessed in samples by spectrophotometric measurement of NADP+ reduction using a Roche/Hitachi 917 chemistry analyzer (substrate: 100 mm Tris, pH 7.8, 4 mm Mg2+, 1 mm NADP+).
MTT Assay
Cells were plated in 96-well plates at a density of 1.5 × 10⁴ cells per well and cultured in the presence of 2-deoxyglucose (25 or 35 mm), 3-bromopyruvate (20 or 40 mm), or antimycin A (1 or 3 μm) for 24 h. 10 μl of 5 mg/ml of 3-(4,5-dimethylthiazol-2-yl)-2,5-diphenyltetrazolium bromide was added per well and the plate was incubated at 37 °C for 3 h. 100 μl of dimethyl sulfoxide was added and the plate was read at 570 nm. The linearity between the number of viable cells and MTT assay in the experimental conditions used was verified by direct counting of cells after eosin staining.
ROS Measurement
Reactive Oxygen Species (ROS) were measured as previously described (22).
Respiratory Parameters in Intact Cells
Respiratory parameters were investigated in intact NSCs and P7 cells by polarography in 2-ml glass chambers using a two-channel, high-resolution Oxygraph respirometer (Oroboros, Innsbruck, Austria) as described previously (23). The routine respiration rate of intact cells (3–5 × 10⁶ cells at 37 °C in 2000 μl of DMEM) was determined by measuring the linear rate of oxygen consumption in intact cells. Then, oligomycin (8 μg/ml) was added, and the resting respiration, i.e. the nonphosphorylating respiration rate, was recorded. The maximal uncoupled respiration rate was then obtained using 0.5–10 μm uncoupler carbonyl cyanide 4-(trifluoromethoxy)phenylhydrazone. Finally, respiration was inhibited by addition of 3 μm antimycin.
Mitochondrial Enzymatic Activity Measurements
The activity of citrate synthase and cytochrome c oxidase was determined as described previously (24).
Caspase Assay
DEVDase activity was measured as previously described (25).
Immunostaining
For immunostaining, neurospheres were dissociated and 50 μl of cell suspension were adhered to Superfrost slides. Cells were fixed with 4% paraformaldehyde for 20 min, permeabilized with 0.1% SDS for 10 min, blocked with 3% BSA for 20 min, and then incubated with antibodies against Foxo3 or p53 for 1 h followed by secondary Alexa antibodies (Invitrogen) for 1 h. Cells were mounted in Prolong Gold plus DAPI (Invitrogen) to stain nuclei. The labeling was acquired using a Zeiss microscope adapted with an Apotome camera (Zeiss Axiovert 200M inverted microscope and AxioVision 4.6 program). Colocalization of Foxo3 or p53 with DAPI was measured in an average of 10 cells per field using Metamorph software (version 7.6.5.0). The acquisition of imaging data were done at the Cellular and Tissular Imaging Core Facility of Nantes University (MicroPICell).
RESULTS
Characterization of Rat Neural and Cancer Stem Cell Spheres
Under our culture conditions (see ”Experimental Procedures“), some isolated cancer cells grew as floating spheroids morphologically comparable with the neurospheres formed by rat NSCs, although with a less ordered structure (Fig. 1A). The rat glioma cancer cells were able to form serial neurospheres and limiting dilution assays (LDA) (26, 27) indicated that the percentage of stem cells in the different cancer cell populations ranged from 2.9 to 3.9 (4.6% for M7, 3.9% in P7, both glioma primary cultures, and 2.9% in the C6 cell line). A percentage that was comparable although slightly inferior to that found in NSCs (i.e. 9.1%) (Fig. 1B).
FIGURE 1.

Characterization of the cancer spheroid cell model. A, morphology of normal neural neurospheres (NSC, left) and glioma spheroids (GBM CSC, right) cultured in defined medium. B, LDA illustrating the neurosphere-forming capacity of NSCs and glioma cancer cells (M7, P7, and C6) (see ”Experimental Procedures“). The graph is representative of three independent assays. C, mRNA expression of immature cell markers in normal and cancer cells under stem cell permissive conditions, normalized to the corresponding expression in adherent cells. D, mRNA expression of Msi1 in normal and cancer cells in spheroids compared with adherent cells. No expression could be detected in adherent cells. E, tumorigenic potency of cancer cells (P7) grown either as adherent cells or under stem cell permissive conditions. 5 × 10³ adherent cells were injected into the right flank of 3 nude mice, the contra-lateral flank receiving 5 × 10³ cells grown as neurospheres.
We also verified that glioma-derived spheroids expressed stem cell markers (nanog, oct-1, nestin, sox-2, Msi1, and the self-renewal marker Bmi1) (Fig. 1, C and D) often overexpressed in human CSCs (28). In addition, injection of P7 neurospheres drastically increased the cancer cells tumorigenicity compared with that of adherent cells (Fig. 1E). Of note, the same observation was made with M7 neurospheres (data not shown). Thus, the spheroids obtained from ENU-induced rat gliomas exhibited characteristics of CSCs.
A two-dimensional DIGE and MS/MS proteomic comparison between NSCs and glioma spheroids (see ”Experimental Procedures“) allowed the identification of 132 differential spots among which, 44 distinct proteins were characterized. Using the Ingenuity Pathways Knowledge Base, significant networks, functions, and canonical pathways associated emerged from these differentially expressed proteins. As shown in Fig. 2A and Table 1, glycolysis and pyruvate metabolism were significantly different between CSCs and NSCs. Lactate dehydrogenase and glucose-6-phosphate dehydrogenase activities confirmed that glioma CSCs essentially metabolized glucose through a nonoxidative pathway (Fig. 2B). We also measured the expression of the glucose transporter Glut-1 and found that it was up-regulated in glioma CSCs as compared with NSCs (Fig. 2C). This up-regulation was consistent with the fact that rat glioma CSCs were completely dependent on glucose for their growth in vitro (Fig. 2D), whereas NSCs were capable to use alternative substrates, even if their proliferation rate was lower than that of CSCs. Finally, as expected, glucose replacement by galactose, supplemented or not with pyruvate, could not support CSCs growth in vitro (Fig. 2D). To further confirm the glycolytic CSCs metabolism, we inhibited the mitochondrial oxidative pathway using antimycin A, and as expected, this specifically inhibited NSCs growth under normoxia although having no effect on CSCs proliferation (supplemental Fig. S2).
FIGURE 2.

Metabolic comparison of neural and glioma neurospheres. A, functional analysis of the different proteins identified by two-dimensional DIGE analyses was performed using the Ingenuity Pathways Knowledge Base. B, the LDH and G6PD enzymatic activities were measured in the three glioma spheroid cultures and normalized to the activity measured in NSCs (*, p < 0.05). C, expression of the GLUT-1 transporter was measured by quantitative PCR in three glioma CSCs and normalized to the expression measured in NSCs (*, p < 0.05; **, p < 0.01). D, cell number kinetics was assessed in NSCs or glioma spheroids grown in the presence of the indicated carbohydrate substrates. Cell counting was done every other day and culture medium was renewed on day 4.
TABLE 1.
Canonical pathways
Differential proteins identified were uploaded to the Ingenuity Pathways Knowledge Base and subjected to canonical pathways analysis. The top canonical pathways are shown with the corresponding proteins indicated. Proteins indicated in bold are up-regulated in glioma spheroids.
| Ingenuity canonical pathways | p value | Proteins |
|---|---|---|
| Glycolysis/gluconeogenesis | 7,94E-11 | PKM2, PGK1, ENO1, ENO3, GAPDH, LDHA, LDHB, ALDOC |
| Pyruvate metabolism | 3,47E-05 | PKM2, MDH1, LDHA, LDHB |
| Phenylalanine, tyrosine, and tryptophan biosynthesis | 1,00E-03 | ENO1, ENO3 |
| Actin cytoskeleton signaling | 2,82E-03 | ACTB, GSN, ACTG1, MSN |
| Pentose phosphate pathway | 3,55E-03 | TKT, ALDOC |
Effect on DCA on Glioma and Neural Neurospheres
Recent results have suggested that DCA shifted the metabolism of pyruvate from glycolysis toward oxidation in the mitochondria through pyruvate dehydrogenase kinase inhibition and have powerful anti-cancer activities (12, 13). This has been particularly illustrated in the case of human gliomas. Spheres were treated with DCA (1 mm), which provoked an increase in the maximal uncoupled respiration rate (i.e. compared with O2 consumption in the presence of carbonyl cyanide 4-(trifluoromethoxy)phenylhydrazone in CSCs but not in NSCs (Fig. 3A). Of note, this increase could be attributed neither to an increase in the amount of mitochondria (as illustrated by the citrate synthase activity measurement) nor to an increase in the mitochondrial complexes activity (as illustrated by the COX IV activity measurement) (supplemental Fig. S3). DCA has been reported to induce a sharp increase in ROS in human gliomas (12). We did not observe any modification in ROS production in rat CSCs (Fig. 3B); nevertheless, under these conditions, DCA decreased the activity of LDH in CSCs but not in NSCs (Fig. 3C), indicating nonetheless a metabolic shift in CSCs. We conclude that the neurospheres obtained from the rat glioma provided an excellent model to analyze and compare the effect of DCA in rat NSCs and glioma CSCs.
FIGURE 3.

Effect of DCA on NSC and CSC metabolism. A, oxygraph analyses of NSCs and P7CSC treated or not with DCA (1 mm, 48 h). Respiratory parameters were investigated in intact cells as described previously (23). The respiration rate was normalized to the quantity of protein in each experiment. Data are the mean ± S.D. of 3 independent experiments (**, p < 0.01). B, NSC, C6CSC, and P7CSC were cultured in defined medium with or without DCA (1 mm, 48 h) and the production of ROS was assessed using a fluorescent dye (H2DCF-DA), as previously described (22). C, cells were treated by DCA (1 mm, 48 h), then LDH activity was measured as described under “Experimental Procedures.” D, DCA (1 mm) or 2-DG (25 mm) was added to P7CSC and NSCs and LDA experiments were done on days 4, 6, 8, 10, and 12 for P7CSC and on days 6 and 12 for NSCs. The kinetics of the content of stem cells in the population is shown on the graph. FCCP, carbonyl cyanide 4-(trifluoromethoxy)phenylhydrazone.
Next, we tested the effect of DCA on the ability of rat NSCs and CSCs to generate neurospheres. LDA and experimental estimation of the stem-like cell number in the population (28) showed that DCA gradually reduced the CSC ability to form spheroids, whereas that of NSCs were unaffected (Fig. 3D and supplemental Fig. S4). However, this phenomenon could not be uniquely attributed to the inhibition of glycolysis as a treatment with 2-DG affected both CSC and NSC neurosphere formation (Fig. 3D and supplemental Fig. S4).
DCA Decreased the Resistance to Apoptosis in CSCs Treated with Etoposide or Irradiation
CSCs are known to be resistant to etoposide- or irradiation-induced apoptosis (29). To assess the effect of DCA on apoptosis, neural and glioma spheroids were treated with increasing concentrations of DCA over 48 h and cell viability was monitored as described under ”Experimental Procedures.“ As shown in Fig. 4A, little or no effect of DCA on cell viability and proliferation was observed under these conditions even at the highest concentration (i.e. 1 mm), including when a prolonged treatment induced a decrease in CSC sphere proliferation (supplemental Fig. S5). Next, NSC- and CSC-enriched spheres were treated with etoposide (50 μm for 12 h) or irradiated (5 gray); these conditions alone did not affect their survival (Fig. 4B). However, a DCA pretreatment drastically increased the number of dead cells in cancer spheroids (Fig. 4B). Caspase activity (i.e. DEVDase) was measured under these different conditions and the combined treatments DCA/etoposide or DCA/irradiation were more apoptogenic than the single regimen (Fig. 4C). Of note, similar results were obtained with CSCs obtained from human glioblastoma multiforme (supplemental Fig. S6).
FIGURE 4.

DCA decreases the resistance to apoptosis in CSCs treated with etoposide or irradiation. A, NSCs, C6CSC, and P7CSC were cultured with increasing concentrations of DCA (0.25, 0.5, or 1 mm) for 48 h. Cell viability was assessed by MTT. The linearity between the number of viable cells and MTT assay was verified by direct counting of the cells after eosin staining. B, NSCs, C6CSC, and P7CSC were treated by DCA (1 mm) and then γ-irradiated (5 gray) (irr) or treated with etoposide (50 μm) (eto). The viability was assessed by MTT as in A. C, DEVDase activity was measured in the cell lysates obtained in B as previously described (25).
DCA Induced a Bax-dependent Apoptosis
To verify the implication of Bax in the above observed cell death, the expression of Bax was targeted using small hairpin RNA (supplemental Fig. S7). C6CSC and P7CSC were treated with two shRNAs targeting Bax (shBax1 and shBax2) and a control scramble shRNA. Both shBax efficiently inhibited the expression of Bax (supplemental Fig. S7). These cells were treated as previously described with DCA and etoposide or irradiation. As illustrated in Fig. 5, A and B, the knockdown of Bax expression abolished both cell death and caspase activation.
FIGURE 5.

DCA induced a Bax-dependent apoptosis. A, C6CSC and P7CSC were transfected with shRNA targeting Bax (Bax1 and Bax2) or with scramble shRNA. Cells were co-treated with DCA ± etoposide (A) or DCA ± irradiation (B). Cell death and DEVDase activity were measured as described in the legend to Fig. 4. C, relative Bad, Bim, Puma, and Noxa expression levels was determined by immunoblot in NSCs, C6CSC, and P7CSC treated or not with DCA (1 mm, 48 h). Protein expression was normalized to actin. D, NSCs, C6CSC, and P7CSC were treated with DCA (1 mm) for 24 h, then ABT-737 (1 μm) for an additional 24 h. The viability was assessed by MTT as in A.
To understand how DCA could alter Bax-dependent apoptosis in CSCs, the expression of some BH3-only proteins (Bad, Bim-EL, Noxa, and Puma), shown to be induced by glycolytic inhibitors, was measured. The data in Fig. 5C show that the expression of Bad, Noxa, and Puma were increased in DCA-treated CSCs compared with untreated cells, whereas that of Bim was unaffected. Proteins of the Bcl-2 family are essential partners of apoptosis. ABT-737 is a drug, which has been demonstrated to efficiently inhibit the anti-apoptotic members of this family, such as Bcl-2 or Bcl-Xl (30), and has demonstrated promising effects in different cancer cells (30). As shown in Fig. 5D ABT-737 alone had a small effect on CSCs and NSCs survival but its combination with DCA augmented cell death in CSCs but not in NSCs. This result suggests that proteins of the Bcl-2 family are involved in DCA-enhanced apoptosis in CSCs. Taken together, our results suggest that DCA was able to increase the expression of some BH3-only proteins in CSCs, but not sufficiently to activate Bax. This effect appears to be specific because 2-DG did not increase the expression of Bad, Puma, and Noxa in these cells (supplemental Fig. S8).
DCA Up-regulates p53 and Foxo3 Expression
Foxo3 and p53 are known to be transcription factors for Noxa, Puma, Bim, and Bad (31–33). To assess if these proteins were implicated in the DCA pathway, we analyzed by quantitative PCR their expression. As shown in Fig. 6A, an increase in the expression of these two transcription factors was observed upon treatment with DCA in CSCs but not in NSCs. For p53, the expression increased 24- (C6CSC) and 10-fold (P7CSC), whereas that of Foxo3 increased 4- (C6CSC) and 31-fold (P7CSC). This up-regulation was confirmed by Western blot analyses (Fig. 6B). The cellular localization of these transcription factors is essential for their pro-apoptotic functions. As shown in Fig. 6C, Foxo3 localization, assessed by immunostaining, was modified in DCA-treated P7CSC compared with untreated cells because Foxo3 translocated into the nucleus. On the other hand, no modification in Foxo3 localization was observed in DCA-treated NSCs (44% ± 3.8 versus 42% ± 9.5). The percentage of nuclear Foxo3 upon DCA treatment was increased from 33 ± 3 to 53 ± 5%. Fig. 6C showed a similar modification in p53 localization in DCA-treated CSCs where the percentage of p53 in the nucleus increased from 27 ± 4 to 42 ± 2%. These results suggest that DCA may increase the transcriptional activity of p53 and Foxo3, thereby facilitating their pro-apoptotic activities.
FIGURE 6.

Increase in p53 and Foxo3 expression after DCA treatment. A, relative Foxo3 and p53 mRNA expression levels were determined by quantitative RT-PCR in NSCs, C6CSC, and P7CSC treated or not with DCA (1 mm, 48 h). Gene expression values were normalized to housekeeping gene (Ubiquitin) and relative expression values were calculated based on the corresponding control cultures. B, NSCs or glioma spheroids were treated with DCA (1 mm, 48 h), then p53 and Foxo3a expression were analyzed by Western blot in total cell lysates. Actin was used as a loading control. The blot shown is representative of three experiments. C, immunostaining of Foxo3 (green) and p53 (red) was done on NSCs and P7CSC with or without DCA (1 mm, 48 h). The percentages indicated represent the mean ± S.D. colocalization of the labeled proteins in nucleus labeled with DAPI.
To investigate the role of apoptosis and p53 in the cell death process, we used Pifithrin-α, a chemical inhibitor of p53 (34) and analyzed its effect on DCA/etoposide treatment. As expected, Pifithrin-α inhibited DCA/etoposide-induced apoptosis but also affected the formation of neurospheres in LDA (supplemental Fig. S9, A and B). Similarly, a knockdown in the expression of Foxo3 by siRNA rendered CSCs resistant to DCA-induced apoptosis (supplemental Fig. S9C).
Effect of DCA on Tumor Growth in Vivo
To study the effect of DCA in vivo, 5 × 10⁴ P7CSC cells were injected into the flanks of nude mice and the animals were treated or not with DCA (diluted in the drinking water) and/or intra-peritoneal etoposide injections. Tumor size was measured twice a week for 1 month. As shown in Fig. 7, P7CSC tumor growth was rapid in mice treated or not with etoposide (681 mm3 ± 70.6 versus 653 mm3 ± 79.1 in 40 days) whereas, tumor growth decreased in mice treated with DCA (322 mm3 ± 54.8) and even more when the mice were treated with DCA plus etoposide (67 mm3 ± 11.2). Similar results were obtained when tumors were injected intracranially (data not shown).
FIGURE 7.
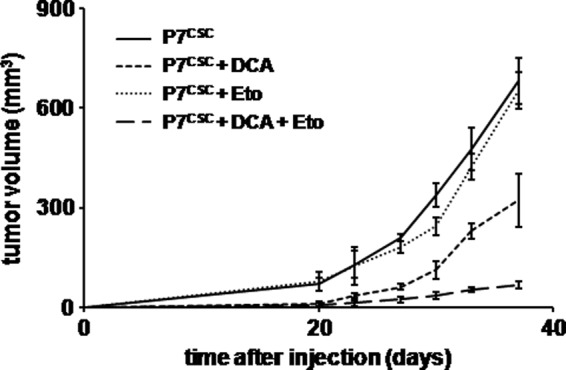
Effect of DCA on CSC in vivo. 5 × 10⁴ P7CSC cells were injected subcutaneously into male nude mice (n = 10 per arm). Mice were treated with DCA (0.075 g/liter, drinking water) and/or etoposide (200 μg/mouse, intra-peritoneal injection, 5 days of 7) over 40 days. Mice were evaluated twice a week and tumor volume was measured with a caliper. The graph represents the mean tumor size in each group ± S.D.
DISCUSSION
Rat glioma models recapitulate several of the human GBM histopathological features and are reproducible and easily available (35). We have recently reported that the ENU-induced rat glioma model was an excellent model to monitor tumor growth and establish new therapeutic strategies (21, 36). Here, we show that this model allows a direct comparison between rat normal and cancer cells that could be relevant to the human pathology.
The CSC theory postulates that cells that harbor the primitive oncogenic mutations are rare, long-lived and slow-dividing and thus, evade most anti-cancer therapies. These cells are able to give rise to cells with distinct phenotypes if the right stimulus is provided. In gliomas, the most common adult brain tumors, CSCs have been involved in tumor resistance to treatment because these cells are highly radio- and chemoresistant (29). Due to the “stemness properties” of these cells, it has been postulated that CSCs could arise from pathological stem cells or dedifferentiated progenitors. This contention has been strengthened by the fact that current markers of glioma CSCs are similar to that of NSCs and because, like the normal counterpart, they are able to form neurospheres in vitro. In addition, tumor stem cells grown under sphere forming conditions are a more reliable model for primary tumors than the classical conditions in the presence of serum (37).
In this work, we have performed a comparative study between NSC and CSC neurospheres obtained from normal rat brain and chemo-induced brain tumors, respectively (Fig. 1). We found that cells derived from these tumors or the established rat glioma cell line C6 exhibited different amounts of neurosphere-forming cells, which are otherwise highly tumorigenic cells (Fig. 1). Compared with cells grown in the presence of serum, the neurospheres formed by CSCs expressed several stem cell markers (i.e. Oct-1, nanog, Bmi-1, and nestin) in comparable amounts to that found in NSCs (Fig. 1). However, CSC neurospheres expressed less Sox2 and more Msi1 than the NSC neurospheres (Fig. 1). Consistent with the highly tumorigenic properties of CSCs, spheres formed highly proliferative tumors in animals compared with serum-cultured cells (Fig. 1).
Having established that spheres formed from rat brain tumors had CSC properties, we then compared these cells to NSCs using a two-dimensional DIGE and mass spectrometry-based strategy. We identified 20 proteins that had an altered expression in normal versus cancer neurospheres (Table 1). This analysis revealed that the main differences between NSCs and CSCs were associated with the glycolytic pathway and this was confirmed by both analytic and functional studies (Fig. 2). This phenomenon has been long known in rapidly dividing cancer cells as the Warburg effect (1). Of note, astrocytes have been shown to rely more on glycolysis than neurons, a feature that could facilitate their transition toward malignant stages (38). The observation that the glycolytic pathway was overstimulated in CSCs compared with NSCs prompted us to analyze the response of these cells to glucose deprivation and/or to the inhibition of glycolysis. We show that DCA, a pharmacological modulator of glucose metabolism (12), induced apoptosis, in combination with DNA damaging agents, in CSCs but did not harm cognate normal stem cells. Interestingly, Michelakis et al. (13) have shown that CD133+ human glioblastoma multiforme cells (i.e. putative CSCs) were also sensitive to DCA but no molecular mechanism of action of this drug was reported. We found that DCA could rapidly deplete the neurosphere-forming population and reduce tumor growth in vivo (Figs. 3 and 7). The effect of DCA was specific for CSCs, as the glycolytic metabolism and ability to form neurospheres of NSCs were unaffected by DCA, contrary to the results obtained with the classical inhibitor of glycolysis, 2-DG (Fig. 3). Bonnet et al. (12) have shown that DCA induced the production of ROS, however, this does not appear to be the case in CSCs (Fig. 3).
We further investigate the effect of DCA on CSCs and found that it induced a rapid and efficient cell death in CSCs only in the presence of an additional apoptotic stimulus (Fig. 4). This cell death was Bax-dependent. In addition, DCA induced the expression of Bad, Noxa, and Puma, contrary to that observed with 2-DG (Fig. 5 and supplemental Fig. S7). Of note, ABT-737, an antagonist of Bcl-2 and Bcl-Xl but not of Mcl-1, enhanced DCA-induced apoptosis (Fig. 5). Also consistent with these results, DCA induced the expression of known transcription factors of these BH3-only proteins, namely Foxo3a and p53 (Fig. 6). Glycolysis affects the Bcl-2 family, especially the BH3-only proteins such as Bad and Puma (39–42). Recently it has been shown that 2-DG efficiently eliminated cancer cells in combination with ABT-737, through the Mcl-1/Bak axis (43, 44). This implies that 2-DG and DCA sensitizes toward apoptosis via different routes. The specific ability of DCA to deplete the neurosphere-forming population in rat glioma CSCs might be related to the induction of p53. It was shown that p53 inhibited the renewal of stem/progenitor cells in NSCs and glioma CSCs (45). The specific induction of p53 in CSCs might explain the divergent effect on the sphere-forming ability induced by DCA on NSCs and CSCs. Of note, p53 inhibition rescinded the sensitization of CSCs to apoptosis; p53 inhibition also delayed the CSCs depletion induced by DCA, however, long term p53 inhibition by itself induced a decrease in CSCs in the population (supplemental Fig. S9). The mechanism explaining this depletion will be the aim of further investigations.
Our results suggest that the dependence on glycolysis may occur early during tumorigenesis because it is already present in CSCs. Thus, the Warburg effect is likely to be a major event during tumorigenesis, not as a symptom but as one of its primary causes. Taken together, our results provide the rationale for the association of DCA and conventional treatments to eradicate CSCs and thus to prevent tumor relapse while preserving NSCs. Because, recent results have shown that DCA was active against several other types of cancer (see for example, Ref. 46), including undifferentiating neuroblastoma (47), it would be interesting to investigate whether CSCs are also a preferential target in tumors of different origins.
Supplementary Material
This work was supported in part by grants from INSERM, Cancéropôle Grand Ouest, and a special grant from the Ligue Nationale contre le Cancer (Programme Equipe Labelisée).

This article contains supplemental Figs. S1–S9 and Table S1.
- DCA
- dichloroacetate
- CSCs
- cancer stem cells
- LDH
- lactate dehydrogenase
- NSC
- neural stem cell
- ROS
- reactive oxygen species
- 2-DG
- 2 deoxyglucose
- MTT
- 3-(4,5-dimethylthiazol-2-yl)-2,5-diphenyltetrazolium bromide
- LDA
- Limiting dilution assay
- Glc-6-PD
- glucose-6-phosphate dehydrogenase
- DIGE
- differential gel electrophoresis.
REFERENCES
- 1. Warburg O. (1956) On the origin of cancer cells. Science 123, 309–314 [DOI] [PubMed] [Google Scholar]
- 2. Vander Heiden M. G., Cantley L. C., Thompson C. B. (2009) Understanding the Warburg effect. The metabolic requirements of cell proliferation. Science 324, 1029–1033 [DOI] [PMC free article] [PubMed] [Google Scholar]
- 3. Kondoh H. (2008) Cellular lifespan and the Warburg effect. Exp. Cell Res. 314, 1923–1928 [DOI] [PubMed] [Google Scholar]
- 4. Zanssen S., Schon E. A. (2005) Mitochondrial DNA mutations in cancer. PLoS Med. 2, e401. [DOI] [PMC free article] [PubMed] [Google Scholar]
- 5. Brandon M., Baldi P., Wallace D. C. (2006) Mitochondrial mutations in cancer. Oncogene 25, 4647–4662 [DOI] [PubMed] [Google Scholar]
- 6. Zhou S., Kachhap S., Sun W., Wu G., Chuang A., Poeta L., Grumbine L., Mithani S. K., Chatterjee A., Koch W., Westra W. H., Maitra A., Glazer C., Carducci M., Sidransky D., McFate T., Verma A., Califano J. A. (2007) Frequency and phenotypic implications of mitochondrial DNA mutations in human squamous cell cancers of the head and neck. Proc. Natl. Acad. Sci. U.S.A. 104, 7540–7545 [DOI] [PMC free article] [PubMed] [Google Scholar]
- 7. Sun W., Zhou S., Chang S. S., McFate T., Verma A., Califano J. A. (2009) Mitochondrial mutations contribute to HIF1α accumulation via increased reactive oxygen species and up-regulated pyruvate dehydrogenase kinase 2 in head and neck squamous cell carcinoma. Clin. Cancer Res. 15, 476–484 [DOI] [PMC free article] [PubMed] [Google Scholar]
- 8. Mason E. F., Rathmell J. C. (2011) Cell metabolism. An essential link between cell growth and apoptosis. Biochim. Biophys. Acta 1813, 645–654 [DOI] [PMC free article] [PubMed] [Google Scholar]
- 9. Hsu P. P., Sabatini D. M. (2008) Cancer cell metabolism. Warburg and beyond. Cell. 134, 703–707 [DOI] [PubMed] [Google Scholar]
- 10. Tennant D. A., Durán R. V., Gottlieb E. (2010) Targeting metabolic transformation for cancer therapy. Nat. Rev. Cancer 10, 267–277 [DOI] [PubMed] [Google Scholar]
- 11. Stacpoole P. W., Nagaraja N. V., Hutson A. D. (2003) Efficacy of dichloroacetate as a lactate-lowering drug. J. Clin. Pharmacol. 43, 683–691 [PubMed] [Google Scholar]
- 12. Bonnet S., Archer S. L., Allalunis-Turner J., Haromy A., Beaulieu C., Thompson R., Lee C. T., Lopaschuk G. D., Puttagunta L., Bonnet S., Harry G., Hashimoto K., Porter C. J., Andrade M. A., Thebaud B., Michelakis E. D. (2007) A mitochondria-K+ channel axis is suppressed in cancer and its normalization promotes apoptosis and inhibits cancer growth. Cancer Cell 11, 37–51 [DOI] [PubMed] [Google Scholar]
- 13. Michelakis E. D., Sutendra G., Dromparis P., Webster L., Haromy A., Niven E., Maguire C., Gammer T. L., Mackey J. R., Fulton D., Abdulkarim B., McMurtry M. S., Petruk K. C. (2010) Metabolic modulation of glioblastoma with dichloroacetate. Sci. Transl. Med. 2, 31ra34. [DOI] [PubMed] [Google Scholar]
- 14. Huse J. T., Holland E. C. (2010) Targeting brain cancer. Advances in the molecular pathology of malignant glioma and medulloblastoma. Nat. Rev. Cancer 10, 319–331 [DOI] [PubMed] [Google Scholar]
- 15. Park D. M., Rich J. N. (2009) Biology of glioma cancer stem cells. Mol. Cells 28, 7–12 [DOI] [PubMed] [Google Scholar]
- 16. Singh A., Settleman J. (2010) EMT, cancer stem cells and drug resistance. An emerging axis of evil in the war on cancer. Oncogene. 29, 4741–4751 [DOI] [PMC free article] [PubMed] [Google Scholar]
- 17. Yip K. W., Reed J. C. (2008) Bcl-2 family proteins and cancer. Oncogene 27, 6398–6406 [DOI] [PubMed] [Google Scholar]
- 18. Tomiyama A., Serizawa S., Tachibana K., Sakurada K., Samejima H., Kuchino Y., Kitanaka C. (2006) Critical role for mitochondrial oxidative phosphorylation in the activation of tumor suppressors Bax and Bak. J. Natl. Cancer Inst. 98, 1462–1473 [DOI] [PubMed] [Google Scholar]
- 19. Rathmell J. C., Fox C. J., Plas D. R., Hammerman P. S., Cinalli R. M., Thompson C. B. (2003) Akt-directed glucose metabolism can prevent Bax conformation change and promote growth factor-independent survival. Mol. Cell. Biol. 23, 7315–7328 [DOI] [PMC free article] [PubMed] [Google Scholar]
- 20. Chipuk J. E., Moldoveanu T., Llambi F., Parsons M. J., Green D. R. (2010) The BCL-2 family reunion. Mol. Cell. 37, 299–310 [DOI] [PMC free article] [PubMed] [Google Scholar]
- 21. Pouliquen D., Olivier C., Hervouet E., Pedelaborde F., Debien E., Le Cabellec M. T., Gratas C., Homma T., Meflah K., Vallette F. M., Menanteau J. (2008) Dietary prevention of malignant glioma aggressiveness, implications in oxidant stress and apoptosis. Int. J. Cancer. 123, 288–295 [DOI] [PubMed] [Google Scholar]
- 22. Hervouet E., Debien E., Campion L., Charbord J., Menanteau J., Vallette F. M., Cartron P. F. (2009) Folate supplementation limits the aggressiveness of glioma via the remethylation of DNA repeats element and genes governing apoptosis and proliferation. Clin. Cancer Res. 15, 3519–3529 [DOI] [PubMed] [Google Scholar]
- 23. Loiseau D., Chevrollier A., Verny C., Guillet V., Gueguen N., Pou de Crescenzo M. A., Ferré M., Malinge M. C., Guichet A., Nicolas G., Amati-Bonneau P., Malthièry Y., Bonneau D., Reynier P. (2007) Mitochondrial coupling defect in Charcot-Marie-Tooth type 2A disease. Ann. Neurol. 61, 315–323 [DOI] [PubMed] [Google Scholar]
- 24. Desquiret-Dumas V., Gueguen N., Barth M., Chevrollier A., Hancock S., Wallace D. C., Amati-Bonneau P., Henrion D., Bonneau D., Reynier P., Procaccio V. (2012) Metabolically induced heteroplasmy shifting and l-arginine treatment reduce the energetic defect in a neuronal-like model of MELAS. Biochim. Biophys. Acta 1822, 1019–1029 [DOI] [PMC free article] [PubMed] [Google Scholar]
- 25. Cartron P. F., Juin P., Oliver L., Martin S., Meflah K., Vallette F. M. (2003) Nonredundant role of Bax and Bak in Bid-mediated apoptosis. Mol. Cell. Biol. 23, 4701–4712 [DOI] [PMC free article] [PubMed] [Google Scholar]
- 26. Das A. V., James J., Zhao X., Rahnenführer J., Ahmad I. (2004) Identification of c-Kit receptor as a regulator of adult neural stem cells in the mammalian eye. Interactions with Notch signaling. Dev. Biol. 273, 87–105 [DOI] [PubMed] [Google Scholar]
- 27. Srivastava V. K., Nalbantoglu J. (2008) Flow cytometric characterization of the DAOY medulloblastoma cell line for the cancer stem-like phenotype. Cytometry A 73, 940–948 [DOI] [PubMed] [Google Scholar]
- 28. Huang Z., Cheng L., Guryanova O. A., Wu Q., Bao S. (2010) Cancer stem cells in glioblastoma. Molecular signaling and therapeutic targeting. Protein Cell 1, 638–655 [DOI] [PMC free article] [PubMed] [Google Scholar]
- 29. Eramo A., Ricci-Vitiani L., Zeuner A., Pallini R., Lotti F., Sette G., Pilozzi E., Larocca L. M., Peschle C., De Maria R. (2006) Chemotherapy resistance of glioblastoma stem cells. Cell Death Differ. 13, 1238–1241 [DOI] [PubMed] [Google Scholar]
- 30. Chonghaile T. N., Letai A. (2008) Mimicking the BH3 domain to kill cancer cells. Oncogene 27, S149–157 [DOI] [PMC free article] [PubMed] [Google Scholar]
- 31. Gilley J., Coffer P. J., Ham J. (2003) FOXO transcription factors directly activate bim gene expression and promote apoptosis in sympathetic neurons. J. Cell Biol. 162, 613–622 [DOI] [PMC free article] [PubMed] [Google Scholar]
- 32. Schuler M., Green D. R. (2001) Mechanisms of p53-dependent apoptosis. Biochem. Soc. Trans. 29, 684–688 [DOI] [PubMed] [Google Scholar]
- 33. Möller C., Alfredsson J., Engström M., Wootz H., Xiang Z., Lennartsson J., Jönsson J. I., Nilsson G. (2005) Stem cell factor promotes mast cell survival via inactivation of FOXO3a-mediated transcriptional induction and MEK-regulated phosphorylation of the proapoptotic protein Bim. Blood 106, 1330–1336 [DOI] [PubMed] [Google Scholar]
- 34. Komarov P. G., Komarova E. A., Kondratov R. V., Christov-Tselkov K., Coon J. S., Chernov M. V., Gudkov A. V. (1999) A chemical inhibitor of p53 that protects mice from the side effects of cancer therapy. Science 285, 1733–1737 [DOI] [PubMed] [Google Scholar]
- 35. Barth R. F., Kaur B. (2009) Rat brain tumor models in experimental neuro-oncology: the C6, 9L, T9, RG2, F98, BT4C and CNS-1 gliomas. J. Neurooncol. 94, 295–312 [DOI] [PMC free article] [PubMed] [Google Scholar]
- 36. Cartron P. F., Hervouet E., Debien E., Olivier C., Pouliquen D., Menanteau J., Loussouarn D., A Martin S., Campone M., Vallette F. M. (2012) Eur. J. Cancer, in press [DOI] [PubMed] [Google Scholar]
- 37. Lee J., Kotliarova S., Kotliarov Y., Li A., Su Q., Donin N. M., Pastorino S., Purow B. W., Christopher N., Zhang W., Park J. K., Fine H. A. (2006) Tumor stem cells derived from glioblastomas cultured in bFGF and EGF more closely mirror the phenotype and genotype of primary tumors than do serum-cultured cell lines. Cancer Cell 9, 391–403 [DOI] [PubMed] [Google Scholar]
- 38. Turner D. A., Adamson D. C. (2011) Neuronal-astrocyte metabolic interactions. Understanding the transition into abnormal astrocytoma metabolism. J. Neuropathol. Exp. Neurol. 70, 167–176 [DOI] [PMC free article] [PubMed] [Google Scholar]
- 39. Zhao Y., Coloff J. L., Ferguson E. C., Jacobs S. R., Cui K., Rathmell J. C. (2008) Glucose metabolism attenuates p53 and Puma-dependent cell death upon growth factor deprivation. J. Biol. Chem. 283, 36344–36353 [DOI] [PMC free article] [PubMed] [Google Scholar]
- 40. Danial N. N. (2008) BAD. Undertaker by night, candyman by day. Oncogene 27, S53–70 [DOI] [PubMed] [Google Scholar]
- 41. El Mjiyad N., Caro-Maldonado A., Ramírez-Peinado S., Muñoz-Pinedo C. (2011) Sugar-free approaches to cancer cell killing. Oncogene 30, 253–264 [DOI] [PubMed] [Google Scholar]
- 42. Coloff J. L., Mason E. F., Altman B. J., Gerriets V. A., Liu T., Nichols A. N., Zhao Y., Wofford J. A., Jacobs S. R., Ilkayeva O., Garrison S. P., Zambetti G. P., Rathmell J. C. (2011) Akt requires glucose metabolism to suppress Puma expression and prevent apoptosis of leukemic T cells. J. Biol. Chem. 286, 5921–5933 [DOI] [PMC free article] [PubMed] [Google Scholar]
- 43. Yamaguchi R., Janssen E., Perkins G., Ellisman M., Kitada S., Reed J. C. (2011) Efficient elimination of cancer cells by deoxyglucose-ABT-263/737 combination therapy. PLoS One. 6, e24102. [DOI] [PMC free article] [PubMed] [Google Scholar]
- 44. Coloff J. L., Macintyre A. N., Nichols A. G., Liu T., Gallo C. A., Plas D. R., Rathmell J. C. (2011) Akt-dependent glucose metabolism promotes Mcl-1 synthesis to maintain cell survival and resistance to Bcl-2 inhibition. Cancer Res. 71, 5204–5213 [DOI] [PMC free article] [PubMed] [Google Scholar]
- 45. Zheng H., Ying H., Yan H., Kimmelman A. C., Hiller D. J., Chen A. J., Perry S. R., Tonon G., Chu G. C., Ding Z., Stommel J. M., Dunn K. L., Wiedemeyer R., You M. J., Brennan C., Wang Y. A., Ligon K. L., Wong W. H., Chin L., DePinho R. (2008) p53 and Pten control neural and glioma stem/progenitor cell renewal and differentiation. Nature 455, 1129–1133 [DOI] [PMC free article] [PubMed] [Google Scholar]
- 46. Xie J., Wang B. S., Yu D. H., Lu Q., Ma J., Qi H., Fang C., Chen H. Z. (2011) Dichloroacetate shifts the metabolism from glycolysis to glucose oxidation and exhibits synergistic growth inhibition with cisplatin in HeLa cells. Int. J. Oncol. 38, 409–417 [DOI] [PubMed] [Google Scholar]
- 47. Vella S., Conti M., Tasso R., Cancedda R., Pagano A. (2012) Dichloroacetate inhibits neuroblastoma growth by specifically acting against malignant undifferentiated cells. Int. J. Cancer. 130, 1484–1493 [DOI] [PubMed] [Google Scholar]
Associated Data
This section collects any data citations, data availability statements, or supplementary materials included in this article.