

Background: Robust assays for α-synuclein quantification are essential for Parkinson disease therapeutic development.
Results: TR-FRET immunoassays were validated for total and oligomeric α-synuclein and used to screen small molecules and kinases that regulate α-synuclein expression.
Conclusion: TR-FRET immunoassays are suitable for biomarker development and high-throughput screening.
Significance: This is the first platform for large-scale drug discovery and for neuronal pathway analysis of α-synuclein expression regulation.
Keywords: α-Synuclein, Fluorescence Resonance Energy Transfer (FRET), Neurodegeneration, Parkinson Disease, Protein Aggregation, Immunoassay, TR-FRET
Abstract
Familial Parkinson disease (PD) can result from α-synuclein gene multiplication, implicating the reduction of neuronal α-synuclein as a therapeutic target. Moreover, α-synuclein content in human cerebrospinal fluid (CSF) represents a PD biomarker candidate. However, capture-based assays for α-synuclein quantification in CSF (such as by ELISA) have shown discrepancies and have limited suitability for high-throughput screening. Here, we describe two sensitive, in-solution, time-resolved Förster's resonance energy transfer (TR-FRET)-based immunoassays for total and oligomeric α-synuclein quantification. CSF analysis showed strong concordance for total α-synuclein content between two TR-FRET assays and, in agreement with a previously characterized 36 h protocol-based ELISA, demonstrated lower α-synuclein levels in PD donors. Critically, the assay suitability for high-throughput screening of siRNA constructs and small molecules aimed at reducing endogenous α-synuclein levels was established and validated. In a small-scale proof of concept compound screen using 384 well plates, signals ranged from <30 to >120% of the mean of vehicle-treated cells for molecules known to lower and increase cellular α-synuclein, respectively. Furthermore, a reverse genetic screen of a kinase-directed siRNA library identified seven genes that modulated α-synuclein protein levels (five whose knockdown increased and two that decreased cellular α-synuclein protein). This provides critical new biological insight into cellular pathways regulating α-synuclein steady-state expression that may help guide further drug discovery efforts. Moreover, we describe an inherent limitation in current α-synuclein oligomer detection methodology, a finding that will direct improvement of future assay design. Our one-step TR-FRET-based platform for α-synuclein quantification provides a novel platform with superior performance parameters for the rapid screening of large biomarker cohorts and of compound and genetic libraries, both of which are essential to the development of PD therapies.
Introduction
Parkinson disease (PD)2 is a progressive neurodegenerative disorder comprising the loss of dopaminergic neurons, primarily from the substania nigra pars compacta region of the basal ganglia. A pathological hallmark of PD and related synucleinopathy disorders is the formation of intracellular protein aggregates termed Lewy bodies and Lewy neurites. The principal protein component of these inclusion entities is α-synuclein (1). This 14-kDa lipid-binding protein is encoded by the SNCA gene and is believed to regulate both synaptic and ER-Golgi vesicle trafficking (2–4). The accumulation and aggregation of α-synuclein is causally linked to PD progression. Indeed, both SNCA locus multiplication and Rep1 micro-satellite enhancer expansion, which augment α-synuclein expression (5–7), and SNCA missense mutations, which enhance oligomerization and aggregate formation (8–10), are found in rare forms of autosomal dominant, familial PD. Moreover, cellular and animal studies suggest that alterations in hereditary PD-linked genes, in particular LRRK2 and GBA1, can lead to the deleterious accumulation of α-synuclein (11–13). Thus, targeted reduction of α-synuclein protein levels may serve as a potent disease-modifying therapy for certain forms of familial and sporadic PD and other synucleinopathies (14).
Concurrently, there is a need for PD biomarkers for use in the primary diagnosis of the disorder, monitoring disease progression, patient stratification, and for evaluating the efficacy of clinical therapeutic interventions. Recent work from different groups suggests that the quantification of α-synuclein in cerebrospinal fluid (CSF) may serve as a suitable PD biomarker. However, among these reports there are inconsistencies in both the reported absolute concentration of CSF α-synuclein and the putative nature of its change in the PD condition. Indeed, although some studies found reduced CSF α-synuclein in PD relative to controls (15–19), another reported no change (20). There is further disparity in findings comparing CSF α-synuclein in PD and synucleinopathies to that of other neurodegenerative disorders (16, 20–24). Such discrepancies are likely due to the different assays and non-standardized collection protocols used between institutions. Furthermore, all hitherto reported α-synuclein quantification methods are based on immunoassay techniques that rely on sequential, labor-intensive capture and detection steps (“sandwich” assays). Consequently, their application to high-throughput translational research and biological pathway analysis methods is limited.
To address these shortcomings, we developed robust, reproducible, and sensitive homogeneous time-resolved Förster's resonance energy transfer (TR-FRET) immunoassays for α-synuclein quantification. TR-FRET assays display several key advantages over conventional capture-based assays. First, by virtue of an in-solution detection methodology, the assays rely on a single step for the addition of detection antibodies to samples. This obviates the need for multiple processing steps that encumber current techniques. Second, TR-FRET assays are compatible with the use of low sample volumes, thereby accommodating multiple technical replicates even with limited sample material. Third, this method offers an alternative to capture-based methods for the quantification of α-synuclein in human CSF as a potential biomarker for PD diagnosis or its progression. As demonstrated, for example, in the Alzheimer disease field, biomarker validation by multiple quantification technologies may be considered an important criterion for acceptance into clinical practice (25). Finally, the simple assay design is readily adaptable to high-throughput screening (HTS) applications for both reverse genetics and small molecule drug discovery efforts.
EXPERIMENTAL PROCEDURES
Study Participants
Forty subjects were enrolled into a new patient cohort at two sites (Paracelsus-Elena Klinik, Kassel, Germany; The Ottawa Hospital, Ottawa, Ontario, Canada) using a previously validated, single protocol (16) and standardized operating procedures (26). The study was approved by the respective institutional review boards. The working diagnoses of all patients were established according to internationally accepted classification criteria (16). Samples from donors serially enrolled were processed, aliquoted, and frozen as described (16) before loading onto assay plates.
Antibody Production
Polyclonal antibody hSA5.1 was raised at Open Biosystems, Inc. in goat to full-length, recombinant human α-synuclein, and purified and characterized as previously described (11). The HuCAL GOLD® phagemid library concept was used for the selection of antibodies, SynBa2 and SynBa3, recognizing human α-synuclein. Several panning strategies were applied that included solid phase, semi-solution, and solution panning. The screening of Fabs was performed by ELISA with directly coated α-synuclein or via capture screening with biotinylated α-synuclein. Affinity maturation was applied to increase affinity and biological activity of selected antibody fragments. Finally, anti-α-synuclein Fabs were converted into human/mouse IgG2a format.
Statement on Animal Health and Transgenic Mice
All experiments were carried out in accordance with the authorization guidelines of the Swiss federal and cantonal veterinary offices for the care and use of laboratory animals. Studies described in this report were approved by the Swiss cantonal veterinary office and performed according to Novartis animal license numbers 2063, 2415, 2382, and 1858. The animals were housed in a temperature-controlled room that was maintained on a 12-h light/dark cycle. Food and water were available ad libitum. Thy1-human α-synuclein (A53T) transgenic mice (27, 28) were genotyped using primers HP45 (5′-ACA CCC CTA AAG CAT ACA GTC AGA CC-3′) and HP42 (5′-TGG GCA CAT TGG AAC TGA GCA CTT-3′). Transgenic mice were kept in C57BL/6 background. For analyses, males and females were used, and wild type littermates were used as controls. α-Synuclein knock-out mice were obtained form Harlan (C57BL/6JolaHSD) and kept as a homozygous line.
Assay Development
Antibodies were chemically coupled to either a Lumi4-Tb® (terbium cryptate, Cisbio) donor fluorophore or d2® acceptor fluorophore (Cisbio). Antibodies labeled with donor or acceptor fluorophores are denoted throughout this report by the suffixes -Tb or -d2, respectively. For assays, 384-well low volume polystyrene (Greiner Bio-One) or non-low volume polypropylene (Thermo Scientific) microtiter plates were loaded with 5 or 12 μl/well, respectively, of analyte sample that was subsequently mixed with 1 or 2.4 μl of antibody solution (50 mm NaH2PO4, 400 mm NaF, 0.1% BSA, and 0.05% Tween 20) that contained 0.3 ng/μl of -Tb antibody and 3 ng/μl of -d2 antibody. Plates were incubated at 4 °C for 5 h (hSA5.1-Tb/SynBa2-d2) or 20 h (SynBa2-Tb/SynBa3-d2 or SynBa3-Tb/SynBa3-d2) before measurement of time-resolved fluorescence at 620 and 665 nm on an Envision Multilabel reader (PerkinElmer Life Sciences). For spiking experiments, recombinant α-synuclein or BSA was added as 20× concentrated solution to the final assay volume of lysate or CSF that had been previously plated in 384-well plates. For competition of endogenous lysate monomers with oligomeric detection antibodies, equal volumes of 2× concentrated oligomeric standard and 2× lysate were mixed before the addition of detection antibodies.
Sample Preparation
Brain lysates were prepared by homogenizing whole adult mouse brains in 10 volumes (v/w) of lysis buffer (PBS, 1% TritonX-100, and 1× protease inhibitor mixture (Roche Applied Science)) by sonication. Protein concentration was determined by BCA assay (Pierce). Human CSF was collected by routine lumbar puncture into serial polypropylene tubes, as previously described (15), followed by the addition of protease inhibitors and 0.2% Nonidet P-40 before storage. For TR-FRET analysis, 1% TritonX-100 was added to CSF. To prepare immunodepleted human CSF to serve as a calibration matrix, 0.5 ml of commercially available CSF from a healthy donor (PrecisionMed; supplemented with 1% Triton X-100, 0.2% Nonidet P-40, and protease inhibitors) was mixed with 350 ng of hSA5.1 antibody for 1 h at 4 °C. Immuncomplexes were then precipitated with 15 μl of protein G Dynabeads® (Invitrogen), and the immunodepleted CSF was stored at −80 °C until use. The efficiency of α-synuclein depletion was determined by TR-FRET with two antibody pairs (SynBa2-Tb/SynBa3-d2 and hSA5.1-Tb/SynBa2-d2).
SDS-PAGE and Western Blotting
SDS-PAGE was performed with NuPAGE® Bis-Tris 4–12% gels (Invitrogen). After electrophoresis, proteins were visualized by staining with Coomassie-based SimplyBlue Safestain (Invitrogen) or were electroblotted onto PVDF membranes. Before washing with detergent, membranes were fixed by incubation with 0.4% paraformaldehyde in PBS for 30 min at room temperature. For Western blotting, membranes were blocked with Odyssey blocking reagent (LI-COR Biosciences) for 1 h before overnight incubation with primary antibodies (α-synuclein, BD Transduction Laboratories #610787; diacylglycerol kinase isoform θ (DGKQ), BD Transduction Laboratories #610931; BRAF, Santa Cruz C-19 #sc-166). Membranes were then washed, incubated with HRP-coupled secondary antibodies for 1 h, and washed again, and proteins were detected by enhanced chemiluminescence.
Limit of Detection
To determine the α-synuclein TR-FRET limits of detection (LoD) for each antibody pair, pilot experiments consisting of serial dilutions were performed to gauge the lowest concentrations of α-synuclein at which signals were discernable from those of blanks. Provisional LoDs were calculated according to the definition of the Clinical and Laboratory Standards Institute (29), where LoD = LoB + 1.645 × S.D.sample, and limit of blank (LoB) = meanblank + 1.645 × S.D.blank. LoB was calculated from a minimum of 40 replicate blank samples (lysis buffer) and, assuming a gaussian distribution, thereby represents 95% of the observed values. LoDs for each antibody pair were then confirmed by TR-FRET measurements of 20 replicates of 2 or more samples at concentrations corresponding to provisional LoDs. LoDs were accepted for a given condition (antibody pair, plate type) at α-synuclein concentrations at which 95% (19/20) of observed signals were higher than the respective LoB.
Data Analysis
TR-FRET signals are presented here as ΔF values. This value effectively normalizes the emission TR-FRET-dependent signal of the acceptor fluorophore (665 nm) to that of the FRET-independent donor fluorophore (620 nm). Moreover, the background fluorescence is subtracted, and the percent TR-FRET signal increase over background is calculated. ΔF is thus given by the equation
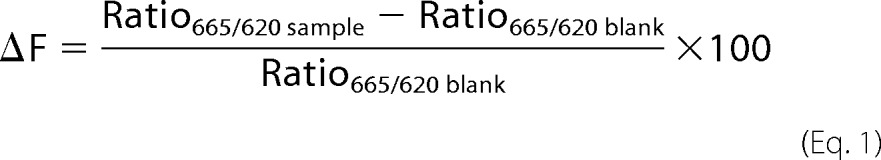 |
This value benefits from the internal reference of the donor fluorescence, thereby providing a signal corrected for potential assay-interfering artifacts and day-to-day assay fluctuation. An important feature of the TR-FRET assay is the long-lived fluorescence of the Tb donor fluorophore. This allows potential interference of short-lived background fluorescence from the analyte matrix to be removed by a time delay between the excitation pulse and fluorescence readout.
α-Synuclein Oligomerization and Purification
Recombinant α-synuclein (0.5 mg) purchased from rPeptide was diluted in 10 mm sodium phosphate buffer to 50 μm and mixed with 2 mm dopamine for the indicated times at 37 °C with shaking at 1000 rpm. Insoluble material was removed by centrifugation at 100,000 rpm for 15 min before separation by size-exclusion chromatography using a Superdex200 column. Samples were eluted in PBS at a flow rate of 0.5 ml/min and collected in 0.25-ml fractions. Peak fractions for oligomeric and monomeric α-synuclein were pooled.
TR-FRET Assay for High-throughput Screening
Pilot experiments were conducted to select efficacious control siRNAs and to optimize the time-course of α-synuclein knockdown (not shown). Positive control siRNA was from Qiagen (Hs_SNCA_1), and negative control was from Ambion (#AM4611). To assess knockdown of α-synuclein by Western blotting, HEK293T cells (100,000 cells/well) were reverse-transfected in 24-well plate format with a final concentration of 12.7 nm siRNA using Lipofectamine2000® reagent (1:1300 final dilution). Cells were harvested 72 h post-transfection in MPER® lysis buffer (Pierce), and Western blotting was performed. To assess HTS suitability, the siRNA reverse transfection procedure was scaled to a 384-well format. Final siRNA and Lipofectamine2000® concentrations were as above, with 2090 cells plated per well in white polystyrene plates (ThermoScientific). Positive and negative control siRNAs were manually plated in alternating columns followed by automated addition of diluted Lipofectamine2000® and then cells using a MultiDrop Combi microplate dispenser (ThermoScientific). After 72 h, PBS-rinsed cells were lysed in-well with 20 μl of MPER followed by direct addition of detection antibodies to lysates. FRET readings were recorded after 20 h of incubation at 4 °C. For α-synuclein overexpression, 850,000 cells/well were reverse-transfected in 6-well plates with the indicated amount of α-synuclein cDNA and Lipofectamine2000® (1:1300). The following day the cells were re-plated at 3750 cells/well of 384-well plates in alternating columns (duplicate columns per condition) using the MultiDrop dispenser. 24 h later cells were lysed, and TR-FRET readings were performed as for siRNA-treated cells above. Calculation of the Z′ factor (30) for control data, follows
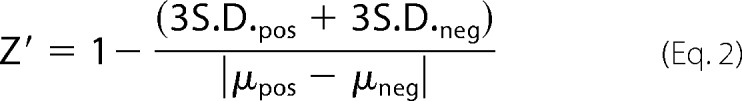 |
where S.D. is the standard deviation of positive and negative controls, and μ is the mean of said controls. For HTS, 965 compounds were randomly selected from a previously established in-house, low toxicity natural compound library. 125 nl of each compound (2 mm in DMSO) was automatically preplated in 384-well plates with DMSO as a negative control plated in an entire column of each plate. Benzalkonium chloride and rapamycin were plated by hand on each plate in a separate column. 4000 cells/well were delivered by MultiDrop dispenser in 50 μl of growth medium such that the final compound and DMSO concentrations were 5 μm and 0.25%, respectively. Cell lysis and TR-FRET detection 48 h later was performed as above. The Z factor for sample data evaluation was calculated by replacing negative control S.D. and μ from the Z′ factor equation with those of the combined test samples. siRNA screening of a pre-plated human kinase library was performed exactly as indicated above for HTS suitability assessment, including manual addition of positive and negative control siRNAs to each screening plate (8 wells/control/plate). To validate siRNA screen hits, HEK293T were reverse-transfected in 24-well plates (100,000 cells/well) using Lipofectamine2000® as above, with negative control siRNA or two selected siRNAs per gene from the secondary siRNA screen that were efficacious in hit identification. Cells were harvested 72 h post-transfection, and lysates were subjected to SDS-PAGE and Western blotting.
RESULTS
Development and Validation of α-Synuclein TR-FRET Immunoassays
The TR-FRET immunoassay relies on the distance-dependent energy transfer between fluorophores coupled to two high affinity antibodies. We used commercially available Terbium cryptate (Tb) donor and d2 acceptor fluorophores conjugated to antibodies that were generated de novo in-house or previously characterized (11). The Tb fluorescence occurring upon excitation is constant; however, the d2 fluorescence (FRET-dependent) is contingent upon a bound analyte in solution such that the necessary proximity for its excitation by the donor fluorophore is achieved (Fig. 1A).
FIGURE 1.

Design of TR-FRET immunoassay and dynamic range for recombinant α-synuclein. A, shown is representation of the TR-FRET assay principle. Coincident, in-solution binding of two fluorophore-labeled antibodies to unique epitopes on α-synuclein generates the TR-FRET signal. Excitation of the Tb donor fluorophore causes both analyte-independent fluorescence (620 nm) and non-radiative energy transfer to the d2 acceptor fluorophore. The latter TR-FRET signal (665 nm) is dependent on the presence of α-synuclein. B, shown is broad range dilution of α-synuclein and detection by the antibody pairs SynBa2-Tb/SynBa3-d2 and hSA5.1-Tb/SynBa2-d2. Recombinant α-synuclein was serially diluted in lysis buffer (PBS containing 1% Triton X-100) starting from 150 ng/ml in polystyrene 384-well microtiter plates followed by TR-FRET detection (average of duplicates). C, TR-FRET detection at low α-synuclein concentrations is shown. Recombinant α-synuclein was fractionally diluted in polystyrene plates to concentrations between 2 and 0.02 ng/ml followed by detection with SynBa2-Tb/SynBa3-d2.
To identify efficacious antibody pairs, several antibodies were screened in varied donor or acceptor combinations. Of note, microtiter plates accommodated sample volumes as low as 5 μl without signal attenuation, thereby minimizing sample consumption. TR-FRET signals are herein reported as the percent increase of test samples above the matrix (buffer) background (ΔF; see “Experimental Procedures”). Two pairs, referred to as SynBa2-Tb/SynBa3-d2 and hSA5.1-Tb/SynBa2-d2, were selected based on robust TR-FRET signals. Assay conditions were then optimized using recombinant α-synuclein analyte for the parameters of donor:acceptor antibody concentrations, incubation kinetics, temperature, and buffer components (data not shown). The assay is compatible with buffers containing various detergents or other supplements; however, radioimmune precipitation assay buffer abolished TR-FRET signals. This suggests that an upper limit of detergent stringency for efficacious antibody-analyte interaction is surpassed with radioimmune precipitation assay buffer.
Both antibody combinations exhibited large dynamic ranges (50 pg/ml to 50 ng/ml) for recombinant α-synuclein (Fig. 1B). SynBa2-Tb/SynBa3-d2 produced considerably higher ΔF values than hSA5.1-Tb/SynBa2-d2 in weakly diluted samples. This pair also exhibited a profound signal reduction at α-synuclein concentrations greater than 50 ng/ml. This characteristic feature of homogeneous immunoassays, known as the “high-dose hook effect,” is attributed to occlusion of coincident antibody binding at greater than limiting analyte concentrations. As SynBa-2-Tb/SynBa3-d2 produced stronger TR-FRET activity, we continue with its characterization for the purpose of this report. hSA5.1-Tb/SynBa2-d2 was characterized in a similar manner (data not shown).
Recent reports have consistently described α-synuclein concentration in human CSF to be lower than 2 ng/ml (16, 17, 20). We thus tested the more sensitive SynBa2-Tb/SynBa3-d2 TR-FRET assay for dose-response signal intensity at α-synuclein concentrations in this range. Excellent signal linearity between 0.1 and 2 ng/ml α-synuclein was observed, thereby validating the suitability of our assay for the analysis of human CSF specimens (Fig. 1C).
Plate-to-plate signal variability was examined on four non-consecutive days in both polystyrene (PS) and polypropylene (PP) plates. Microtiter plates are commonly supplied in either PS or PP formats; thus, it was necessary to empirically establish the compatibility of our assay with either. Moreover, previous immunoassays exhibited disparate performance between PS and PP.3 Here in all cases the TR-FRET assay displayed a high degree of reproducibility (<15% signal variability) (Fig. 2A) in either PS or PP plates. Assay LoD were also calculated. Replicate low concentration samples of recombinant α-synuclein were measured, and the LoD was accepted for a concentration at which 95% of replicates gave signals above a determined LoB (see “Experimental Procedures”). The LoD was 0.05 ng/ml for both PS and PP plates (Fig. 2B).
FIGURE 2.

Characterization of α-synuclein TR-FRET assay robustness and LoD. A, interassay variability assessment in PS and PP plates is shown. Recombinant α-synuclein was serially diluted (quadruplicates) freshly on each of four independent days in 384-well microtiter plates, as indicated, followed by TR-FRET detection. Fluorescence measurements were taken 20 h after antibody addition. B, the α-synuclein limits of detection in polystyrene and polypropylene plates were determined according to the procedure outlined by the Clinical Laboratory and Standards Institute (29). Recombinant α-synuclein was prepared at low concentrations corresponding to putative limits of detection as calculated from pilot experiments. Twenty replicates of each sample were then measured, and the LoD was accepted for concentrations at which at least 95% of the samples yielded TR-FRET signals above the LoB cut-off (determined from 40 blank replicates).
Analyte specificity is an additional important criterion for establishing a reliable immunoassay. α-Synuclein was detected in wild type murine brain lysates across a wide concentration range, whereas there was no signal observed in α-synuclein knock-out (KO) lysates (Fig. 3A). Similar results were obtained with murine CSF (data not shown). Next, recovery rates were determined by spiking recombinant α-synuclein into brain lysates. Average recovery rates were 99 and 103% at two lysate concentrations, indicating excellent assay accuracy and specificity for α-synuclein (Fig. 3B). Spiking murine CSF yielded a 107% recovery rate (data not shown). Thus, the assay is robust and suitable for the quantification of α-synuclein in biological and clinical samples.
FIGURE 3.

Determination of α-synuclein TR-FRET assay specificity and recovery rate. A, shown is antibody specificity determination using murine brain lysates. Wild type (Wt) or α-synuclein knock-out (KO) brains were homogenized in PBS, 1% Triton X-100-containing protease inhibitors, and lysates were serially diluted (triplicates) starting at 5000 ng/well in polystyrene 384-well microtiter plates followed by TR-FRET detection. B, assessment of α-synuclein recovery rate in brain lysates is shown. Wild type brain lysates at two concentrations were spiked with recombinant α-synuclein at the indicated concentrations followed by TR-FRET detection. Recovery rates were calculated from measured α-synuclein concentrations relative to spiked amounts. The calibration curve (below) was built by spiking recombinant α-synuclein into KO brains lysates.
Several groups have reported discrepant α-synuclein concentrations in clinical CSF samples by as much as 2 orders of magnitude (15–18, 20–24). The source of this variability may be the inherent properties of each assay or inconsistencies in CSF collection. It is also possible that the use of different calibration standards between studies contributes to this issue (for review, see Ref. 26). We, therefore, tested six recombinant proteins at two concentrations roughly approximating the expected CSF α-synuclein concentrations. As much as a 3-fold difference in TR-FRET signals was observed between standards (Fig. 4A). However, analysis by Coomassie staining and Western blotting under reducing and denaturing conditions also revealed modest but significant differences in the relative abundance of each standard (Fig. 4B). Standards 2 and 3, which were least abundant by visual detection, were also the most weakly detected by TR-FRET. This suggests that the difference in TR-FRET signals between standards was simply due to dissimilar sample concentration determination. The source of the recombinant standards is shown in the table (Fig. 4C).
FIGURE 4.

Characterization of several recombinant α-synuclein proteins as standards in the TR-FRET assay. A, six α-synuclein proteins from independent sources were plated in triplicate at the indicated concentrations on 384-well microtiter plates. TR-FRET analysis was with SynBa2-Tb/SynBa3-d2. Protein concentrations provided by the supplier were used to normalize protein input. B, Coomassie staining and Western blotting (WB) were used to evaluate the relative abundance of α-synuclein standards. C, shown is a table of identification and suppliers of recombinant standards.
Development of an Oligomer-specific α-Synuclein TR-FRET Assay
Aggregated α-synuclein is a pathological hallmark of PD. However, the nature of toxicity within the spectrum of soluble prefibrillar α-synuclein oligomers to fibrillar inclusions remains obscure. To determine whether our assay distinguishes monomeric from oligomeric α-synuclein, a recombinant oligomeric standard was generated by treatment with dopamine and purification by size-exclusion chromatography (SEC) (Fig. 5A). Note that the elution of monomeric α-synuclein with an apparent molecular mass >40 kDa in SEC has been previously reported (31). No difference in TR-FRET signal using SynBa2-Tb/SynBa3-d2 (to quantify total α-synuclein) was observed over identical dilution ranges of monomeric and oligomeric α-synuclein (Fig. 5B). This is explained by the fact that the detection antibodies recognize C-terminal epitopes. This region is excluded from the core of α-synuclein fibrils, as indicated by its sensitivity to proteolytic digestion (32). Thus monomers and oligomers likely present similar epitope stoichiometry for this assay. To increase our capacity to uniquely quantify different α-synuclein forms, we then developed an oligomer-specific TR-FRET assay. Similar to earlier ELISA-based methods (33), the assay utilizes a single monoclonal antibody in both donor and acceptor configurations (Fig. 5C). Oligomer specificity is achieved as donor-acceptor FRET pairs form only when multiple copies of a single epitope, solely presented by oligomers, are bound. A suitable antibody, SynBa3, was identified from pilot experiments (not shown), and a dynamic range of 2 orders of magnitude between 0.01 and 1 μg/ml was observed with the oligomeric standard. Critically, no signal was observed with the SEC-eluted monomer, thus confirming specificity for α-synuclein oligomers (Fig. 5D).
FIGURE 5.

Development of TR-FRET assay for detection of oligomeric α-synuclein. A, generation and purification of an oligomeric α-synuclein standard by SEC is shown. Left panel, shown is SDS-PAGE/Coomassie analysis of recombinant α-synuclein after treatment with 2 mm dopamine (DA) for the indicated times to induce oligomerization. Right panel, shown are SEC profiles of mock and dopamine-treated α-synuclein (24 h). Arrows indicate oligomeric (O) and monomeric (M) α-synuclein elution peaks. B, TR-FRET analysis of purified monomeric and oligomeric α-synuclein from SEC is shown. Oligomeric and monomeric α-synuclein from A were serially diluted in 384-well plates followed by TR-FRET with SynBa2-Tb/SynBa3-d2. C, representation of oligomer-specific α-synuclein TR-FRET assay is shown. D, shown is a specificity assessment of oligomer-directed TR-FRET assay. Purified oligomeric and monomeric α-synuclein from A were serially diluted in 384-well plates followed by TR-FRET. E, TR-FRET detection of α-synuclein oligomers in vivo is shown. The indicated brain regions of transgenic mice expressing human α-synuclein (A53T) were homogenized in PBS, 1% Triton X-100 and serially diluted in 384-well plates before SynBa3-Tb/SynBa3-d2 oligomer analysis (left panel) or SynBa2-Tb/SynBa3-d2 for total α-synuclein detection (right panel). F, competition analysis using spiked monomeric α-synuclein in oligomer-specific TR-FRET assay is shown. Oligomeric recombinant α-synuclein (1 μg/ml) was mixed with the indicated amounts of recombinant α-synuclein monomers (left panel) or with murine brain lysates of increasing concentration from transgenic, wild type, or α-synuclein KO animals (right panel).
The assay specificity in vivo was demonstrated using transgenic mice expressing human α-synuclein (27), which were recently found to accumulate soluble oligomers in the brainstem.4 As anticipated, oligomeric α-synuclein was detected solely in brainstem lysates, in comparison to forebrain (Fig. 5E, left panel). Similar lysate input was confirmed by SynBa2-Tb/SynBa3-d2 TR-FRET (Fig. 5E, right panel).
Elevated α-synuclein oligomers in human CSF, which are considered a portion of the total pool of α-synuclein species present in vivo, may be linked to the pathogenesis of PD and related synucleinopathies (19, 34). Unexpectedly, our initial attempts to quantify oligomeric α-synuclein in human CSF using SynBa3-Tb/SynBa3-d2 were unsuccessful (data not shown). We, therefore, considered that a larger pool of monomeric α-synuclein may have interfered with oligomer detection through competition for detection antibodies. To examine this possibility in a competitive binding experiment, we spiked increasing amounts of recombinant monomeric α-synuclein (Fig. 5F, left panel) or brain lysates from wild type and α-synuclein transgenic mice (Fig. 5F, right panel) into samples of recombinant oligomeric α-synuclein preparations that were held at a constant concentration. In either case the oligomer-specific TR-FRET signal was reduced in proportion to the amount of spiked monomer. No signal attenuation occurred with α-synuclein KO lysate.
Detection of α-Synuclein in Human Cerebrospinal Fluid
Reduced total α-synuclein concentration in human CSF is increasingly considered to be a strong PD biomarker candidate (for review, see Ref. 26). We examined this with our TR-FRET assays. To this end, a suitable calibration matrix was established by immunodepleting α-synuclein from a commercially available CSF sample. Effective immunodepletion (>90% α-synuclein reduction) was confirmed by SynBa2-Tb/SynBa3-d2 analysis (Fig. 6A). SynBa2-Tb/SynBa3-d2 and hSA5.1-Tb/SynBa3-d2 TR-FRET immunoassays were used to examine a new set of CSF specimens from PD and neurological control donors collected at two sites employing a previously validated protocol. Calibration curves for the analyses were built by spiking recombinant α-synuclein into the immunodepleted calibration matrix. Intriguingly, both TR-FRET antibody combinations showed a strong congruence in CSF α-synuclein quantification efforts (Fig. 6B). Total CSF α-synuclein concentrations were compared between PD and controls from within our collection. As anticipated, reduced CSF α-synuclein levels were recorded among PD donors in this small cohort of patients when group means were compared (Fig. 6C; PD 0.42 ± 0.16; control 0.53 ± 0.13). Thus, the TR-FRET assay platform was highly suitable for quantification of α-synuclein in human CSF while at the same time replicating the trend of reduced α-synuclein content in patients with typical PD (15–18, 21).
FIGURE 6.

TR-FRET quantification of α-synuclein in human CSF. A, establishment of immunodepleted CSF for use as a calibration matrix is shown. Human CSF was subjected to immunoprecipitation of α-synuclein by incubation for 1.5 h with hSA5.1 antibody followed by two rounds of capture with protein G beads. Subsequent TR-FRET analysis was with SynBa2-TB/SynBa3-d2. B, shown is quantification of α-synuclein content in the CSF of donors from various collections by two TR-FRET antibody pairs. C, shown is comparison of α-synuclein concentrations in PD and healthy control patient CSF. Data are presented as individual sample values (means of replicates) with group means (±S.E.) indicated.
Application of TR-FRET Assays to High-throughput Screening
Due to the TR-FRET assay simplicity, we applied the SynBa2-Tb/SynBa3-d2 total α-synuclein assay to HTS, with the aim of evaluating the potential for discovery of genetic or small molecule effectors of cellular α-synuclein reduction. Criteria for assay evaluation are both the variation and dynamic range of control data. These parameters may be combined into a single coefficient, the Z′ factor, to assess the degree of separation between positive and negative controls (i.e. the “screening window”). There, Z′ ≥ 0.5 indicates an assay with excellent suitability for screening (30) (see “Experimental Procedures”). We established positive controls for α-synuclein reduction by RNAi or increased expression by cDNA transfection. Knockdown yielded >80% reduction in α-synuclein protein when transfected at a low concentration. Little variability was found across a 384-well plate containing alternating columns of control or α-synuclein siRNA transfection (Fig. 7A, left panel). There were no evident patterns of positional bias, such as “edge effects.” Z′ calculation from this data set indicated excellent performance (Z′ = 0.69; Fig. 7A, right panel). Similarly, overexpression of increasing amounts of SNCA cDNA plasmid yielded data with little variability and strong Z′ factors (Fig. 7B). As the assay performed exceedingly well with the genomic controls, we proceeded to screen ∼1000 small molecules, randomly selected from a natural compound library, for modulation of cellular α-synuclein content. As expected, greater than 95% of compounds exhibited less than 20% deviation from the mean of negative controls (Fig. 7C, upper panel). The assay was highly reproducible when performed in duplicate, and the Z factor (for test sample evaluation, as opposed to Z′ for control data only) again indicated excellent performance when combined test sample data were calculated against that of toxic positive controls treated with benzalkonium chloride (Fig. 7C, lower panel). As anticipated from earlier work (11, 35), treatment with rapamycin as an on-plate control effected α-synuclein reduction. An histone deacetylase inhibitor (suberohydroxamic acid, indicated by an arrow) reproducibly increased α-synuclein content. This was expected based on a prior study with valproic acid (36).
FIGURE 7.

Assessment of TR-FRET assay suitability for HTS and screening of a small natural compound library. A, establishment of siRNA screening controls is shown. Positive and negative control siRNAs for α-synuclein knockdown were transfected in HEK293T cells in alternating columns of a 384-well microplate, and 72 h post-transfection cells were lysed followed by in-well TR-FRET detection. Individual well values are plotted column-wise in the left panel, and combined means of controls from the entire plate are plotted on the right. The Z′ factor (see “Experimental Procedures”) was calculated from the entire plate's data. B, shown was screening window determination for increased α-synuclein. HEK293T cells were transfected with increasing concentrations of α-synuclein cDNA and replated in 384-well plates 24 h later (duplicate columns per condition). Cells were lysed after a further 24 h, and TR-FRET detection and Z′ factor calculation were performed as in A. C, screening of a natural compound library is shown. 965 randomly selected natural compounds were preplated in 384-well microplates followed by the addition of HEK293T cells in growth medium to yield final compound concentrations of 5 μm (0.25% DMSO). After 48 h of treatment, cell lysis and TR-FRET detection were performed as in A. Sample ΔF values were normalized to same-plate DMSO controls. Z factor calculation compares the mean of test compound values and variation against that of a toxic positive control, benzalkonium chloride (Pos control). Rapamycin (Rap) was included as an additional positive control. Wells containing the histone deacetylase inhibitor (suberohydroxamic acid) are indicated by arrows. Correlation of duplicate screens is shown in the lower panel.
The suitability of the TR-FRET immunoassay for high-throughput applications was then exploited to gain an unbiased biological understanding of cellular pathways that regulate α-synuclein steady-state protein concentration. To this end, a siRNA library targeting 535 cellular kinases was screened in HEK293T cells for genes whose knockdown cause up- or down-regulation of endogenous α-synuclein. Replicate primary screens exhibited excellent reproducibility (Fig. 8A), and hits were selected for focused re-screening where knockdown yielded greater than a ±25% change in α-synuclein protein relative to the mean of negative controls (non-targeting control siRNA). Eighty primary hits were separately re-screened, employing a minimum of three unique siRNAs per gene using both of the TR-FRET antibody pairs, SynBa2-Tb/SynBa3-d2 and hSA5.1-Tb/SynBa2-d2 (Fig. 8B). In parallel, siRNAs from this same focused library were assessed for toxicity in three independent cell-number quantification assays. Eight siRNAs (targeting 8 unique genes) were considered toxic above a threshold set at >50% cell-number reduction relative to negative controls in at least two assays and were removed from candidate consideration (not shown). Positive hits (Fig. 8C) were declared for genes where, at minimum, knockdown by half of all same-gene targeting siRNAs yielded a non-toxicity-associated ±25% change in α-synuclein concentration in both the re-test (SynBa2-Tb/SynBa3-d2) and orthogonal (hSA5.1-Tb/SynBa2-d2) focused screens. It is noteworthy that of these kinases, the DGKQ locus has repeatedly been identified as a PD risk factor (37–40). Western blotting was used to validate two of the hits. Indeed, consistent with the screening results, knockdown of DGKQ and BRAF led to increased α-synuclein protein expression (Fig. 8D).
FIGURE 8.

siRNA-based screening of human kinases for modulation of total cellular α-synuclein concentration. A, shown is a primary screen of a kinase siRNA library targeting 535 genes (total of 912 unique siRNAs) in duplicate on non-consecutive days. HEK293T cells were reverse-transfected by plating onto preformed siRNA-Lipofectamine 2000 complexes in 384-well plates. Cell lysis and TR-FRET detection 72 h later was as in Fig. 6A. B, for retesting with the same (SynBa2-Tb/SynBa3-d2) and orthogonal (hSA5.1-Tb/SynBa2-d2) TR-FRET readouts, 351 unique siRNAs targeting 80 kinases (minimum 3 siRNAs/gene) were screened as in A. The selected kinases exhibited greater than ±25% change in total α-synuclein in the primary screen (Fig. 6A). DGKQ siRNAs are colored in yellow. C, shown is a table of screening hits. Kinases whose knockdown resulted in an increase or decrease in total α-synuclein protein of more than 25% with at least half of all same-gene siRNAs in both the focused re-test and orthogonal screens were declared as positive hits. D, Western blotting of lysates from HEK293T cells transfected with control or selected siRNAs targeting the kinome screen hits DGKQ or BRAF is shown. Lysates were prepared from cells harvested 72 h after transfection. Nonspecific proteins bands are marked with asterisks.
DISCUSSION
The findings of our work provide, among others, three critical developments. One, our method is the first reported capture-independent immunoassay to assess CSF α-synuclein concentration in clinical samples and other biological milieus. In agreement with several published reports (15–17), decreased total α-synuclein concentrations in CSF were recorded in PD in comparison with a matched cohort. Two, the simplified and markedly accelerated protocol of our TR-FRET assay (compared with previously reported methods) begat the first validation of an α-synuclein immunoassay for the purpose of HTS. Thus, future unbiased large-scale efforts to identify small-molecule modulators of the transcription, translation, and protein turnover rates that regulate cellular α-synuclein may identify already approved compounds that selectively reduce α-synuclein levels. These could conceivably be developed into therapeutics for future proof-of-principle studies in those PD cases that are linked to α-synuclein overexpression, particularly heritable forms caused by a monogenic event at the SNCA locus. Three, we utilized the HTS compatibility of the TR-FRET assay in a siRNA screen to identify eight kinases that regulate cellular α-synuclein steady-state protein expression. This finding as well as expansion of this screen to an entire human genome siRNA library represents an advance that now enables the unbiased delineation of key cellular pathways controlling α-synuclein cellular concentration that will compliment drug discovery programs.
The performance characteristics of the TR-FRET assays for total α-synuclein compare exceptionally well with other previously well characterized sandwich methods. The assays exhibit broad dynamic ranges and comparable interplate variability to other methods. The limits of detection (0.05 ng/ml) were intermediate to the two most sensitive assays characterized to date (15, 17). Furthermore, the assays were shown to be highly target-specific by several methods, including specificity validation for human CSF α-synuclein by immunodepletion. Our immunoassays are also highly robust as recovery rates from spiking experiments (99–107%) were similar to or improved upon those previously reported (15, 17).
The discordant CSF absolute α-synuclein levels among earlier reports may have been at least partially due to the use of different reference standards and antibodies that target different α-synuclein epitopes. We addressed both possibilities by comparing different recombinant α-synuclein standards and antibody combinations. Analysis of several unique recombinant α-synuclein standards, several of which were previously used, indicated signal disparity by no more than 3-fold. This variation is small compared with that for previously reported α-synuclein concentrations in human CSF between studies (>50-fold for control patients). Therefore, the use of different standards is unlikely to be the major source of this discrepancy. The excellent agreement of absolute α-synuclein concentrations in patient CSF between the two TR-FRET assays reported here suggests that dissimilar collection protocols or, possibly, cellular or blood contamination in other cross-sectional CSF cohorts might be the key element for reported α-synuclein concentration disparities.
Earlier studies utilizing capture-based immunoassays demonstrated reduced α-synuclein in the CSF of PD patients, relative to those of control cohorts (15–18, 21). We present here similar findings in a small cohort of PD and control patients, thereby potentially increasing the utility of CSF α-synuclein content as a PD biomarker. Indeed, the use of our sandwich-independent assay to replicate these findings may be more suitable than earlier reports to promote CSF α-synuclein quantification to a new tier in the hierarchy of PD biomarker development levels, as proposed by Montine (25). Future analyses of larger cohorts from multiple disease categories will be needed to warrant this conclusion. The CSF α-synuclein concentrations determined by TR-FRET are in excellent agreement with those recently reported by two groups (17, 20). However, although one of those studies found no change in CSF α-synuclein in PD patients (20), the other demonstrated reduced α-synuclein in PD CSF when samples were corrected for erythrocyte contamination. Moreover, reduced CSF α-synuclein in PD patients has also been reported in studies that interpolated slightly higher (2–4-fold) (15, 16) or dramatically higher (>30-fold) (18, 21) absolute concentrations of CSF α-synuclein in comparison to our study. More work is necessary to understand the nature of changes of CSF α-synuclein abundance and species in PD progression (e.g. post-translation modifications, the state of oligomerization, possible incorporation into quaternary complexes). It is noteworthy then that recent work detected alterations in α-synuclein phosphorylation (Ser-129) in the CSF of PD patients (41).
We also developed a TR-FRET immunoassay for detection of oligomeric α-synuclein. This assay exhibited excellent specificity for recombinant in vitro oligomerized α-synuclein and for oligomers in brainstem lysates of human α-synuclein transgenic mice. However, an important limitation was also identified. As in earlier reports (33, 34), our assay comprises a single α-synuclein monoclonal detection antibody in both donor and acceptor configurations. Although this arrangement begets specificity, it inherently disposes the interaction of oligomers with detection antibodies to competition with monomeric α-synuclein. Consequently, the oligomer signal is attenuated or abolished as the monomeric proportion of the total α-synuclein pool increases. This limitation also applies to ELISA assays based on the same design principle. Although we were unable to detect oligomeric α-synuclein in CSF, two groups reported an increase in oligomers in PD patients (19, 34). This is potentially surprising in light of our finding, as robust oligomer detection in itself would suggest that α-synuclein oligomers represent a sizeable portion of the total CSF α-synuclein pool in vivo. Considering the inconsistency between these studies and ours, it would be worthwhile to determine under what conditions a sandwich ELISA assay can facilitate the formation of α-synuclein oligomer artifacts in vitro. The production of a α-synuclein oligomer-specific antibody would present the opportunity for the development of a more conformation-dependent immunoassay. Of note, such an antibody has been recently described for fibrillar α-synuclein (42, 43). However, it indiscriminately binds both soluble oligomers and insoluble aggregates, thereby requiring labor-intensive processing steps to fractionate these species before sample loading. It is noteworthy that neither the TR-FRET oligomer assay nor the previously reported ELISA distinguishes soluble oligomers from fibrillar aggregates. Nevertheless, we have developed an effective immunoassay for detection of oligomeric α-synuclein species but have also identified a critical design limitation, which should be considered in the development and application of future assays.
In addition to its usefulness for diagnostic purposes, the TR-FRET assay is also highly suitable for HTS applications. The large screening windows assessed from control data by the dimensionless Z′ factor allowed us to perform a small pilot screen on natural compounds. Technical replication of the screen indicated good reproducibility, and several compounds, including rapamycin, yielded substantial α-synuclein reduction. In contrast, a histone deacetylase inhibitor reproducibly increased cellular α-synuclein, presumably by de-repression of its mRNA transcription (36). Critically, the α-synuclein TR-FRET immunoassays may now be scaled-up to directly accommodate both large-scale compound and full-genome siRNA screens, which are essential to drug development programs. From an operational perspective and to address the potential issues of compound cytotoxicity and effects on cell proliferation at the chosen screening concentration, we envision to further combine the TR-FRET assay platform with established assays of cell number quantification. Same-well cell number correction after TR-FRET readings would provide an elegant early filter mechanism for compound selection that seeks to automatically adjust for cell number alterations, thereby minimizing false positive hits.
In a screen of a human siRNA library, several kinases were confirmed by way of focused re-testing and orthogonal read-outs to modulate α-synuclein protein level in either a positive or negative manner. Perhaps most intriguing of these is DGKQ, due to its identification in genome-wide association studies as a PD risk factor. The lipid kinase family of DGKs catalyzes the conversion of diacylglycerol to phosphatidic acid and thereby regulate events downstream of these two lipid signals in part by antagonizing PKC activation by diacylglycerol (44, 45). DGKQ activity in turn is inhibited by GTP-bound RhoA (46). Although the connection between the knockdown of DGKQ and α-synuclein expression is presently unclear, it is tempting to speculate that DGKQ activity might repress RhoA-mediated transcriptional up-regulation of SNCA mRNA by GATA transcription factors (47, 48), possibly through PKC inhibition. Thus, putative DGKQ loss-of-function in PD might lead to enhanced basal transcription of SNCA. However, as both phosphatidic acid and diacylglycerol regulate numerous down-stream targets, other possibilities must also be considered in future work. It is noteworthy that our screen identified another lipid kinase, PI4K2A, that lies upstream of DGKQ in inositol phosphate second messenger metabolism.
In summary, our TR-FRET immunoassays for α-synuclein quantification represent an important new tool to PD research in terms of both biomarker development and therapeutic discovery, as well as for the understanding of mechanisms that regulate α-synuclein homeostasis. This is the direct result of its simplified design, which also facilitates significant scale-up. Due to its homogeneous nature, the assay is designed to detect “native” α-synuclein species in-solution, which represents a critical advance for the study of α-synuclein biochemistry. Our one-step method in its technical design avoids the potential formation of artifacts that may occur in conventional sandwich assays due to analyte transition between liquid and solid interfaces. We anticipate that this technology will greatly facilitate 1) the understanding of α-synuclein metabolism in vivo, 2) the study of α-synuclein processing in biological fluid specimens collected from patients at risk for or affected by synucleinopathy disorders, and 3) the discovery of first therapeutics that are cause-directed for a disorder that remains frustratingly incurable. In addition, 4) our demonstration of both the utility of TR-FRET for HTS and the interfering effects of monomeric α-synuclein on oligomer detection provide new insights that will help advance assay development for proteostatic disorders as a whole. In conclusion, we have developed and validated a new technology that is applicable to the full spectrum of the drug discovery process, e.g. from initial screening efforts to preclinical validation, and from the initial diagnosis to the monitoring of patient responses in α-synuclein-directed clinical trials.
Acknowledgments
We thank Christian Parker, Marie-Cecile Didiot, Claudia Agarinis, Barbara Baldo, Gabi Schutzius, Martin Semmelroth, and Stephan Grueninger for excellent assistance in assay development and constructive discussions. We thank our patients for their participation and encouragement and B. Otte and J. Conway for assistance in CSF collection.
This work was supported by funds from the Michael J. Fox Foundation (to B. M. and M. G. S.), the Parkinson Research Consortium of Ottawa, and the Government of Canada (to M. G. S.).
M. Schlossmacher, personal communication.
D. Shimshek, personal communication.
- PD
- Parkinson disease
- CSF
- cerebrospinal fluid
- TR-FRET
- time-resolved Förster's resonance energy transfer
- LoD
- limits of detection
- LoB
- limit of blank
- Tb
- terbium cryptate
- PS
- polystyrene
- PP
- polypropylene
- SEC
- size-exclusion chromatography
- Bis-Tris
- 2-[bis(2-hydroxyethyl)amino]-2-(hydroxymethyl)propane-1,3-diol
- DGKQ
- diacylgycerol kinase isoform θ
- HTS
- high-throughput screening
- BRAF
- v-raf murine sarcoma viral oncogene homolog B1.
REFERENCES
- 1. Spillantini M. G., Schmidt M. L., Lee V. M., Trojanowski J. Q., Jakes R., Goedert M. (1997) α-Synuclein in Lewy bodies. Nature 388, 839–840 [DOI] [PubMed] [Google Scholar]
- 2. Cooper A. A., Gitler A. D., Cashikar A., Haynes C. M., Hill K. J., Bhullar B., Liu K., Xu K., Strathearn K. E., Liu F., Cao S., Caldwell K. A., Caldwell G. A., Marsischky G., Kolodner R. D., Labaer J., Rochet J. C., Bonini N. M., Lindquist S. (2006) α-Synuclein blocks ER-Golgi traffic, and Rab1 rescues neuron loss in Parkinson models. Science 313, 324–328 [DOI] [PMC free article] [PubMed] [Google Scholar]
- 3. Nemani V. M., Lu W., Berge V., Nakamura K., Onoa B., Lee M. K., Chaudhry F. A., Nicoll R. A., Edwards R. H. (2010) Increased expression of α-synuclein reduces neurotransmitter release by inhibiting synaptic vesicle reclustering after endocytosis. Neuron 65, 66–79 [DOI] [PMC free article] [PubMed] [Google Scholar]
- 4. Thayanidhi N., Helm J. R., Nycz D. C., Bentley M., Liang Y., Hay J. C. (2010) α-Synuclein delays endoplasmic reticulum (ER)-to-Golgi transport in mammalian cells by antagonizing ER/Golgi SNAREs. Mol. Biol. Cell 21, 1850–1863 [DOI] [PMC free article] [PubMed] [Google Scholar]
- 5. Singleton A. B., Farrer M., Johnson J., Singleton A., Hague S., Kachergus J., Hulihan M., Peuralinna T., Dutra A., Nussbaum R., Lincoln S., Crawley A., Hanson M., Maraganore D., Adler C., Cookson M. R., Muenter M., Baptista M., Miller D., Blancato J., Hardy J., Gwinn-Hardy K. (2003) α-Synuclein locus triplication causes Parkinson disease. Science 302, 841. [DOI] [PubMed] [Google Scholar]
- 6. Chartier-Harlin M. C., Kachergus J., Roumier C., Mouroux V., Douay X., Lincoln S., Levecque C., Larvor L., Andrieux J., Hulihan M., Waucquier N., Defebvre L., Amouyel P., Farrer M., Destée A. (2004) α-Synuclein locus duplication as a cause of familial Parkinson disease. Lancet 364, 1167–1169 [DOI] [PubMed] [Google Scholar]
- 7. Cronin K. D., Ge D., Manninger P., Linnertz C., Rossoshek A., Orrison B. M., Bernard D. J., El-Agnaf O. M., Schlossmacher M. G., Nussbaum R. L., Chiba-Falek O. (2009) Expansion of the Parkinson disease-associated SNCA-Rep1 allele up-regulates human α-synuclein in transgenic mouse brain. Hum. Mol. Genet. 18, 3274–3285 [DOI] [PMC free article] [PubMed] [Google Scholar]
- 8. Polymeropoulos M. H., Lavedan C., Leroy E., Ide S. E., Dehejia A., Dutra A., Pike B., Root H., Rubenstein J., Boyer R., Stenroos E. S., Chandrasekharappa S., Athanassiadou A., Papapetropoulos T., Johnson W. G., Lazzarini A. M., Duvoisin R. C., Di Iorio G., Golbe L. I., Nussbaum R. L. (1997) Mutation in the α-synuclein gene identified in families with Parkinson disease. Science 276, 2045–2047 [DOI] [PubMed] [Google Scholar]
- 9. Krüger R., Kuhn W., Müller T., Woitalla D., Graeber M., Kösel S., Przuntek H., Epplen J. T., Schöls L., Riess O. (1998) A30P mutation in the gene encoding α-synuclein in Parkinson disease. Nat. Genet. 18, 106–108 [DOI] [PubMed] [Google Scholar]
- 10. Zarranz J. J., Alegre J., Gómez-Esteban J. C., Lezcano E., Ros R., Ampuero I., Vidal L., Hoenicka J., Rodriguez O., Atarés B., Llorens V., Gomez Tortosa E., del Ser T., Muñoz D. G., de Yebenes J. G. (2004) The new mutation, E46K, of α-synuclein causes Parkinson and Lewy body dementia. Ann. Neurol. 55, 164–173 [DOI] [PubMed] [Google Scholar]
- 11. Cullen V., Sardi S. P., Ng J., Xu Y. H., Sun Y., Tomlinson J. J., Kolodziej P., Kahn I., Saftig P., Woulfe J., Rochet J. C., Glicksman M. A., Cheng S. H., Grabowski G. A., Shihabuddin L. S., Schlossmacher M. G. (2011) Acid β-glucosidase mutants linked to Gaucher disease, Parkinson disease, and Lewy body dementia alter α-synuclein processing. Ann. Neurol. 69, 940–953 [DOI] [PubMed] [Google Scholar]
- 12. Tong Y., Yamaguchi H., Giaime E., Boyle S., Kopan R., Kelleher R. J., 3rd, Shen J. (2010) Loss of leucine-rich repeat kinase 2 causes impairment of protein degradation pathways, accumulation of α-synuclein, and apoptotic cell death in aged mice. Proc. Natl. Acad. Sci. U.S.A. 107, 9879–9884 [DOI] [PMC free article] [PubMed] [Google Scholar]
- 13. Mazzulli J. R., Xu Y. H., Sun Y., Knight A. L., McLean P. J., Caldwell G. A., Sidransky E., Grabowski G. A., Krainc D. (2011) Gaucher disease glucocerebrosidase and α-synuclein form a bidirectional pathogenic loop in synucleinopathies. Cell 146, 37–52 [DOI] [PMC free article] [PubMed] [Google Scholar]
- 14. Tomlinson J. J., Cullen V., Schlossmacher M. G. (2010) in Protein Misfolding Diseases: Current and Emerging Principles and Therapies (Ramirez-Alvaro M., Kelly J. W., Dobson C. M., eds.) pp. 817–844, John Wiley & Sons, Inc., New York [Google Scholar]
- 15. Mollenhauer B., Cullen V., Kahn I., Krastins B., Outeiro T. F., Pepivani I., Ng J., Schulz-Schaeffer W., Kretzschmar H. A., McLean P. J., Trenkwalder C., Sarracino D. A., Vonsattel J. P., Locascio J. J., El-Agnaf O. M., Schlossmacher M. G. (2008) Direct quantification of CSF α-synuclein by ELISA and first cross-sectional study in patients with neurodegeneration. Exp. Neurol. 213, 315–325 [DOI] [PubMed] [Google Scholar]
- 16. Mollenhauer B., Locascio J. J., Schulz-Schaeffer W., Sixel-Döring F., Trenkwalder C., Schlossmacher M. G. (2011) α-Synuclein and τ concentrations in cerebrospinal fluid of patients presenting with parkinsonism. A cohort study. Lancet Neurol. 10, 230–240 [DOI] [PubMed] [Google Scholar]
- 17. Hong Z., Shi M., Chung K. A., Quinn J. F., Peskind E. R., Galasko D., Jankovic J., Zabetian C. P., Leverenz J. B., Baird G., Montine T. J., Hancock A. M., Hwang H., Pan C., Bradner J., Kang U. J., Jensen P. H., Zhang J. (2010) DJ-1 and α-synuclein in human cerebrospinal fluid as biomarkers of Parkinson disease. Brain 133, 713–726 [DOI] [PMC free article] [PubMed] [Google Scholar]
- 18. Tokuda T., Salem S. A., Allsop D., Mizuno T., Nakagawa M., Qureshi M. M., Locascio J. J., Schlossmacher M. G., El-Agnaf O. M. (2006) Decreased α-synuclein in cerebrospinal fluid of aged individuals and subjects with Parkinson disease. Biochem. Biophys. Res. Commun. 349, 162–166 [DOI] [PubMed] [Google Scholar]
- 19. Tokuda T., Qureshi M. M., Ardah M. T., Varghese S., Shehab S. A., Kasai T., Ishigami N., Tamaoka A., Nakagawa M., El-Agnaf O. M. (2010) Detection of elevated levels of α-synuclein oligomers in CSF from patients with Parkinson disease. Neurology 75, 1766–1772 [DOI] [PubMed] [Google Scholar]
- 20. Ohrfelt A., Grognet P., Andreasen N., Wallin A., Vanmechelen E., Blennow K., Zetterberg H. (2009) Cerebrospinal fluid α-synuclein in neurodegenerative disorders. A marker of synapse loss? Neurosci. Lett. 450, 332–335 [DOI] [PubMed] [Google Scholar]
- 21. Parnetti L., Chiasserini D., Bellomo G., Giannandrea D., De Carlo C., Qureshi M. M., Ardah M. T., Varghese S., Bonanni L., Borroni B., Tambasco N., Eusebi P., Rossi A., Onofrj M., Padovani A., Calabresi P., El-Agnaf O. (2011) Cerebrospinal fluid τ/α-synuclein ratio in Parkinson disease and degenerative dementias. Mov. Disord. 26, 1428–1435 [DOI] [PubMed] [Google Scholar]
- 22. Spies P. E., Melis R. J., Sjögren M. J., Rikkert M. G., Verbeek M. M. (2009) Cerebrospinal fluid α-synuclein does not discriminate between dementia disorders. J. Alzheimers Dis. 16, 363–369 [DOI] [PubMed] [Google Scholar]
- 23. Noguchi-Shinohara M., Tokuda T., Yoshita M., Kasai T., Ono K., Nakagawa M., El-Agnaf O. M., Yamada M. (2009) CSF α-synuclein levels in dementia with Lewy bodies and Alzheimer disease. Brain Res. 1251, 1–6 [DOI] [PubMed] [Google Scholar]
- 24. Kasuga K., Tokutake T., Ishikawa A., Uchiyama T., Tokuda T., Onodera O., Nishizawa M., Ikeuchi T. (2010) Differential levels of α-synuclein, β-amyloid42 and τ in CSF between patients with dementia with Lewy bodies and Alzheimer disease. J. Neurol. Neurosurg. Psychiatry 81, 608–610 [DOI] [PubMed] [Google Scholar]
- 25. Montine T. J. (2011) Parkinson disease. PD biomarkers-use of α-synuclein reaches new levels. Nat. Rev. Neurol. 7, 308–309 [DOI] [PMC free article] [PubMed] [Google Scholar]
- 26. Mollenhauer B., El-Agnaf O. M., Marcus K., Trenkwalder C., Schlossmacher M. G. (2010) Quantification of α-synuclein in cerebrospinal fluid as a biomarker candidate. Review of the literature and considerations for future studies. Biomark Med. 4, 683–699 [DOI] [PubMed] [Google Scholar]
- 27. van der Putten H., Wiederhold K. H., Probst A., Barbieri S., Mistl C., Danner S., Kauffmann S., Hofele K., Spooren W. P., Ruegg M. A., Lin S., Caroni P., Sommer B., Tolnay M., Bilbe G. (2000) Neuropathology in mice expressing human α-synuclein. J. Neurosci. 20, 6021–6029 [DOI] [PMC free article] [PubMed] [Google Scholar]
- 28. Rieker C., Dev K. K., Lehnhoff K., Barbieri S., Ksiazek I., Kauffmann S., Danner S., Schell H., Boden C., Ruegg M. A., Kahle P. J., van der Putten H., Shimshek D. R. (2011) Neuropathology in mice expressing mouse α-synuclein. PLoS One 6, e24834. [DOI] [PMC free article] [PubMed] [Google Scholar]
- 29. Armbruster D. A., Pry T. (2008) Limit of blank, limit of detection, and limit of quantitation. Clin. Biochem. Rev. 29, S49–S52 [PMC free article] [PubMed] [Google Scholar]
- 30. Zhang J. H., Chung T. D., Oldenburg K. R. (1999) A simple statistical parameter for use in evaluation and validation of high throughput screening assays. J. Biomol. Screen 4, 67–73 [DOI] [PubMed] [Google Scholar]
- 31. Lashuel H. A., Petre B. M., Wall J., Simon M., Nowak R. J., Walz T., Lansbury P. T., Jr. (2002) α-Synuclein, especially the Parkinson disease-associated mutants, forms pore-like annular and tubular protofibrils. J. Mol. Biol. 322, 1089–1102 [DOI] [PubMed] [Google Scholar]
- 32. Miake H., Mizusawa H., Iwatsubo T., Hasegawa M. (2002) Biochemical characterization of the core structure of α-synuclein filaments. J. Biol. Chem. 277, 19213–19219 [DOI] [PubMed] [Google Scholar]
- 33. El-Agnaf O. M., Salem S. A., Paleologou K. E., Curran M. D., Gibson M. J., Court J. A., Schlossmacher M. G., Allsop D. (2006) Detection of oligomeric forms of α-synuclein protein in human plasma as a potential biomarker for Parkinson disease. FASEB J. 20, 419–425 [DOI] [PubMed] [Google Scholar]
- 34. Park M. J., Cheon S. M., Bae H. R., Kim S. H., Kim J. W. (2011) Elevated levels of α-synuclein oligomer in the cerebrospinal fluid of drug-naïve patients with Parkinson disease. J. Clin. Neurol. 7, 215–222 [DOI] [PMC free article] [PubMed] [Google Scholar]
- 35. Webb J. L., Ravikumar B., Atkins J., Skepper J. N., Rubinsztein D. C. (2003) α-Synuclein is degraded by both autophagy and the proteasome. J. Biol. Chem. 278, 25009–25013 [DOI] [PubMed] [Google Scholar]
- 36. Leng Y., Chuang D. M. (2006) Endogenous α-synuclein is induced by valproic acid through histone deacetylase inhibition and participates in neuroprotection against glutamate-induced excitotoxicity. J. Neurosci. 26, 7502–7512 [DOI] [PMC free article] [PubMed] [Google Scholar]
- 37. Lill C. M., Roehr J. T., McQueen M. B., Kavvoura F. K., Bagade S., Schjeide B. M., Schjeide L. M., Meissner E., Zauft U., Allen N. C., Liu T., Schilling M., Anderson K. J., Beecham G., Berg D., Biernacka J. M., Brice A., DeStefano A. L., Do C. B., Eriksson N., Factor S. A., Farrer M. J., Foroud T., Gasser T., Hamza T., Hardy J. A., Heutink P., Hill-Burns E. M., Klein C., Latourelle J. C., Maraganore D. M., Martin E. R., Martinez M., Myers R. H., Nalls M. A., Pankratz N., Payami H., Satake W., Scott W. K., Sharma M., Singleton A. B., Stefansson K., Toda T., Tung J. Y., Vance J., Wood N. W., Zabetian C. P., Young P., Tanzi R. E., Khoury M. J., Zipp F., Lehrach H., Ioannidis J. P., Bertram L. (2012) Comprehensive research synopsis and systematic meta-analyses in Parkinson disease genetics. The PDGene database. PLoS Genet 8, e1002548. [DOI] [PMC free article] [PubMed] [Google Scholar]
- 38. Pankratz N., Beecham G. W., DeStefano A. L., Dawson T. M., Doheny K. F., Factor S. A., Hamza T. H., Hung A. Y., Hyman B. T., Ivinson A. J., Krainc D., Latourelle J. C., Clark L. N., Marder K., Martin E. R., Mayeux R., Ross O. A., Scherzer C. R., Simon D. K., Tanner C., Vance J. M., Wszolek Z. K., Zabetian C. P., Myers R. H., Payami H., Scott W. K., Foroud T. (2012) Meta-analysis of Parkinson disease. Identification of a novel locus, RIT2. Ann. Neurol. 71, 370–384 [DOI] [PMC free article] [PubMed] [Google Scholar]
- 39. Pankratz N., Wilk J. B., Latourelle J. C., DeStefano A. L., Halter C., Pugh E. W., Doheny K. F., Gusella J. F., Nichols W. C., Foroud T., Myers R. H. (2009) Genomewide association study for susceptibility genes contributing to familial Parkinson disease. Hum. Genet. 124, 593–605 [DOI] [PMC free article] [PubMed] [Google Scholar]
- 40. Simón-Sánchez J., van Hilten J. J., van de Warrenburg B., Post B., Berendse H. W., Arepalli S., Hernandez D. G., de Bie R. M., Velseboer D., Scheffer H., Bloem B., van Dijk K. D., Rivadeneira F., Hofman A., Uitterlinden A. G., Rizzu P., Bochdanovits Z., Singleton A. B., Heutink P. (2011) Genome-wide association study confirms extant PD risk loci among the Dutch. Eur. J. Hum. Genet. 19, 655–661 [DOI] [PMC free article] [PubMed] [Google Scholar]
- 41. Wang Y., Shi M., Chung K. A., Zabetian C. P., Leverenz J. B., Berg D., Srulijes K., Trojanowski J. Q., Lee V. M., Siderowf A. D., Hurtig H., Litvan I., Schiess M. C., Peskind E. R., Masuda M., Hasegawa M., Lin X., Pan C., Galasko D., Goldstein D. S., Jensen P. H., Yang H., Cain K. C., Zhang J. (2012) Phosphorylated α-synuclein in Parkinson disease. Sci. Transl. Med. 4, 121ra120. [DOI] [PMC free article] [PubMed] [Google Scholar]
- 42. Lindersson E., Beedholm R., Højrup P., Moos T., Gai W., Hendil K. B., Jensen P. H. (2004) Proteasomal inhibition by α-synuclein filaments and oligomers. J. Biol. Chem. 279, 12924–12934 [DOI] [PubMed] [Google Scholar]
- 43. Paleologou K. E., Kragh C. L., Mann D. M., Salem S. A., Al-Shami R., Allsop D., Hassan A. H., Jensen P. H., El-Agnaf O. M. (2009) Detection of elevated levels of soluble α-synuclein oligomers in post-mortem brain extracts from patients with dementia with Lewy bodies. Brain 132, 1093–1101 [DOI] [PubMed] [Google Scholar]
- 44. Crotty T., Cai J., Sakane F., Taketomi A., Prescott S. M., Topham M. K. (2006) Diacylglycerol kinase δ regulates protein kinase C and epidermal growth factor receptor signaling. Proc. Natl. Acad. Sci. U.S.A. 103, 15485–15490 [DOI] [PMC free article] [PubMed] [Google Scholar]
- 45. Mérida I., Avila-Flores A., Merino E. (2008) Diacylglycerol kinases. At the hub of cell signaling. Biochem. J. 409, 1–18 [DOI] [PubMed] [Google Scholar]
- 46. Houssa B., de Widt J., Kranenburg O., Moolenaar W. H., van Blitterswijk W. J. (1999) Diacylglycerol kinase θ binds to and is negatively regulated by active RhoA. J. Biol. Chem. 274, 6820–6822 [DOI] [PubMed] [Google Scholar]
- 47. Scherzer C. R., Grass J. A., Liao Z., Pepivani I., Zheng B., Eklund A. C., Ney P. A., Ng J., McGoldrick M., Mollenhauer B., Bresnick E. H., Schlossmacher M. G. (2008) GATA transcription factors directly regulate the Parkinson disease-linked gene α-synuclein. Proc. Natl. Acad. Sci. U.S.A. 105, 10907–10912 [DOI] [PMC free article] [PubMed] [Google Scholar]
- 48. Zhou Z., Kim J., Insolera R., Peng X., Fink D. J., Mata M. (2011) Rho GTPase regulation of α-synuclein and VMAT2. Implications for pathogenesis of Parkinson disease. Mol. Cell Neurosci. 48, 29–37 [DOI] [PMC free article] [PubMed] [Google Scholar]