

Abstract
Live imaging studies of the processes of demyelination and remyelination have so far been technically limited in mammals. We have thus generated a Xenopus laevis transgenic line allowing live imaging and conditional ablation of myelinating oligodendrocytes throughout the CNS. In these transgenic pMBP-eGFP-NTR tadpoles the myelin basic protein (MBP) regulatory sequences, specific to mature oligodendrocytes, are used to drive expression of an eGFP (enhanced green fluorescent protein) reporter fused to the Escherichia coli nitroreductase (NTR) selection enzyme. This enzyme converts the innocuous prodrug metronidazole (MTZ) to a cytotoxin. Using two-photon imaging in vivo, we show that pMBP-eGFP-NTR tadpoles display a graded oligodendrocyte ablation in response to MTZ, which depends on the exposure time to MTZ. MTZ-induced cell death was restricted to oligodendrocytes, without detectable axonal damage. After cessation of MTZ treatment, remyelination proceeded spontaneously, but was strongly accelerated by retinoic acid. Altogether, these features establish the Xenopus pMBP-eGFP-NTR line as a novel in vivo model for the study of demyelination/remyelination processes and for large-scale screens of therapeutic agents promoting myelin repair.
Introduction
The myelin sheath was a transformative vertebrate acquisition, enabling at least a 50-fold increase in efficiency and velocity of action potential propagation along axons without increase in diameter (Zalc and Colman, 2000; Zalc et al., 2008). In the CNS, myelin is synthesized by the oligodendrocyte. Multiple sclerosis (MS) is an inflammatory and demyelinating CNS disease of the young adult. Within MS plaques demyelination is associated with loss of oligodendrocytes and often with axonal damage resulting in neurological deficit. To date, available treatments for MS can treat inflammation, but have little, if any, efficacy on remyelination. One way to facilitate repair of demyelinated lesions would be to promote endogenous oligodendrocytes development and their migration to the lesion sites. Unfortunately, the existing mammalian models of MS are not ideally suited to follow in vivo the process of demyelination and remyelination or for developing large-scale screens of compounds that promote myelin repair in vivo (Miller and Fyffe-Maricich, 2010). Therefore, there is a critical need for alternative animal models allowing live imaging and monitoring of oligodendrocytes during the demyelination and remyelination processes.
Small model organisms, such as amphibians and some teleosts, are increasingly being used at various stages of drug development and constitute highly cost-effective alternative models to mammals (Saito and van den Heuvel, 2002; De Smet et al., 2006; Giacomotto and Ségalat, 2010). Zebrafish and Xenopus embryos are transparent and develop as free-living larvae and therefore are particularly suited to investigate developmental processes at all stages. To study myelination, demyelination and remyelination, we have produced a transgenic Xenopus line (pMBP-eGFP-NTR) designed to specifically express in oligodendrocytes the fluorescent reporter GFP fused to the Escherichia coli nitroreductase (NTR), under the control of the 1.9 kb proximal portion of mouse MBP regulatory sequence. Here, we show that the GFP reporter is faithfully expressed in mature myelin-forming oligodendrocytes that are specifically ablated following treatment with metronidazole (MTZ, an NTR substrate). Treatment of pMBP-eGFP-NTR tadpoles induces selective demyelination, which is reversible on MTZ withdrawal. Two-photon microscopy allows tracking of GFP expression and thus the processes of demyelination and remyelination in vivo on the same transgenic specimen. Finally, using this in vivo model we show that spontaneous remyelination is dramatically increased upon exposure to retinoic acid, a molecule recently shown to play an essential role in myelin formation (Joubert et al., 2010; Latasa et al., 2010; Huang et al., 2011). Thus, the pMBP-eGFP-NTR Xenopus line offers a novel model to study demyelinization/remyelinization processes and is ideally suited for in vivo large-scale screening of pro-remyelinating drugs.
Materials and Methods
Animals.
Xenopus tadpoles were raised and maintained as previously described (de Luze et al., 1993) and staged according to the normal table of Xenopus laevis (Daudin) of Nieuwkoop and Faber and developmental progress defined as NF stages (Nieuwkoop and Faber, 1994). Tadpoles of either sex were anesthetized in 0.05–0.5% MS222 (3-aminobenzoic acid ethyl ester; Sigma-Aldrich) before brain and spinal cord dissection. Animal care was in accordance with institutional and national guidelines.
Generation of the pMBP-eGFP-NTR construct and transgenic Xenopus lines.
The bacterial NfsB gene encoding NTR was directly amplified by PCR from E. coli using the following oligos: 5′-ATGCTCGAGCCATGGATATCATTTCTGTCGCCTTA-3′ and 5′-GGGGATCCGATCGATCTCAATACCCGCTAAATA-3′, as previously described (Curado et al., 2007). The amplification product was digested by XhoI and BamHI and cloned in frame to eGFP in the peGFP-C1 vector (Clontech) to produce the CMV-eGFP-NTR construct. This vector was used to amplify the eGFP-NTR fusion cDNA using two flanking primers containing BamHI restriction sites at their 5′ end, and the product was inserted into the unique BamHI site of the pMG2 plasmid containing the 1.9 kb proximal portion of mouse MBP regulatory sequence (Gow et al., 1992) to produce the final pMBP-eGFP-NTR vector (Fig. 1A). The pMBP-eGFP-NTR plasmid was linearized with EcoRI and used to generate stable transgenic Xenopus laevis embryos using a simplified restriction enzyme-mediated integration (REMI) procedure (Kroll and Amaya, 1996; Sparrow et al., 2000; Chesneau et al., 2008). F0 animals were crossed to wild-type Xenopus to generate lines, one of which was selected that carry a single transgene integration site. Transgenic embryos were genotyped by assessing the presence of eGFP/NTR fusion transcripts by reverse transcriptase (RT)-PCR using the forward primer 5′-ACGTCTATATCATGGCCGACAAG-3′ and reverse primer 5′-TGCAGTAGCGTTTTGATCTGCTC-3′ located on either side of the eGFP/NTR junction to amplify a 394 bp fragment. To this end, 2 μg of total RNA extracted from brains were reverse transcribed using the SuperScript II kit (Invitrogen) according to the manufacturers' instructions and used as template for the PCR. The fusion protein (GFP/NTR) was detected directly by fluorescence in live embryos using an AZ100 Nikon Zoom Microscope.
Figure 1.

Structure and expression of the pMBP-eGFP-NTR transgene. A, Schematic diagram of the pMBP-eGFP-NTR construct. The transgene contains the eGFP open reading frame fused to that of E. coli NTR placed under the control of the DNA regulatory sequence of the murine MBP gene (−1907 bp and +36 bp). B, RT-PCR performed on RNA extracted from brains of transgenic (TG) or wild-type (WT) tadpoles used to amplify a 394 bp fragment corresponding to the junction of eGFP/NTR sequence. C–F, Transgene expression as assessed by GFP fluorescence (C–E) or immunolabeling (F) in a pMBP-eGFP-NTR transgenic tadpole at stage 55. Dorsal view of the head (C) and sagittal view of the tail (D). Expression is only observed in the CNS (brain and spinal cord) but not in the peripheral nervous system. Inset in C is a higher magnification to illustrate the detection of GFP in the optic nerve. E, In vivo stack of images of the optic nerve obtained by two-photon microscopy. Note the fluorescent processes of the GFP+ cells. F, Confocal image of a whole mount of the optic chiasm immunostained for MBP (red) and GFP (green). Note the GFP+ cell bodies extending their processes toward the strongly MBP+ myelinated fibers. Scale bar (in E) C, D, 2 mm; E, F, 50 μm; inset (C), 1 mm.
Metronidazole preparation and use.
MTZ (Fluka) was dissolved in filtered tap water containing 0.1% DMSO (Sigma Aldrich). Preliminary experiments demonstrated that high concentrations (> 20 mm) of MTZ were toxic. Therefore, MTZ was used at concentrations of 10 or 15 mm and exposure time ranged from 3 to 11 d. Control animals were kept in the same media without MTZ. Furthermore, transgenic or nontransgenic sibling tadpoles were maintained in 600 ml of MTZ solution (maximum 10 tadpoles/600 ml) at 20°C in complete darkness (MTZ is light-sensitive) and daily changed throughout the duration of treatment. For regeneration experiments, MTZ-treated animals were allowed to recover for up to 6 d in normal water in ambient laboratory lighting.
Transgenic tadpoles were treated with drugs between stage NF 48 and 55. These stages correspond to pre-metamorphosis and represent stages in which myelination is ongoing. Myelination markers such as proteolipid protein (PLP) and myelin basic protein (MBP) are first immunodetected at stages 42/43 in the hindbrain and spread throughout the brain and spinal cord by stages 46/47 (Yoshida, 1997). In the optic nerve at the electron microscopic (EM) level myelination was reported to begin in the middle portion at stage 48/49 and the number of myelinated axons increases sevenfold between stage 50 and 57 (Cima and Grant, 1982).
Immunohistochemistry.
Tadpoles were fixed by immersion in 4% paraformaldehyde, rinsed in 1× PBS, cryoprotected in 30% sucrose (1× PBS) and frozen embedded in OCT (Tissue Tek). Cryosections (12 μm) were blocked in 10% normal goat serum in 1× PBS containing 0.1% Triton X-100 and incubated overnight at 4°C with primary antibodies. For whole-mount immunolabeling, dissected fixed brains were first incubated for 2 d at 4°C in primary antibody and then overnight at 4°C with secondary antibody. The brains were rinsed extensively in 0.1% Triton X-100 following antibody incubations and before mounting. The following primary antibodies were used for immunostaining: mouse anti-GFP (1:1000, Invitrogen), rabbit anti-activated-caspase3 (1:250, BD PharMingen), mouse anti-APC (Ab7) (1:500, Calbiochem), anti-Nkx2.2 (1:10, mouse hybridoma, Developmental Studies Hybridoma Bank, Iowa City, IA), mAb to phosphorylated neurofilaments (mouse IgG1 SMI 31; 1/500, Covance), mouse anti-MBP monoclonal antibodies (directed against Xenopus MBP, 1:1000, kindly provided by Saburo Nagata, Women's Tokyo University, Japan), anti-pan-neurofascin (NFC1) (1:1000; Zonta et al., 2008), and anti-Hu (1:10,000 Human serum, kindly provided by Dr. Jean-Yves Delattre, Centre de Recherche de l'Institut du Cerveau et de la Moelle épinière, Groupe Hospitalier Pitié-Salpêtrière, France). Specific binding sites were visualized using anti-mouse or anti-rabbit fluorescent secondary antibodies (1:1000 Alexa 488 or 594, Invitrogen) and for Hu Ab, anti-human IgG F(c) coupled to Texas Red (1:400, Rockland). Sections were stained in Hoechst solution (Sigma-Aldrich) and mounted in FluorSave Reagent mounting medium (Calbiochem).
Electron microscopy.
Tadpoles were fixed in 2% paraformaldehyde, 2% glutaraldehyde, 1% potassium ferricyanide in 0.1 m cacodylate buffer, pH 7.4 and 0.002% calcium chloride overnight at 4°C, washed in 0.1 m cacodylate buffer, and postfixed in 1% osmium tetraoxide, 1% potassium ferricyanide in 0.1 m cacodylate buffer. After washing in cacodylate buffer and water, tadpoles were incubated in 1% uranyl acetate aqueous solution at 4°C overnight. After rinsing twice in water, tadpoles were dehydrated in increasing concentrations of ethanol, washed in increasing concentrations of 2-hydroxypropyl methacrylate (Electron Microscopy Sciences) dissolved in 90% ethanol, infiltrated, and embedded in Epon-BDMA solution (Epon, benzyl dimethylamine; Electron Microscopy Sciences). Blocks were heated at 70°C for 72 h. Ultrathin sections (70 nm) were examined on an EM208 electron microscope (Philips).
Histology and Luxol fast blue staining.
Tadpoles were fixed for 48 h at room temperature in 3.8% formaldehyde in water. Paraffin sections (6 μm) were stained with Luxol fast blue as previously described (Geisler et al., 2002). Briefly, rehydrated sections were immersed in a Luxol fast blue-0.1% ethanol solution at 60°C for 24 h and washed in distilled water. The slides were differentiated in 0.05% lithium carbonate solution for 30 s and then in 70% ethanol for 30 s. Slides were counterstained in cresyl violet solution for 30–40 s. After rinsing in distilled water, the slides were differentiated in 95% ethanol for 5 min in 100% ethanol and mounted with Eukitt medium (Sigma Aldrich). As a result of these staining procedures, myelinated fibers are stained blue, and neuronal cell bodies are stained pink to violet.
Two-photon observation.
For in vivo examination of GFP-expressing oligodendrocytes along the optic nerve, tadpoles were anesthetized in MS222 and placed in a POC-Chamber-System (H. Saur), under a two-photon microscope. Mono-photon or two-photon excitation was performed using Zeiss LSM 710 microscope system. The microscope was equipped with objective (20×, 1 NA). Calculated optical slice thickness was 2 μm. Each image presented is the 3D projection of 18–26 stacks of images. The settings (gain and aperture pinhole) were held constant within individual experiments. All images shown were processed with ImageJ software (NIH).
Quantification of GFP+ cells.
In the optic nerve, the total number of GFP+ cells was counted, from the emergence of the nerve to the retinal end before and after MTZ treatment on the same embryos and data were compared with control untreated animals of the same developmental stage. On medulla preparations, quantification of GFP+ cells was per tissue sections and each data point is the mean value of six sections from one tadpole. Data presented are the mean ± SEM of number of GFP+ cells counted on 6 tadpoles (n = 6).
Statistical analysis.
Prism v5 software (GraphPad) was used for statistical analyses. Results are expressed as means ± SEM. Data were compared using Student's t test. Statistical significance was set at p < 0.05.
Results
Oligodendrocyte-restricted expression of a dual reporter/selection transgene in Xenopus laevis
The proximal regulatory sequences of the murine myelin MBP gene contain enhancer and promoter elements localized between position +36 and −1907, which are sufficient for a strong and specific expression in mature oligodendrocytes (Gow et al., 1992; Stankoff et al., 1996). As shown in Figure 1A, this 1.9 kb proximal regulatory sequence is used to drive expression of a dual reporter/selection transgene (eGFP-NTR) composed of the enhanced green fluorescent protein (eGFP) reporter gene fused in frame with the bacterial nfsB gene encoding the NTR enzyme for MTZ-dependent cell ablation (Curado et al., 2007). The pMBP-eGFP-NTR vector was used for REMI transgenesis in Xenopus laevis. Several transgenic founders (F0) were generated and crossed to wild-type animals to obtain F1 progenies. F1s were then genotyped by RT-PCR to confirm the expression of the fusion GFP/NTR transcript and to characterize the number of integration sites for each line (Fig. 1B).
Indicative of transgene expression in the pMBP-eGFP-NTR tadpole the first GFP+ cells were detected at stage 41–42 within the brainstem (data not shown). At stage 55, GFP+-expressing cells were detected exclusively in the brain (Fig. 1C), spinal cord (Fig. 1D) and optic nerve, where fluorescence was clearly confined to cell bodies extending thin processes, highly reminiscent of oligodendrocytes (Fig. 1E,F). It should be noted that, as GFP is cytoplasmic, fluorescence was not detected in the myelin sheath. Figure 1F shows a whole mount of the chiasm double-labeled with anti-GFP and -MBP antibodies. GFP+ cells extend processes toward the internode region of axons where MBP expression is mostly concentrated in the myelin sheath (Ainger et al., 1997). However, during the process of wrapping before myelin compaction, GFP can diffuse in the cytoplasmic compartments of myelin and it was possible to detect early myelination in vivo. Indeed, at stage 50, i.e., at a stage when myelination is ongoing, oligodendrocyte processes extending along axons were clearly visible as illustrated on a stack of 17 optical sections of the optic nerve (Movie 1). As development proceeds, the distribution of GFP+ cells extends from the brainstem, caudally to the spinal cord and rostrally to the forebrain, following the expected pattern of myelination in mammals (Kanfer et al., 1989). We could not detect expression of the transgene in the peripheral nervous system (PNS). This result is in agreement with the observation that the 1.9 kb MBP regulatory sequence drives MBP expression in oligodendrocytes, while in Schwann cells, MBP expression is controlled by a different 422 bp enhancer −9 kb upstream of the transcriptional initiation site (Denarier et al., 2005).
Movie 1.
Faint detection of GFP in myelin along optic nerve axons of stage 50 pMBP-eGFP-NTR transgenic tadpole. At this early developmental stage, the wrapping process is ongoing, therefore myelin is still not completely compact and this allows diffusion of GFP in the myelin cytoplasmic compartment. This movie represents the Z-projection of 17 successive optical sections across the thickness of the optic nerve imaged by two-photon microscopy.
To confirm the specific expression of the eGFP/NTR transgene in mature oligodendrocytes, cryosections from pMBP-eGFP-NTR transgenic tadpoles at stage 55 were double labeled with antibodies against GFP and cell type-specific markers, i.e., APC (adenomatous polyposis coli) for mature oligodendrocytes (Bhat et al., 1996), Nkx2.2 transcription factor for oligodendrocyte precursor cells and mature oligodendrocytes (Soula et al., 2001; Yoshida and Macklin, 2005), GFAP (glial fibrillary protein) for astrocytes (Eng et al., 1971), and Hu RNA-binding protein for neurons (Graus and Ferrer, 1990; Fig. 2). All sections examined showed a complete superimposition of GFP and APC labeling, with all GFP+ cells expressing APC and all APC+ cells expressing eGFP (Fig. 2A–C). This observation bolsters the argument that GFP/NTR expression is restricted to oligodendrocytes. In the ventral ventricular domain of the medulla, Nkx2.2+ progenitor cells did not express GFP. In contrast, white matter tracts showed a vast majority of Nkx2.2+/GFP+ cells, which are likely mature oligodendrocytes (Fig. 2D–F). In addition, GFP expression was detected neither in GFAP-expressing astrocytes (Fig. 2G–I) nor in Hu+ neurons (Fig. 2J–L), These data demonstrate the strict oligodendroglial expression of the eGFP-NTR transgene in tadpoles and suggest that, both in mice and Xenopus, the 1.9 kb regulatory sequence of MBP selectively drives transgene expression in mature myelin-forming oligodendrocytes.
Figure 2.

The pMBP-eGFP-NTR transgene drives expression in mature oligodendrocytes. Coronal tissue sections across the medulla of pMBP-eGFP-NTR tadpole at stage 55 coimmunostained for GFP and successive markers of different cells types. A–C, GFP and APC, a specific marker of mature oligodendrocytes. Note the complete overlap of GFP labeling with that of APC. D–F, GFP and Nkx2.2, a marker of progenitor of oligodendrocytes and mature oligodendrocytes. Note that cells doubly labeled for GFP and Nkx2.2 are localized in the white matter tract, with no GFP detection in Nkx2.2+ progenitors in the ventral ventricular layer (white arrows in F). G–I, GFP and GFAP, a marker of astrocytes. J–L, GFP and Hu, a pan-neuronal marker. Note the complete exclusion of GFP labeling with either GFAP (I) or Hu (L). Scale bar (in C) A–F, J–L, 50 μm; G–I, 25 μm.
MTZ treatment induces oligodendrocyte depletion and demyelination in a MTZ-dependent manner
We next tested the ability of NTR to render oligodendrocytes susceptible to drug-dependent ablation by treating transgenic tadpoles with increasing concentrations of MTZ. Preliminary experiments showed that treatment of stage 55 tadpoles with 20 mm MTZ (or higher concentrations) was toxic. Hence, tadpoles were treated with 10 or 15 mm MTZ for 3 or 6 d. The number of GFP+ cells per optic nerve was highly reproducible and increased progressively as a function of development (7 ± 2, 25 ± 3, and 31 ± 2 at stages 48, 50, and 55 respectively). Progressive MTZ-induced oligodendrocyte cell death in transgenic tadpoles was monitored on live embryos by successive examinations of the optic nerve of the same animal under either a fluorescent macroscope or a two-photon microscope.
In vivo examination of the optic nerve of MTZ-treated stage 55 tadpoles (10 mm for 3 d) resulted in a 50% depletion of GFP+ cells per optic nerve (Fig. 3A,B). Quantification showed that this reduction was highly significant: 31 ± 2 in controls versus 16 ± 2 after 72 h MTZ treatment (p < 0.001 n = 6 tadpoles). A similar depletion of GFP+ oligodendrocytes was observed in medulla sections (Fig. 3C–H): 42 ± 2 in controls vs 22 ± 1 after MTZ treatment, number of GFP+ cells per tissue section (p < 0.0001, n = 6 tadpoles). Oligodendroglial cell death following MTZ treatment occurred by apoptosis as double immunostaining showed that most GFP+ cells were also positive for anti-caspase 3 staining in MTZ-treated tadpoles (Fig. 3D,F,H). This result contrasted with the absence of caspase3+/GFP+ cells in untreated tadpoles (Fig. 3C,E,G). Apoptosis was also confirmed at an earlier developmental stage by TUNEL (terminal deoxynucleotidyl transferase-mediated biotinylated UTP nick end labeling) assays (data not shown). Live imaging in the optic nerve of the death of an oligodendrocyte consecutive to MTZ treatment of a stage 55 tadpole is illustrated in Movie 2.
Figure 3.
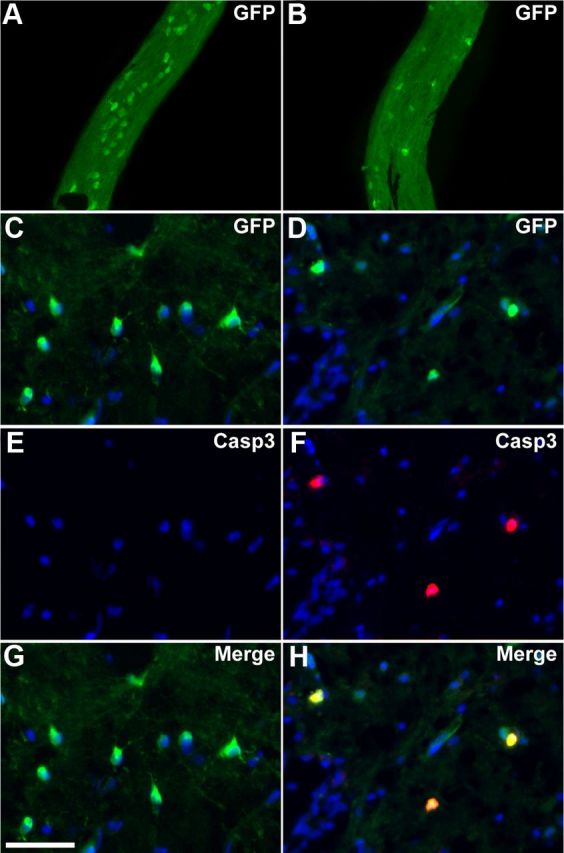
Oligodendrocyte depletion and apoptosis in transgenic tadpoles following MTZ treatment. A, B, Whole-mount two-photon microscopy of the optic nerve at stage 55 showing GFP+ cells in transgenic animals untreated (A) or MTZ-treated for 3 d (B). MTZ induced a severe depletion of GFP+ cells in the optic nerve. C–H, Immunolabeling for GFP and activated caspase3 (Casp3) on coronal sections across the medulla in untreated (C, E, G) or MTZ-treated (D, F, H) transgenic animals. In MTZ-treated animals, activated caspase3 is detected in GFP+ cells. Scale bar (in G) A, B, 150 μm; C–H, 50 μm.
Movie 2.
Live imaging of an oligodendrocyte cell death caused by MTZ treatment. A stage 55 tadpole was treated with MTZ for 5 d. The optic nerve was visualized by two-photon microscopy between one and four times a day for 5 d. On day 6, when the pattern of fluorescence of one oligodendrocyte (arrow) in the field of observation changed dramatically, indicative that the cell was entering apoptosis, we imaged four times at 90 min intervals.
Since GFP+ cells are mature myelinating oligodendrocytes, ablation of these cells should lead to a severe demyelination. As illustrated on medulla sections, MTZ-treated tadpoles showed a marked decrease in the density of Luxol fast blue-stained fibers compared with untreated controls (Fig. 4A,B). It was previously shown that disorganization of nodes of Ranvier is a good indicator of demyelination (Howell et al., 2006; Pernet et al., 2008). To confirm that demyelination occurred in MTZ-treated pMBP-eGFP-NTR tadpoles, we analyzed the nodes of Ranvier organization using pan-neurofascin antibodies directed against neurofascin isoforms NF155 and NF186, which are expressed at the paranodal and nodal domains, respectively (Zonta et al., 2008, 2011). Immunolabeling of tadpole optic nerve sections with pan-neurofascin antibodies showed, as in the mouse, an intense staining at the paranodal domains (probably corresponding to glial NF155) and a weaker, although clearly detectable, staining (axonal NF186) of the node (Fig. 4C, inset).
Figure 4.
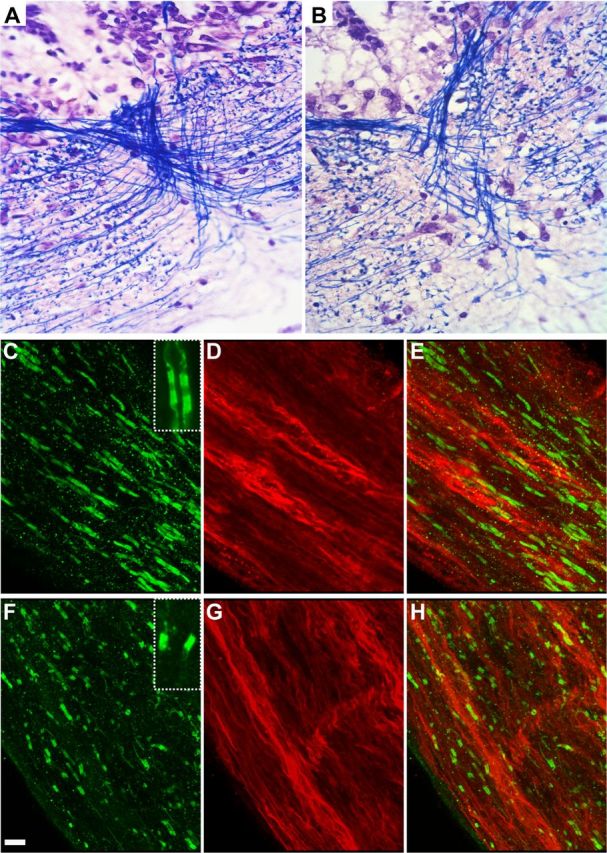
MTZ treatment induces demyelination without axonal damage. A, B, Myelinated fibers staining with Luxol fast blue on coronal sections across the medulla at stage 55 in untreated (A) or MTZ-treated (B) transgenic animals. C–H, Whole mount of optic nerve at stage 55 immunostained for neurofascin (green) and SMI-31 (red) in untreated (C–E) or MTZ-treated (F–H) transgenic animals. Insets in C and F are high magnifications of nodes of Ranvier showing a strong signal for NF 155 in the paranodal domain and a weaker signal in the node (NF186) in a control animal (C), where in case of partial demyelination, only hemiparanodes are labeled (F). MTZ treatment induced demyelination, characterized by disorganization of the neurofascin+ nodes of Ranvier (F, H) with numerous heminodes compared with control (C, E). In MTZ-treated tadpoles, SMI-31 axons had a normal appearance (G, compared with D), suggesting that MTZ-induced demyelination does not affect the axons. Scale bar (in F) A, B, 17 μm; C–H, 5 μm; insets (C, F), 2 μm.
To determine the extent of demyelination process induced by MTZ treatment, we next examined whole mounts of optic nerves, isolated from control and MTZ-treated pMBP-eGFP-NTR tadpoles, stained with both pan-neurofascin and anti-neurofilament (SMI-31) antibodies. Following 3 d of MTZ treatment, SMI-31+ axons do not appear to be altered (Fig. 4G,H), while numerous neurofascin+ hemiparanodes (Fig. 4F, inset) were observed, indicative of a partial demyelination (Fig. 4F,H). In contrast, untreated transgenic tadpoles showed a complete neurofascin+ nodal staining, i.e., two paranodes on either side of each node of Ranvier (Fig. 4C,E).
The characteristics of demyelination were further investigated using electron microscopy. We counted the number of myelinated axons in the dorsal medulla of control and MTZ-treated transgenic tadpoles at stage 55. Controls showed approximately one third of their axons myelinated (31 ± 2% of axons per section, n = 3800 fibers counted per animal; Fig. 5E,H). In contrast, after 6 d of MTZ treatment, only 7 ± 2% of axons remained wrapped by a myelin sheath (Fig. 5F,H). Tissues from MTZ-treated transgenic tadpoles were also infiltrated by macrophages displaying lipid droplets and phagocyted-myelin debris (Fig. 5F, inset). The morphology of naked axons was however normal, confirming our observation following immunolabeling with SMI31 antibody (Figs. 4G, 5F). Therefore, MTZ treatment of pMBP-eGFP-NTR tadpoles respects axonal integrity, but induces demyelination by apoptotic cell death of oligodendrocytes. This finding led us to analyze the potential for spontaneous repair of oligodendrocytes and myelin in pMBP-eGFP-NTR tadpoles after interruption of the MTZ treatment.
Figure 5.
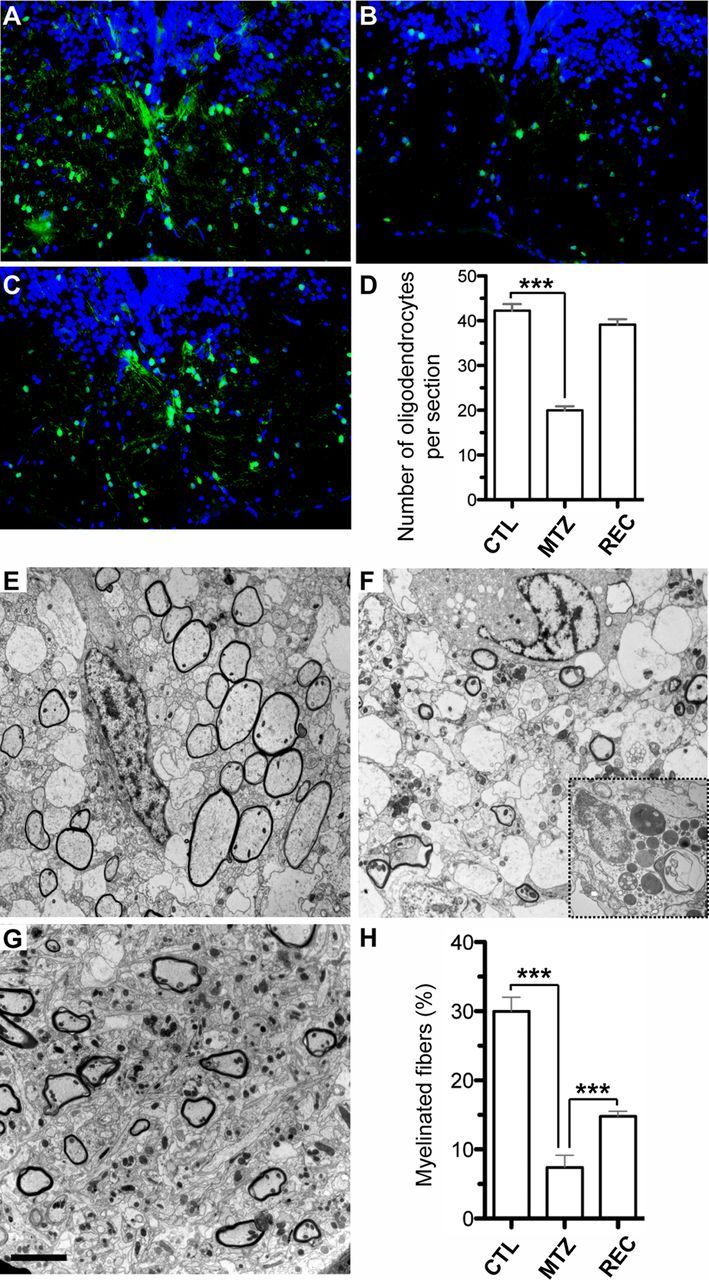
Quantification of oligodendrocyte depletion, demyelination and recovery after cessation of MTZ treatment. A–D, GFP immunostaining of coronal sections across the medulla of stage 55 pMBP-eGFP-NTR tadpoles untreated (A), treated for 6 d with 10 mm MTZ (B), and after 6 d of recovery following treatment cessation (C). D, Quantification of the number of oligodendrocytes (GFP+ cells) per section in control (CTL) MTZ-treated (MTZ) and after recovery (REC) (n = 6 tadpoles for each condition, ***p < 0.0001). E–H, Electron micrograph across the medulla of stage 55 transgenic tadpole untreated (E) or MTZ-treated for 6 d (F). Following MTZ treatment, most of the myelinated fibers disappeared and the demyelinated areas were invaded by macrophages filled with lipid droplets and myelin debris (inset in F). Note the normal morphological appearance of axons in MTZ-treated tadpoles. G, Six days after treatment cessation a large number of axons are remyelinated. H, Quantification of myelinated axons expressed as percentage of total axons (n = 3800 fibers scored per animal, ***p < 0.0001). Scale bar (in G) A–C, 50 μm; E–G, 4 μm; inset (F), 0.4 μm.
Spontaneous remyelination after interruption of the MTZ treatment
Stage 55 pMBP-eGFP-NTR tadpoles were treated for 3 d with 10 mm MTZ and then returned to normal water for 6 d. Animals were then killed for examination of medulla sections either by immunolabeling with anti-GFP antibody or using electron microscopy. As described above, 3 d of MTZ treatment reduced by half the number of oligodendrocytes (Fig. 5A,B,D). After 6 d of recovery, the population of GFP+ cells had however strongly increased and was nearly restored (n = 6 tadpoles, p < 0.0001; Fig. 5C,D). EM examination of tadpoles following 6 d of recovery confirmed a partial remyelination of MTZ-induced demyelinated axons (Fig. 5G,H), in agreement with the return to nearly normal level of the number of GFP+ cells (Fig. 5D). To investigate the potential of spontaneous repair in vivo, stage 55 tadpoles received the same treatment (MTZ 10 mm for 3 d then 6 d in normal water). Each treated tadpole was submitted to repetitive two-photon microscopy examinations. The disappearance and reappearance of GFP+ oligodendrocyte cells was monitored in the same specimen and at the same location along the optic nerve (Fig. 6). Before treatment, in the field illustrated in Figure 6 we focused our observation on 6 GFP+ cells (Fig. 6, T1). After 3 d of MTZ treatment, 3 cells were no longer observed (Fig. 6, T3) and a fourth cell had disappeared on the following observation (Fig. 6, R3). Two cells resisted the MTZ treatment (asterisks). After 3 d of recovery, new GFP+ cells appeared (Fig. 6, R3), and their number progressively increased (Fig. 6, R6). After 6 d of recovery, the number of GFP+ cells was approximately similar to control conditions, indicative of a spontaneous recovery mechanism.
Figure 6.

Live imaging of oligodendrocyte depletion and reappearance following MTZ treatment and cessation. Successive observation of the optic nerve of the same transgenic tadpole by two-photon microscopy. Transgenic tadpoles at stage 55 were treated for 3 d with MTZ (10 mm) (T1, T3), then returned to normal water for 6 d. Observations were before treatment (T1), after 3 d in the presence of MTZ (T3) and during recovery at 3 and 6 d in normal water (R3, R6). White arrows in T1 and T3 point to oligodendrocytes that disappear with MTZ treatment. White asterisks indicate oligodendrocytes that survive the treatment. One cell, which was still seen at T3, had disappeared in R3. In R3, red arrows point to new GFP+ cells that have appeared, during the first 3 d of recovery. Yellow arrows in R6 indicate additional GFP+ cells that have been generated between 3 and 6 d of recovery. Scale bar, 15 μm.
pMBP-eGFP-NTR tadpole as a tool for screening of remyelinating compounds
We then questioned whether we could use this model to screen for molecules favoring de novo oligodendrogenesis and ultimately remyelination. As a proof of concept, we tested the efficiency of retinoic acid (RA), since it has previously been shown to increase myelination and remyelination both in in vivo and ex vivo models (Joubert et al., 2010; Latasa et al., 2010; Huang et al., 2011). In a first set of experiments, pMBP-eGFP-NTR tadpoles at stage 48 were treated with 13-cis-retinoic acid (100 nm). After 3 d of RA treatment, the number of GFP+ cells per optic nerve (16 ± 3, n = 10) was doubled compared with untreated controls (7 ± 2, n = 10), suggesting a strong promoting effect of this retinoid X receptor agonist on oligodendrogenesis. RA acted in a dose-dependent manner, 10 and 50 nm RA resulting in 15 and 20% increase in the number of oligodendrocytes, respectively. Finally, we tested the effect of RA on in vivo remyelination potency. To induce an extensive demyelination, stage 50 pMBP-eGFP-NTR tadpoles were treated with 10 mm MTZ for 11 d. Tadpoles were then treated for 72 h with either 13-cis-retinoic acid (100 nm) or vehicle added to the aquarium water. The effects of MTZ followed by RA treatment were assessed by counting the number of GFP+ oligodendrocytes in the optic nerve (Fig. 7). This longer exposure to MTZ induced a drastic deletion of myelinated oligodendrocytes in the optic nerve, which was further aggravated after 3 d in normal water. In contrast, the number of optic nerve GFP+ cells was increased following a 3 d treatment with RA.
Figure 7.

Retinoic acid improves spontaneous oligodendrocyte recovery. pMBP-eGFP-NTR tadpoles at stage 50 were treated for 11 d with MTZ (10 mm), then put either in fresh water or in water containing 13-cis-retinoic acid (100 nm) for 3 additional days. GFP+ cells were counted in vivo on the optic nerve. Note that in the control animal the number of GFP+ cells continued to decrease even 3 d after cessation of MTZ treatment, in contrast to tadpoles exposed to retinoic acid (n = 6, p < 0.03). *p < 0.05 and ***p < 0.001, significant differences.
Together these results lead us to propose the pMBP-eGFP-NTR transgenic Xenopus line as a new, reliable and convenient model for monitoring the process of oligodendrogenesis in vivo.
Discussion
We have generated a transgenic Xenopus line reliably and specifically expressing the fluorescent reporter GFP fused to a suicide gene in myelinating oligodendrocytes. This transgenic animal should prove useful to investigate myelination and remyelination. To date, the mouse provides the most powerful mammalian model for in vitro and in vivo modeling CNS myelination and remyelination (Jarjour et al., 2012). However, despite impressive improvements, live imaging remains complex and limited, both during early development, since embryogenesis is intrauterine, and during the postnatal period and adulthood due to the opacity of the skull and vertebrae (Fenrich et al., 2012). To circumvent this difficulty, some laboratories have developed transgenic zebrafish to take advantage of the transparency of the embryos, and interesting results have already been reported in this species (Kirby et al., 2006; Czopka and Lyons, 2011; Perlin et al., 2011). However, as far as myelination is concerned, the large difference in myelin protein composition of zebrafish compared with mammals may limit the transposition of data obtained in the zebrafish to higher vertebrates and human, in particular. For instance, in teleosts the major CNS myelin protein is a 36 kDa protein exhibiting no structural homology with any of the known mammalian myelin proteins (Moll et al., 2003). Similarly, bony fish oligodendrocytes (and CNS myelin) express protein zero (P0), a strictly PNS myelin constituent in mammals (Lanwert and Jeserich, 2001).
This situation contrasts with the numerous similarities between mammals and amphibian CNS myelin proteins. For instance, PLP, the most abundant CNS myelin protein that accounts for 50% of total myelin protein, has been shown to bear a high degree of conservation between amphibian and mammalian within the hydrophobic domains (Schliess and Stoffel, 1991; Yoshida and Colman, 1996), and PLP emerged at the root of tetrapods by the acquisition of an enlarged cytoplasmic loop in the evolutionary older DM20 isoform (Möbius et al., 2008). Similarly, in Xenopus as in mammals, alternative transcripts encoding Nogo protein are generated giving rise to Xenopus Nogo-A, -B, and -C (Diekmann et al., 2005). Since Nogo-A is one of the myelin-associated CNS axon growth inhibitor, this observation led the authors to conclude that Nogo-A in Xenopus myelin might contribute to the failure of spinal cord regeneration in frogs, a feature that may have evolved during the transition from fish to land vertebrates. Along the same line, we have been able to use antibodies raised against the mouse pan-neurofascin (NF186 and NF155) to successfully label the nodal and paranodal domains of Xenopus myelinated axons in the optic nerve as described in the mouse (Zonta et al., 2011). Furthermore, not only the coding sequences of myelin protein between mouse and Xenopus are highly conserved, but regulatory sequences are also similar. In the mouse, it has been shown that the −1.9 kb proximal upstream sequence of mouse MBP gene drives specific expression of the transgene in mature oligodendrocytes, but not in Schwann cells (Gow et al., 1992; Stankoff et al., 1996). Here, we show that this 1.9 kb regulatory sequence drives specifically transgene expression in mature oligodendrocytes and not Schwann cells of Xenopus laevis tadpoles. Together, these results consolidate the demonstration that the mouse MBP gene used in the present study contains the regulatory information required for oligodendrocyte-specific expression in tadpole and illustrates a functional conservation between the two species.
The E. coli suicide gene NTR activates the aziridine compound CB1954 (5-aziridin-1-yl-2,4-dinitrobenzamide) into its cytotoxic DNA interstrand cross-linking derivative. Among NTR substrates, MTZ is preferred since its toxic form remains confined to the NTR-expressing cell, allowing the exclusive ablation of NTR+ cells without bystander effects (Bridgewater et al., 1995). This property initially used to eliminate cancer cells (Bridgewater et al., 1995; Bailey et al., 1996) has also been used to conditionally ablate different cell types in transgenic animals. In the mouse, expression of NTR driven by the control elements of the human CD2 locus has allowed to induce an extensive and specific T cell depletion in thymus and spleen (Drabek et al., 1997). More recently, transgenic expression of NTR has been successfully used in zebrafish and Xenopus to induce temporally controlled cell-specific ablation of cardiomyocytes, pancreatic β-cells, hepatocytes and rod photoreceptors (Curado et al., 2007, 2008; Pisharath et al., 2007; Choi et al., 2011). Here, we demonstrate that the same experimental strategy can be exploited to eliminate oligodendrocytes in a temporal- and spatial-specific manner in a transgenic Xenopus tadpole. We also show that the hydroxyamino derivative produced following NTR-catalyzed reduction of MTZ kills cells predominantly by caspase-dependent apoptosis, similar to the mechanism activated by CB 1954, an alternative substrate of NTR (Palmer et al., 2003).
Understanding the molecular mechanisms controlling remyelination of axons in demyelinating diseases, like multiple sclerosis, is of significant clinical interest to define new therapeutic targets aimed at inducing or increasing endogenous repair. The different in vitro strategies to explore myelination and remyelination in rodents have recently been reviewed (Jarjour et al., 2012).
For in vivo studies of demyelination and remyelination, there is a relatively large panel of experimental models in rodents and primates. Experimental autoimmune encephalitis (EAE) is probably the most widely used model for MS, since it associates inflammation and demyelination and mimics immunopathological characteristics found in MS (for recent reviews, see Steinman and Zamvil, 2005; Baker et al., 2011; Batoulis et al., 2011; Constantinescu et al., 2011). Although EAE is far from being a perfect model for MS, most of currently used treatments for MS have been investigated in EAE. To be convincing, studies based on EAE require a large number of animals and are therefore costly and lengthy. This is due to the fact that the localization and size of lesions are not predictable and highly variable between animals and that the lack of reliable in vivo markers limits longitudinal studies of the same animal to evaluate biology of the disease and remyelination. Moreover, the introduction of targeted EAE (Kerschensteiner et al., 2004) has advanced the field being readily applicable in the rat, but more delicate to apply in the mouse (Tepavčević et al., 2011).
In toxin-mediated models, the inflammatory component is less important but the demyelination is localized, therefore facilitating analyses of demyelination and remyelination (Miller and Fyffe-Maricich, 2010). The demyelinating property of lysolecithin was first demonstrated in rat cerebellum myelinating cultures (Perier, 1965), before being used in vivo as demyelinating agent following injection in the white matter of the mouse spinal cord (Hall, 1972). Focal demyelination and remyelination is also observed following ethidium bromide injection. The first reports using ethidium bromide as a demyelinating toxin involved intracisternal injection in the rat (Yajima and Suzuki, 1979) or local injection in the cat spinal cord (Blakemore, 1982). Another widely used model consists in the introduction of cuprizone into the diet of adult mice for several weeks. This treatment results in focal demyelination of the superior cerebellar peduncle and the corpus callosum. When allowed to recover on a normal diet, mice rapidly remyelinate until a complete repair of all axons (Blakemore, 1973; Ludwin, 1978). Despite their considerable advantages compared with EAE models, toxin-mediated models are still quite demanding and not ideally suited for large screening of compounds potentially favoring remyelination.
More recently a novel screening for potential promyelination compounds was developed using laser ablation of GFP-expressing oligodendrocytes in zebrafish larvae (Buckley et al., 2010). However, as stated above, the large differences of myelin constituents usage between teleost and higher vertebrate may be misleading to translate from the zebrafish to human. In this respect, Xenopus tadpole provides a signficant advantage over zebrafish. In addition, and in comparison with other in vivo animal models of demyelination, the NTR suicide gene allows a simple conditional and reversible demyelination. Introduction of the demyelinating agent in the water avoids stereotactic intracerebral or spinal cord injections. In comparison with cuprizone, which is also introduced in the nutrient, MTZ-induced demyelination is much faster (3 d vs 6 weeks) and the extent of demyelination can be monitored from 50% to ∼100% simply by varying the duration of MTZ treatment, between 3 and 11 d, respectively (compare Figs. 3 and 7). Another advantage of our Xenopus model is the rapidity of remyelination, an important criterion for large-scale screening of molecules. Finally, and of particular interest also for screening, amphibian tadpoles can be produced in very large numbers (thousands of transparent embryos, which develop in water).
In conclusion, the pMBP-eGFP-NTR Xenopus described here should prove useful, not only to identify either new therapeutics targeted at promoting myelin repair or reprofiling currently available drugs, but also to exploit the transparent feature of the tadpoles to visualize and record the process and mechanisms of myelination, demyelination and remyelination in vivo.
Footnotes
This work was supported by the CNRS (B.D., A. Mazabraud, B.Z.), Inserm (B.Z., J.-L.T.), UPMC (B.Z., J.-L.T.), the Ville de Paris, Région Ile de France, Medicen, and the Ministry of Industry through the AMBRe consortium (B.D., B.Z. and A. Mazabraud). F.K. was supported by a fellowship from the Fondation ARSEP (Fondation pour l'Aide à la Recherche sur la Sclérose En Plaques) and A. Mazabraud by a fellowship from the Fondation pour la Recherche Médicale. P.J.B. was on sabbatical leave and supported by a grant provided by the Ecole des Neurosciences de Paris and the Wellcome Trust. We thank Dr. S. Nagata for the gift of monoclonal antibody against Xenopus MBP and Dr. A. Gow for providing us with the pMG2 plasmid. The Nkx2.2 antibody, developed by T. M. Jessell and S. Brenner-Morton, was obtained from the Developmental Studies Hybridoma Bank developed under the auspices of the NICHD and maintained by the University of Iowa, Department of Biological Sciences, Iowa City, IA.
This paper is dedicated to the memory of the late Pr. David R. Colman and of Pr. Maurice Wegnez who initiated this work. We Are grateful to Dr. François Tiaho for introducing and encouraging us to use two-photon microscopy for live imaging of tadpoles, Aurelien Dauphin from our imaging facility, PICPS, for his precious help, Chistophe De Medeiros for animal care, and Muriel Perron for helpful discussions.
Dr. Barbara Demeneix is a founder of the company WatchFrog and Dr. David DuPasquier is an employee of WatchFrog.
References
- Ainger K, Avossa D, Diana AS, Barry C, Barbarese E, Carson JH. Transport and localization elements in myelin basic protein mRNA. J Cell Biol. 1997;138:1077–1087. doi: 10.1083/jcb.138.5.1077. [DOI] [PMC free article] [PubMed] [Google Scholar]
- Bailey SM, Knox RJ, Hobbs SM, Jenkins TC, Mauger AB, Melton RG, Burke PJ, Connors TA, Hart IR. Investigation of alternative prodrugs for use with E. coli nitroreductase in ‘suicide gene’ approaches to cancer therapy. Gene Ther. 1996;3:1143–1150. [PubMed] [Google Scholar]
- Baker D, Gerritsen W, Rundle J, Amor S. Critical appraisal of animal models of multiple sclerosis. Mult Scler. 2011;17:647–657. doi: 10.1177/1352458511398885. [DOI] [PubMed] [Google Scholar]
- Batoulis H, Recks MS, Addicks K, Kuerten S. Experimental autoimmune encephalomyelitis—achievements and prospective advances. APMIS. 2011;119:819–830. doi: 10.1111/j.1600-0463.2011.02794.x. [DOI] [PubMed] [Google Scholar]
- Bhat RV, Axt KJ, Fosnaugh JS, Smith KJ, Johnson KA, Hill DE, Kinzler KW, Baraban JM. Expression of the APC tumor suppressor protein in oligodendroglia. Glia. 1996;17:169–174. doi: 10.1002/(SICI)1098-1136(199606)17:2<169::AID-GLIA8>3.0.CO;2-Y. [DOI] [PubMed] [Google Scholar]
- Blakemore WF. Remyelination of the superior cerebellar peduncle in the mouse following demyelination induced by feeding cuprizone. J Neurol Sci. 1973;20:73–83. doi: 10.1016/0022-510x(73)90119-6. [DOI] [PubMed] [Google Scholar]
- Blakemore WF. Ethidium bromide induced demyelination in the spinal cord of the cat. Neuropathol Appl Neurobiol. 1982;8:365–375. doi: 10.1111/j.1365-2990.1982.tb00305.x. [DOI] [PubMed] [Google Scholar]
- Bridgewater JA, Springer CJ, Knox RJ, Minton NP, Michael NP, Collins MK. Expression of the bacterial nitroreductase enzyme in mammalian cells renders them selectively sensitive to killing by the prodrug CB1954. Eur J Cancer. 1995;31A:2362–2370. doi: 10.1016/0959-8049(95)00436-x. [DOI] [PubMed] [Google Scholar]
- Buckley CE, Marguerie A, Roach AG, Goldsmith P, Fleming A, Alderton WK, Franklin RJ. Drug reprofiling using zebrafish identifies novel compounds with potential pro-myelination effects. Neuropharmacology. 2010;59:149–159. doi: 10.1016/j.neuropharm.2010.04.014. [DOI] [PubMed] [Google Scholar]
- Chesneau A, Sachs LM, Chai N, Chen Y, Du Pasquier L, Loeber J, Pollet N, Reilly M, Weeks DL, Bronchain OJ. Transgenesis procedures in Xenopus. Biol Cell. 2008;100:503–521. doi: 10.1042/BC20070148. [DOI] [PMC free article] [PubMed] [Google Scholar]
- Choi RY, Engbretson GA, Solessio EC, Jones GA, Coughlin A, Aleksic I, Zuber ME. Cone degeneration following rod ablation in a reversible model of retinal degeneration. Invest Ophthalmol Vis Sci. 2011;52:364–373. doi: 10.1167/iovs.10-5347. [DOI] [PMC free article] [PubMed] [Google Scholar]
- Cima C, Grant P. Development of the optic nerve in Xenopus laevis. II. Gliogenesis, myelination and metamorphic remodelling. J Embryol Exp Morphol. 1982;72:251–267. [PubMed] [Google Scholar]
- Constantinescu CS, Farooqi N, O'Brien K, Gran B. Experimental autoimmune encephalomyelitis (EAE) as a model for multiple sclerosis (MS) Br J Pharmacol. 2011;164:1079–1106. doi: 10.1111/j.1476-5381.2011.01302.x. [DOI] [PMC free article] [PubMed] [Google Scholar]
- Curado S, Anderson RM, Jungblut B, Mumm J, Schroeter E, Stainier DY. Conditional targeted cell ablation in zebrafish: a new tool for regeneration studies. Dev Dyn. 2007;236:1025–1035. doi: 10.1002/dvdy.21100. [DOI] [PubMed] [Google Scholar]
- Curado S, Stainier DY, Anderson RM. Nitroreductase-mediated cell/tissue ablation in zebrafish: a spatially and temporally controlled ablation method with applications in developmental and regeneration studies. Nat Protoc. 2008;3:948–954. doi: 10.1038/nprot.2008.58. [DOI] [PMC free article] [PubMed] [Google Scholar]
- Czopka T, Lyons DA. Dissecting mechanisms of myelinated axon formation using zebrafish. Methods Cell Biol. 2011;105:25–62. doi: 10.1016/B978-0-12-381320-6.00002-3. [DOI] [PubMed] [Google Scholar]
- de Luze A, Sachs L, Demeneix B. Thyroid hormone-dependent transcriptional regulation of exogenous genes transferred into Xenopus tadpole muscle in vivo. Proc Natl Acad Sci U S A. 1993;90:7322–7326. doi: 10.1073/pnas.90.15.7322. [DOI] [PMC free article] [PubMed] [Google Scholar]
- Denarier E, Forghani R, Farhadi HF, Dib S, Dionne N, Friedman HC, Lepage P, Hudson TJ, Drouin R, Peterson A. Functional organization of a Schwann cell enhancer. J Neurosci. 2005;25:11210–11217. doi: 10.1523/JNEUROSCI.2596-05.2005. [DOI] [PMC free article] [PubMed] [Google Scholar]
- De Smet F, Carmeliet P, Autiero M. Fishing and frogging for anti-angiogenic drugs. Nat Chem Biol. 2006;2:228–229. doi: 10.1038/nchembio0506-228. [DOI] [PubMed] [Google Scholar]
- Diekmann H, Klinger M, Oertle T, Heinz D, Pogoda HM, Schwab ME, Stuermer CA. Analysis of the reticulon gene family demonstrates the absence of the neurite growth inhibitor Nogo-A in fish. Mol Biol Evol. 2005;22:1635–1648. doi: 10.1093/molbev/msi158. [DOI] [PubMed] [Google Scholar]
- Drabek D, Guy J, Craig R, Grosveld F. The expression of bacterial nitroreductase in transgenic mice results in specific cell killing by the prodrug CB1954. Gene Ther. 1997;4:93–100. doi: 10.1038/sj.gt.3300366. [DOI] [PubMed] [Google Scholar]
- Eng LF, Vanderhaeghen JJ, Bignami A, Gerstl B. An acidic protein isolated from fibrous astrocytes. Brain Res. 1971;28:351–354. doi: 10.1016/0006-8993(71)90668-8. [DOI] [PubMed] [Google Scholar]
- Fenrich KK, Weber P, Hocine M, Zalc M, Rougon G, Debarbieux F. Long-term in vivo imaging of normal and pathological mouse spinal cord with subcellular resolution using implanted glass windows. J Physiol. 2012;590:3665–3675. doi: 10.1113/jphysiol.2012.230532. [DOI] [PMC free article] [PubMed] [Google Scholar]
- Geisler S, Heilmann H, Veh RW. An optimized method for simultaneous demonstration of neurons and myelinated fiber tracts for delineation of individual trunco- and palliothalamic nuclei in the mammalian brain. Histochem Cell Biol. 2002;117:69–79. doi: 10.1007/s00418-001-0357-z. [DOI] [PubMed] [Google Scholar]
- Giacomotto J, Ségalat L. High-throughput screening and small animal models, where are we? Br J Pharmacol. 2010;160:204–216. doi: 10.1111/j.1476-5381.2010.00725.x. [DOI] [PMC free article] [PubMed] [Google Scholar]
- Gow A, Friedrich VL, Jr, Lazzarini RA. Myelin basic protein gene contains separate enhancers for oligodendrocyte and Schwann cell expression. J Cell Biol. 1992;119:605–616. doi: 10.1083/jcb.119.3.605. [DOI] [PMC free article] [PubMed] [Google Scholar]
- Graus F, Ferrer I. Analysis of a neuronal antigen (Hu) expression in the developing rat brain detected by autoantibodies from patients with paraneoplastic encephalomyelitis. Neurosci Lett. 1990;112:14–18. doi: 10.1016/0304-3940(90)90314-y. [DOI] [PubMed] [Google Scholar]
- Hall SM. The effect of injections of lysophosphatidyl choline into white matter of the adult mouse spinal cord. J Cell Sci. 1972;10:535–546. doi: 10.1242/jcs.10.2.535. [DOI] [PubMed] [Google Scholar]
- Howell OW, Palser A, Polito A, Melrose S, Zonta B, Scheiermann C, Vora AJ, Brophy PJ, Reynolds R. Disruption of neurofascin localization reveals early changes preceding demyelination and remyelination in multiple sclerosis. Brain. 2006;129:3173–3185. doi: 10.1093/brain/awl290. [DOI] [PubMed] [Google Scholar]
- Huang JK, Jarjour AA, Nait Oumesmar B, Kerninon C, Williams A, Krezel W, Kagechika H, Bauer J, Zhao C, Evercooren AB, Chambon P, Ffrench-Constant C, Franklin RJ. Retinoid X receptor gamma signaling accelerates CNS remyelination. Nat Neurosci. 2011;14:45–53. doi: 10.1038/nn.2702. [DOI] [PMC free article] [PubMed] [Google Scholar]
- Jarjour AA, Zhang H, Bauer N, Ffrench-Constant C, Williams A. In vitro modeling of central nervous system myelination and remyelination. Glia. 2012;60:1–12. doi: 10.1002/glia.21231. [DOI] [PubMed] [Google Scholar]
- Joubert L, Foucault I, Sagot Y, Bernasconi L, Duval F, Alliod C, Frossard MJ, Pescini Gobert R, Curchod ML, Salvat C, Nichols A, Pouly S, Rommel C, Roach A, Hooft van Huijsduijnen R. Chemical inducers and transcriptional markers of oligodendrocyte differentiation. J Neurosci Res. 2010;88:2546–2557. doi: 10.1002/jnr.22434. [DOI] [PubMed] [Google Scholar]
- Kanfer J, Parenty M, Goujet-Zalc C, Monge M, Bernier L, Campagnoni AT, Dautigny A, Zalc B. Developmental expression of myelin proteolipid, basic protein, and 2′,3′-cyclic nucleotide 3′-phosphodiesterase transcripts in different rat brain regions. J Mol Neurosci. 1989;1:39–46. doi: 10.1007/BF02896855. [DOI] [PubMed] [Google Scholar]
- Kerschensteiner M, Stadelmann C, Buddeberg BS, Merkler D, Bareyre FM, Anthony DC, Linington C, Brück W, Schwab ME. Targeting experimental autoimmune encephalomyelitis lesions to a predetermined axonal tract system allows for refined behavioral testing in an animal model of multiple sclerosis. Am J Pathol. 2004;164:1455–1469. doi: 10.1016/S0002-9440(10)63232-4. [DOI] [PMC free article] [PubMed] [Google Scholar]
- Kirby BB, Takada N, Latimer AJ, Shin J, Carney TJ, Kelsh RN, Appel B. In vivo time-lapse imaging shows dynamic oligodendrocyte progenitor behavior during zebrafish development. Nat Neurosci. 2006;9:1506–1511. doi: 10.1038/nn1803. [DOI] [PubMed] [Google Scholar]
- Kroll KL, Amaya E. Transgenic Xenopus embryos from sperm nuclear transplantations reveal FGF signaling requirements during gastrulation. Development. 1996;122:3173–3183. doi: 10.1242/dev.122.10.3173. [DOI] [PubMed] [Google Scholar]
- Lanwert C, Jeserich G. Structure, heterologous expression, and adhesive properties of the P(0)-like myelin glycoprotein IP1 of trout CNS. Microsc Res Tech. 2001;52:637–644. doi: 10.1002/jemt.1048. [DOI] [PubMed] [Google Scholar]
- Latasa MJ, Ituero M, Moran-Gonzalez A, Aranda A, Cosgaya JM. Retinoic acid regulates myelin formation in the peripheral nervous system. Glia. 2010;58:1451–1464. doi: 10.1002/glia.21020. [DOI] [PubMed] [Google Scholar]
- Ludwin SK. Central nervous system demyelination and remyelination in the mouse: an ultrastructural study of cuprizone toxicity. Lab Invest. 1978;39:597–612. [PubMed] [Google Scholar]
- Miller RH, Fyffe-Maricich SL. Restoring the balance between disease and repair in multiple sclerosis: insights from mouse models. Dis Model Mech. 2010;3:535–539. doi: 10.1242/dmm.001958. [DOI] [PMC free article] [PubMed] [Google Scholar]
- Möbius W, Patzig J, Nave KA, Werner HB. Phylogeny of proteolipid proteins: divergence, constraints, and the evolution of novel functions in myelination and neuroprotection. Neuron Glia Biol. 2008;4:111–127. doi: 10.1017/S1740925X0900009X. [DOI] [PubMed] [Google Scholar]
- Moll W, Lanwert C, Stratmann A, Strelau J, Jeserich G. Molecular cloning, tissue expression, and partial characterization of the major fish CNS myelin protein 36k. Glia. 2003;44:57–66. doi: 10.1002/glia.10269. [DOI] [PubMed] [Google Scholar]
- Nieuwkoop PD, Faber J. Normal Table of Xenopus laevis (Daudin) New York: Garland Publishing; 1994. [Google Scholar]
- Palmer DH, Milner AE, Kerr DJ, Young LS. Mechanism of cell death induced by the novel enzyme-prodrug combination, nitroreductase/CB1954, and identification of synergism with 5-fluorouracil. Br J Cancer. 2003;89:944–950. doi: 10.1038/sj.bjc.6601211. [DOI] [PMC free article] [PubMed] [Google Scholar]
- Perier O. [Demyelinization of central nervous tissue cultures by lysolecithin] Acta Neurol Belg. 1965;65:78–95. [PubMed] [Google Scholar]
- Perlin JR, Lush ME, Stephens WZ, Piotrowski T, Talbot WS. Neuronal Neuregulin 1 type III directs Schwann cell migration. Development. 2011;138:4639–4648. doi: 10.1242/dev.068072. [DOI] [PMC free article] [PubMed] [Google Scholar]
- Pernet V, Joly S, Christ F, Dimou L, Schwab ME. Nogo-A and myelin-associated glycoprotein differently regulate oligodendrocyte maturation and myelin formation. J Neurosci. 2008;28:7435–7444. doi: 10.1523/JNEUROSCI.0727-08.2008. [DOI] [PMC free article] [PubMed] [Google Scholar]
- Pisharath H, Rhee JM, Swanson MA, Leach SD, Parsons MJ. Targeted ablation of beta cells in the embryonic zebrafish pancreas using E. coli nitroreductase. Mech Dev. 2007;124:218–229. doi: 10.1016/j.mod.2006.11.005. [DOI] [PMC free article] [PubMed] [Google Scholar]
- Saito RM, van den Heuvel S. Malignant worms: what cancer research can learn from C. elegans. Cancer Invest. 2002;20:264–275. doi: 10.1081/cnv-120001153. [DOI] [PubMed] [Google Scholar]
- Schliess F, Stoffel W. Evolution of the myelin integral membrane proteins of the central nervous system. Biol Chem Hoppe Seyler. 1991;372:865–874. doi: 10.1515/bchm3.1991.372.2.865. [DOI] [PubMed] [Google Scholar]
- Soula C, Danesin C, Kan P, Grob M, Poncet C, Cochard P. Distinct sites of origin of oligodendrocytes and somatic motoneurons in the chick spinal cord: oligodendrocytes arise from Nkx2.2-expressing progenitors by a Shh-dependent mechanism. Development. 2001;128:1369–1379. doi: 10.1242/dev.128.8.1369. [DOI] [PubMed] [Google Scholar]
- Sparrow DB, Latinkic B, Mohun TJ. A simplified method of generating transgenic Xenopus. Nucleic Acids Res. 2000;28:E12. doi: 10.1093/nar/28.4.e12. [DOI] [PMC free article] [PubMed] [Google Scholar]
- Stankoff B, Demerens C, Goujet-Zalc C, Monge M, Peyron F, Mikoshiba K, Zalc B, Lubetzki C. Transcription of myelin basic protein promoted by regulatory elements in the proximal 5′ sequence requires myelinogenesis. Mult Scler. 1996;2:125–132. doi: 10.1177/135245859600200302. [DOI] [PubMed] [Google Scholar]
- Steinman L, Zamvil SS. Virtues and pitfalls of EAE for the development of therapies for multiple sclerosis. Trends Immunol. 2005;26:565–571. doi: 10.1016/j.it.2005.08.014. [DOI] [PubMed] [Google Scholar]
- Tepavčević V, Lazarini F, Alfaro-Cervello C, Kerninon C, Yoshikawa K, Garcia-Verdugo JM, Lledo PM, Nait-Oumesmar B, Baron-Van Evercooren A. Inflammation-induced subventricular zone dysfunction leads to olfactory deficits in a targeted mouse model of multiple sclerosis. J Clin Invest. 2011;121:4722–4734. doi: 10.1172/JCI59145. [DOI] [PMC free article] [PubMed] [Google Scholar]
- Yajima K, Suzuki K. Demyelination and remyelination in the rat central nervous system following ethidium bromide injection. Lab Invest. 1979;41:385–392. [PubMed] [Google Scholar]
- Yoshida M. Oligodendrocyte maturation in Xenopus laevis. J Neurosci Res. 1997;50:169–176. doi: 10.1002/(SICI)1097-4547(19971015)50:2<169::AID-JNR6>3.0.CO;2-D. [DOI] [PubMed] [Google Scholar]
- Yoshida M, Colman DR. Parallel evolution and coexpression of the proteolipid proteins and protein zero in vertebrate myelin. Neuron. 1996;16:1115–1126. doi: 10.1016/s0896-6273(00)80138-5. [DOI] [PubMed] [Google Scholar]
- Yoshida M, Macklin WB. Oligodendrocyte development and myelination in GFP-transgenic zebrafish. J Neurosci Res. 2005;81:1–8. doi: 10.1002/jnr.20516. [DOI] [PubMed] [Google Scholar]
- Zalc B, Colman DR. Origins of vertebrate success. Science. 2000;288:271–272. doi: 10.1126/science.288.5464.271c. [DOI] [PubMed] [Google Scholar]
- Zalc B, Goujet D, Colman D. The origin of the myelination program in vertebrates. Curr Biol. 2008;18:R511–R512. doi: 10.1016/j.cub.2008.04.010. [DOI] [PubMed] [Google Scholar]
- Zonta B, Tait S, Melrose S, Anderson H, Harroch S, Higginson J, Sherman DL, Brophy PJ. Glial and neuronal isoforms of Neurofascin have distinct roles in the assembly of nodes of Ranvier in the central nervous system. J Cell Biol. 2008;181:1169–1177. doi: 10.1083/jcb.200712154. [DOI] [PMC free article] [PubMed] [Google Scholar]
- Zonta B, Desmazieres A, Rinaldi A, Tait S, Sherman DL, Nolan MF, Brophy PJ. A critical role for Neurofascin in regulating action potential initiation through maintenance of the axon initial segment. Neuron. 2011;69:945–956. doi: 10.1016/j.neuron.2011.02.021. [DOI] [PMC free article] [PubMed] [Google Scholar]