Abstract
Objective
To characterize the lower-extremity biomechanics associated with stepping activities in older adults.
Design
Repeated-measures comparison of kinematics and kinetics associated with forward step-up and lateral step-up activities.
Background
Biomechanical analysis may be used to assess the effectiveness of various ‘in-home activities’ in targeting appropriate muscle groups and preserving functional strength and power in elders.
Methods
Data were analyzed from 21 participants (mean 74.7 yr (standard deviation, 4.4 yr)) who performed the forward and lateral step-up activities while instrumented for biomechanical analysis. Motion analysis equipment, inverse dynamics equations, and repeated measures anovas were used to contrast the maximum joint angles, peak net joint moments, angular impulse, work, and power associated with the activities.
Results
The lateral step-up resulted in greater maximum knee flexion (P < 0.001) and ankle dorsiflexion angles (P < 0.01). Peak joint moments were similar between exercises. The forward step-up generated greater peak hip power (P < 0.05) and total work (P < 0.001); whereas, the lateral step-up generated greater impulse (P < 0.05), work (P < 0.01), and power (P < 0.05) at the knee and ankle.
Conclusions
In older adults, the forward step-up places greater demand on the hip extensors, while lateral step-up places greater demand on the knee extensors and ankle plantar flexors.
Keywords: Resistance exercise, Kinetics, Kinematics, Older adults
1. Introduction
Because age-related declines in physical strength and function compromise independence and life quality in older adults, the preservation of strength and physical performance is of growing concern. To address this concern, geriatricians and exercise specialists are examining the efficacy, adherence, and safety of several novice exercise activities and programs in elders, including Tai Chi (Li et al., 2001; Lan et al., 1998), weighted vest exercise (Greendale et al., 2000; Shaw and Snow, 1998; Snow et al., 2000), squatting activities (Flanagan et al., in press), and stepping/stair climbing programs (Shaw and Snow, 1998; Cress et al., 1996; Bean et al., 2002).
Stepping exercises may be especially appropriate for older adults because: (1) they utilize movement patterns that are similar to those used in stair climbing (a common activity of daily living), (2) they are accessible to elders and can be performed in the home, (3) they are relatively safe and can be performed without supervision, and (4) the exercise intensity can be adjusted by varying step height and by wearing a weighted vest. Reports from recent, relatively small, randomized clinical trials (n ≤ 45) suggest that exercise programs that include weighted step-up exercises and/or stair-climbing activities can improve lower-extremity strength, muscle power, and bone health in elders (Shaw and Snow, 1998; Cress et al., 1996; Bean et al., 2002).
Step-up activities may be performed using a variety of techniques and equipment. For example, step-up exercises can be performed: (1) using aerobic (Worrell et al., 1993; Scharff-Olson et al., 1996) or classic ‘weightlifting’ (Shaw and Snow, 1998; Snow et al., 2000) techniques, (2) using forward step-up (FS) or lateral step-up (LS) motions (Worrell et al., 1993; Scharff-Olson et al., 1996; Cook et al., 1992), and (3) using a step-bench (Shaw and Snow, 1998; Snow et al., 2000) or a flight of stairs (Cress et al., 1996; Bean et al., 2002). In regards to exercise participation and equipment accessibility, however, bench step exercise is likely to be more applicable for older adults than stair-climbing exercise because many elders do not have a flight of stairs within their home.
To date, lower-extremity kinematic and kinetic comparisons of these varied techniques have not been performed in older adults, although this type of analysis may be used to assess the effectiveness of various stepping activities in targeting appropriate joints and muscle groups. Rather, biomechanical investigations of stepping activities have primarily focused on landing phase reaction forces during aerobic bench-stepping activities in younger adults. These studies revealed that bench-stepping reaction forces were influenced by stepping speed, step height, and participant experience, but not bench step material properties (Scharff-Olson et al., 1996; Salem et al., 2000).
Although these analyses have helped characterize the influence of various training protocols and equipment designs on the impact forces generated during stepping exercise, none quantified the relative contributions of lower-extremity muscle groups during various stepping activities. Cook and colleagues attempted to address this issue using electromyographic analyses while comparing LS and “stepping machine” exercises (Cook et al., 1992). Their findings suggested that muscle recruitment patterns were exercise specific, and that clinicians could modulate their treatment approach (aggressive vs. conservative) by selecting one or the other exercise variants. The assessment of equipment not readily accessible to older adults (i.e. stair climber) renders it difficult to extrapolate their conclusions to older adults performing stepping activities in a home environment. Moreover, extrapolation of data collected from younger subjects to older participants may be misleading because age-related changes in muscle mass, fiber type, and force-producing characteristics may affect stepping performance, and lower-extremity kinematics and kinetics.
The purpose of this investigation was to characterize the lower-extremity biomechanics of older adults during the performance of two common stepping maneuvers, the FS and LS. We hypothesized that differences would exist in our primary outcome measures, peak extensor moments and peak joint powers, between the two movement patterns. Secondary analyses included comparisons of angular excursions, angular extensor impulse, and work. This discriminant analysis may be used to generate biomechanical profiles of the exercises, to be used by physicians, therapists, and exercise specialists, when designing safe and efficient activity programs for elders. This study is part of a series of biomechanical investigations characterizing resistance exercises designed to preserve physical function in older adults.
2. Methods
Nine male and 13 female older adults (70–85 yr) were recruited for this investigation and instrumented for biomechanical analysis. The participants, selected from the greater Los Angeles area, can be described as a relatively healthy, independent, and predominantly white, group of older adults. Potential subjects were screened, using: (1) a self-administered medical history form, (2) a previously published physical activity questionnaire, AADLHES (Reuben et al., 1990), (3) bone scans of their lumbar spine and dominant hip joint using dual-energy X-ray absorptiometry (DEXA, Hologic QDR1500, Waltham, MA, USA), and (4) a physician’s ‘clearance to participate’ letter.
Only subjects who were not frequent exercisers were included in the study. Non-frequent exercisers were selected because we believe this cohort is likely to benefit most from ‘in-home’ exercise programs. The non-frequent exercises were defined as people who did not participate in active sports (e.g. aerobics, jogging and tennis) and who did not walk more than a mile without resting three or more times per week (Reuben et al., 1990). Medical exclusion criteria included: (1) neurological diseases such as stroke, polio, Parkinson’s disease, dementia or uncontrolled seizures; (2) musculoskeletal disorders such as osteoporosis (T-score < −2.5), joint arthroplasty, current injury, pain in lower extremities or back, rheumatoid arthritis, polymyalgia rheumatica, balance disturbance, or the need for an assistive device; and (3) cardiovascular disorders such as known angina or coronary heart disease, congestive heart failure, systolic blood pressure greater than 160 mmHg or diastolic blood pressure greater than 95 mmHg. The study protocol was approved by Institutional Review Board of University of Southern California and consent from all participants was obtained.
The participants performed several exercise activities, over four laboratory visits, while instrumented for biomechanical analysis. All exercises could be performed in the home and required a minimum of equipment and supervision. Exercise activities included variations of stepping, squatting, lunging, and heel raise maneuvers. Previously we characterized and contrasted the biomechanics and muscle recruitment patterns associated with two types of squatting activities (Flanagan et al., in press). In the present investigation we examined two common stepping activities, the FS and the LS.
Fourteen reflective markers (2.5 cm spheres) were placed bilaterally over the following anatomical landmarks: heels, second and fifth metatarsal heads, lateral malleoli, lateral epicondyles of the femur, and posterior superior iliac spines. Two markers were also placed 10 cm posterolateral to the anterior superior iliac spines (ASIS), within the transverse plane at the level of the ASIS. Four 5 cm wands with a marker on each were also taped to the lateral thighs and shanks. Holes were created in the short pants the subjects wore in order to permit marker placement and all markers were firmly taped to the skin.
A 6-camera motion analysis system (Vicon 370, Oxford Metrics, Oxford, UK) was used to collect the lowerextremity kinematic data at a 60 Hz sampling frequency. Ground reaction forces (GRFs) were recorded from a force platform, embedded into a step, at 1200 Hz (Model #OR6-6-1, AMTI, Watertown, MA, USA). Three-dimensional kinematics were quantified using methods described by Kadaba et al. (1990) and Davis et al. (1991). Three-dimensional joint kinetics were calculated using methods described by Kadaba et al. (1987) using published anthropometric data (Winter, 1990). Data processing software, Workstation (Oxford Metrics, Oxford, UK) and Datapac 2000 (RUN Technologies Co., Laguna Hills, CA, USA) were used for all calculations.
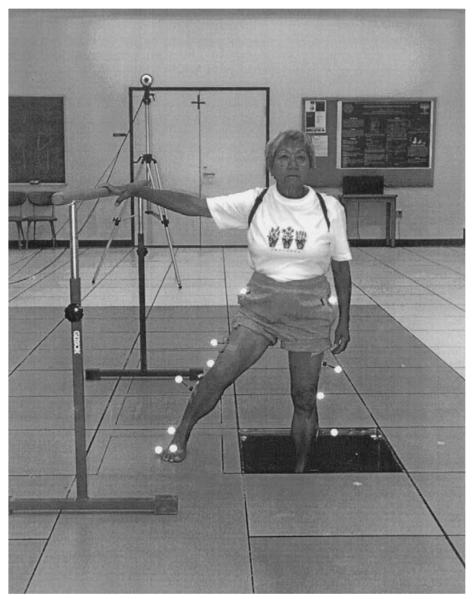
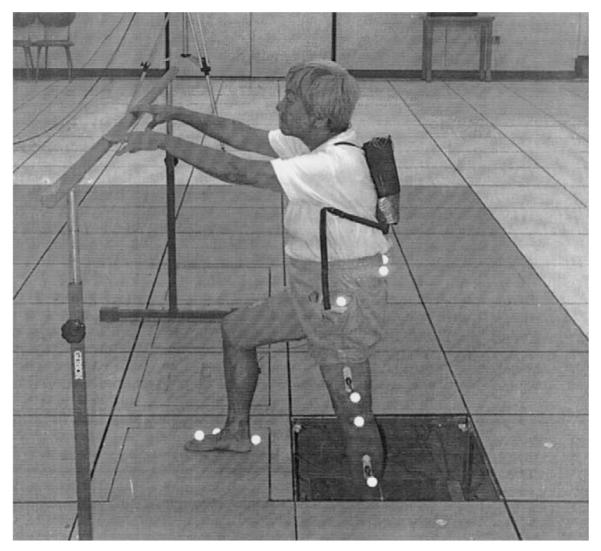
Research associates instructed the participants in the performance of the FS (Fig. 1) and LS (Fig. 2) activities during their first laboratory visit. A detailed handout of the exercise instructions was also provided. Instructions for FS were developed from published techniques (Holcomb, 2000) and were modified for the LS (see below). The participants then practiced the stepping activities at home until their next laboratory visit, one to two weeks later. During their next laboratory visit, participants were instrumented for biomechanical analysis. They randomly performed three trials each of FS and LS at a self-selected pace (step height: 21 cm). For the FS, subjects were initially positioned at a depth 21 cm below the floor surface, facing the force platform. The foot of their dominant leg (the one that they would use to kick a ball) was placed entirely on the force platform. Subjects then shifted their weight to the dominant leg and forcefully extended the lead hip and knee to move the body to a standing position on top of the force platform. Subjects were instructed not to push-off or hop with their non-dominant (trailing) leg. Once atop the force platform, subjects paused briefly before their descent. For the descending phase, the subjects again shifted their weight to the dominant leg and stepped off of the force platform with the non-dominant leg. Once the non-dominant leg was in the starting position, subjects stepped off of the force platform with their dominant leg and placed it alongside the non-dominant limb in the starting position. The instructions for the LS were identical, with the exception that the subjects faced 90° from the force platform with their dominant leg closest to the force platform. They maintained this orientation throughout the movement. All biomechanical measures were collected for the dominant limb (i.e. the leading limb during the ascending phase and the trailing limb during the descending phase). During data collection, a safety bar was also provided to assist participants if they lost their balance; they were instructed; however, not to use the bar to assist their movement. Post hoc analysis revealed that the maximum vertical GRFs on the safety bar, among all trials, were small (less than 2% BW) for all but four subjects. The remaining four subjects generated maximum GRFs, among all trials, that averaged 4.8% BW. Maximum safety bar GRF trials occurred during both FS and LS activities and there were no identifiable trends in the data.
Fig. 1.
The forward stepping exercise, performed while the participant is instrumented for biomechanical analysis.
Fig. 2.
The lateral stepping exercise, performed while the participant is instrumented for biomechanical analysis.
The average values of the maximum ankle, knee, and hip sagittal-plane joint angles, net extensor moments, powers, total work, and total extensor angular impulse, obtained over the three trials, were used for the statistical analysis. Hip moments at the coronal plane were also quantified. The extensor moments and powers were further divided into ascending (predominately concentric) and descending (predominately eccentric) phases based on the minimum knee flexion angle obtained during each trial. The total work was calculated as the absolute integrated amplitude of the power curve. The extensor angular impulse was calculated as the integrated amplitude of the extensor net joint moment curve. A support impulse, calculated as the sum of the hip, knee, and ankle extensor impulses, was also generated. Although all statistical analyses were based upon individual kinematic and kinetic data, ensemble average joint moment and power curves were produced in order to qualitatively examine the mean moment and power patterns generated during the step-up activities (Figs. 3-5). For this qualitative examination, the data were normalized so that 100% of the movement occurred when the subjects returned to the starting position.
Fig. 3.
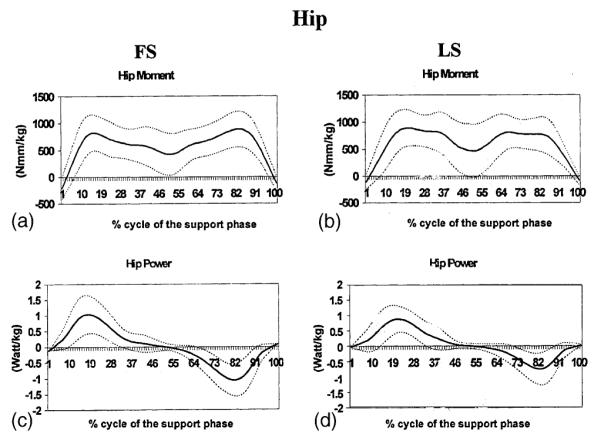
Ensemble average kinetic records for the hip during forward stepping (FS) (a&c) and lateral stepping (LS) (b&d) normalized to 100% of the movement cycle. Kinetic records include data from 21 subjects and 3 exercise trials per subject. (a,b) Sagittal plane moments in N mm/kg; (c,d) power in W/kg.
Fig. 5.
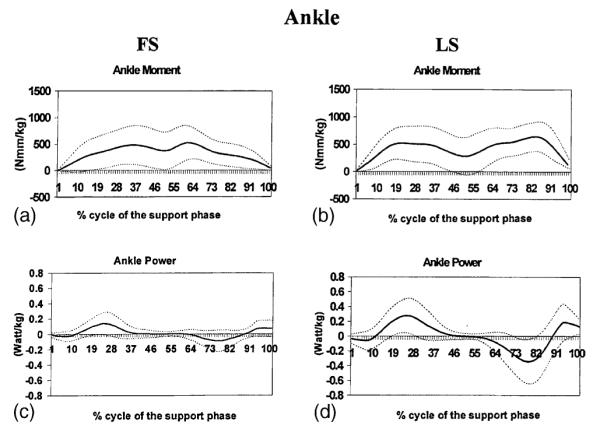
Ensemble average kinetic records for the ankle during forward stepping (FS) (a&c) and lateral stepping (LS) (b&d) normalized to 100% of the movement cycle. Kinetic records include data from 21 subjects and 3 exercise trials per subject. (a,b) Sagittal plane moments in N mm/kg; (c,d) power in W/kg.
All statistical procedures were employed using SPSS software version 10.0. Data were examined for ‘outliers’ and subjects with data values greater than three times the interquartile range (25–75%) above or below the 75th and 25th percentile, respectively, for any variable, were removed from further statistical analysis. Based upon these ‘outlier’ criteria a single participant’s data were removed from statistical analysis. Thus, data from a total of 21 participants (Table 1) were statistically examined. Two-factor anovas (activity type × phase) with repeated measures were conducted to assess the differences in the mean values of the peak net joint moments and powers at each joint, between the two stepping conditions and muscle actions. If a statistically significant interaction effect was identified with this omnibus test, paired t-tests assessing the difference between the activity types across the ascending and descending phases were conducted. Paired t-tests were also used to examine the differences in our secondary measures, maximum joint angles, total work, and extensor angular impulse between the two stepping activities at each joint.
Table 1.
Demographic and anthropometric characteristics of participants: mean (standard deviation) or percent
| Measurement | Overall | Women | Men |
|---|---|---|---|
| N | 21 | 12 | 9 |
| Age | 74.7 (4.4) | 74.0 (4.5) | 75.6 (4.4) |
| Height (cm) | 164.1 (12.5) | 156.9 (8.2) | 173.6(11.0) |
| Weight (kg) | 68.3 (14.7) | 63.2 (16.7) | 75.0 (8.5) |
| Body mass index (kg/m2) | 25.1 (3.5) | 25.3 (4.4) | 24.9 (2.2) |
| Caucasian | 76.2% | 66.7% | 88.9% |
3. Results
Joint angles
The average maximum knee flexion and ankle dorsiflexion angles obtained during LS were 8.3% (P < 0.01) and 38.4% (P < 0.001) greater than those obtained during FS (Table 2). The average maximum hip flexion angles generated during the exercises were similar (P = 0.09).
Table 2.
Maximum joint angles for the hip, knee, and ankle: all values are maximum sagittal-plane joint angles (degr), generated during performance of the activities, for the dominant limb (standard deviation)
| Measurement | FS | LS |
|---|---|---|
| Hip flexion | 79.2 (9.9) | 74.0 (13.4) |
| Knee flexion | 76.8 (5.6) | 83.2 (6.1)* |
| Ankle dorsiflexion | 23.2 (7.5) | 32.1 (6.1)** |
Statistically significantly different (P < 0.01) from FS.
Statistically significantly different (P < 0.001) from FS.
Joint moments
At the hip, both activities generated biphasic mean sagittal plane extensor moments that peaked at 16% and 82% of the support phase during FS, and 19% and 68% of the support phase during LS (Fig. 3a and b). Similar biphasic knee extensor and ankle plantar flexor moments were also generated (Fig. 4a,b and 5a,b); however, a mean knee flexor moment was generated between approximately 30% and 70% of the support phase during both activities. FS appeared to generate a steeper increase in the hip extensor moment compared to LS; however, LS appeared to generate a steeper ankle plantar flexor moment than FS.
Fig. 4.
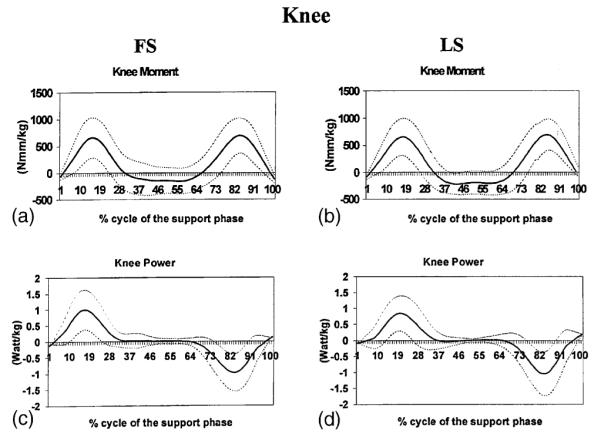
Ensemble average kinetic records for the knee during forward stepping (FS) (a&c) and lateral stepping (LS) (b&d) normalized to 100% of the movement cycle. Kinetic records include data from 21 subjects and 3 exercise trials per subject. (a,b) Sagittal plane moments in N mm/kg; (c,d) power in W/kg.
The anova omnibus test identified a statistically significant interaction among the peak hip extensor moments produced across the step-up conditions and movement phases (P < 0.01). Post hoc analysis revealed that during LS, the average peak hip extensor moment was 12.5% greater during ascent than during descent (P < 0.001). Peak hip extensor moment differences, however, did not exist between step-up conditions (Table 3). Peak coronal plane hip moments were 35–43% of the peak sagittal plane moments and also did not differ between step-up conditions and movement phases.
Table 3.
Peak hip, knee, and ankle joint extensor moments: all values are maximum peak net moments of force normalized to body mass (N m/kg) during the stance phase of the stepping activities for the dominant limb (standard deviation)
| Measurement | FS | LS |
|---|---|---|
| Sagittal plane | ||
| Hip extensor moment | ||
| Ascending | 1.10 (0.32) | 1.17 (0.30) |
| Descending | 1.13 (0.26) | 1.04 (0.29)* |
| Knee extensor moment | ||
| Ascending | 0.91 (0.29) | 0.90 (0.24) |
| Descending | 0.90 (0.31) | 0.90 (0.27) |
| Ankle plantar flexor moment | ||
| Ascending | 0.72 (0.26) | 0.71 (0.21) |
| Descending | 0.73 (0.23) | 0.83 (0.18)* |
| Coronal plane | ||
| Hip abductor moment | ||
| Ascending | 0.66 (0.26) | 0.72 (0.35) |
| Descending | 0.69 (0.22) | 0.75 (0.27) |
Statistically significantly different from the ascending phase.
Peak knee extensor moments were similar between activities and movement phases. A main effect difference between phases was identified for the average peak plantar flexor moment, with the descending phase generating a greater moment than the ascending phase (P < 0.05). Post hoc analysis revealed that with LS, the peak plantar flexor moment was 16.9% greater during descent than during ascent (P < 0.05). With FS, however, the peak plantar flexor moment was not statistically significantly different between phases.
Peak power
Net joint power was generated during the ascending phase and absorbed (negative) during the descending phase of both activities (Figs. 3c,d, 4c,d, and 5c,d). It approached zero at the hip, knee, and ankle during the mid-range of the FS and LS movements. This is the transient period between the step up and step down, when both of the subject’s feet were on the force platform.
A statistically significant main effect was identified between activities for the average peak power at the hip (P < 0.01) (Table 4). Post hoc analysis indicated that the average peak hip power generated during FS was 16.3% and 32.4% greater than LS during the ascending (P < 0.05) and descending (P < 0.001) phases, respectively. Between phase differences were also identified for the average peak hip power, with the ascending phase generating a greater power than the descending phase (P < 0.05). Post hoc analysis revealed that with LS, the average peak hip power was 19.4% greater during ascent than during descent (P = 0.001). With FS, however, the average peak hip power was not statistically significantly different between phases.
Table 4.
Peak power at the hip, knee, and ankle: all values are absolute values of the maximum peak joint powers normalized to body mass (W/kg) during the stance phase of the stepping activities for the dominant limb (standard deviation)
| Measurement | FS | LS |
|---|---|---|
| Sagittal plane | ||
| Hip peak power | ||
| Ascending | 1.50 (0.46)** | 1.29 (0.39) |
| Descending | 1.43 (−0.54)* | 1.08 (−0.62)** |
| Knee peak power | ||
| Ascending | 1.55 (0.52) | 1.43 (0.42) |
| Descending | 1.43 (−0.55)* | 1.58 (−0.70) |
| Ankle peak power | ||
| Ascending | 0.22 (0.16)** | 0.48 (0.23) |
| Descending | 0.16 (−0.17)*,*** | 0.56 (−0.29) |
Statistically significantly different from the LS ascending phase.
Statistically significantly different from the LS descending phase.
Statistically significantly different from the FS ascending phase.
The anova identified a statistically significant interaction between the knee joint powers across step-up conditions and movement phases. Post hoc analysis revealed that the average peak knee power produced during LS was 10.5% greater than FS during the descending phase (P < 0.05); however, step-up condition differences were not identified during the ascending phase. A statistically significant main effect was identified between activities for the average peak power at the ankle (P < 0.001). Post hoc analysis revealed that the average peak ankle power generated during LS was 118.2% and 229.4% greater than FS during the ascending (P < 0.001) and descending (P < 0.001) phases, respectively.
Extensor impulse
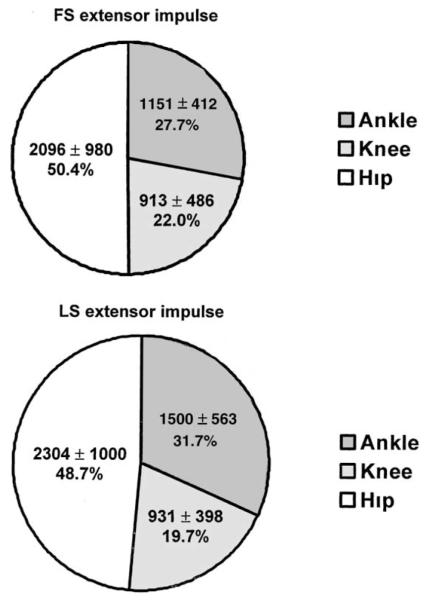
The total support impulse generated during LS was 13.8% greater than the total impulse generated during FS (P < 0.01). During both activities, the hip joint accounted for approximately 50% of the total support impulse (Fig. 6). The average ankle plantar flexor and knee extensor impulses were 30.3% and 2.0% greater during LS, respectively, than during FS (P < 0.05). The extensor impulses at the hip, however, did not differ between step-up conditions.
Fig. 6.
Extensor impulse at the hip, knee, and ankle, calculated as percent of the total support impulse generated during forward stepping (FS) and lateral stepping (LS). Values are extensor impulse normalized to body mass (N mm s/kg) during the stance phase of the stepping activities for the dominant limb (mean ± SD). The relative magnitude of the total support impulse is expressed as the diameter of the pie.
Total work
The total work produced differed between step-up conditions at the hip (P < 0.001), knee (P < 0.01), and ankle (P < 0.001) (Fig. 7). The total extensor work produced during FS at the hip was 26.1% greater than the work produced during LS. Conversely, the total knee extensor and ankle plantar flexor work generated during LS was 8.1% and 197.7% greater, respectively, than the work generated during FS; respectively.
Fig. 7.
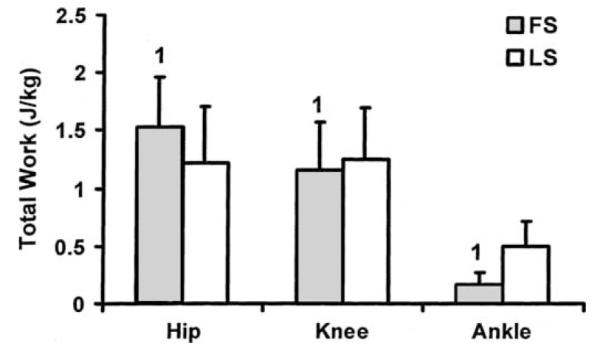
Total extensor work (J/kg) generated at the hip, knee, and ankle during forward stepping (FS) and lateral stepping (LS). Error bars represent standard deviation of measurement. (1) Denotes a statistically significant difference between FS and LS.
4. Discussion
This study demonstrates joint-specific differences in the kinetic and kinematic patterns associated with FS and LS exercise activities in older adults. Comparatively, the kinetic patterns generated with FS targeted the hip joint; whereas, the kinetic patterns generated with LS targeted the knee and ankle joints. FS also produced a greater average joint flexion angle at the hip; whereas, LS produced a greater average joint flexion angle at the knee and a greater average dorsiflexion angle at the ankle.
Both FS and LS activities may be especially relevant exercises for older adults because they require simultaneous coordination of hip, knee, and ankle musculature, and they mimic stair-climbing activities. Despite their common applicability and general attributes, kinematic and kinetic differences between FS and LS activities suggest that these exercises may be used to independently target selected muscle groups and improve joint-specific function in older adults. For example, in elders with limited extensor capabilities at the hip, the FS activity, performed at a self-selected pace, is likely to be more effective than the LS activity at improving hip extensor (e.g. gluteus maximus) performance. The FS activity generated greater power (descent = 53% greater; access = 17% greater) and total work (32.7% greater) at the hip than the LS activity. These activity-specific distinctions were likely related to differences in the total joint excursion (9% greater during FS) and hip angular velocity associated with the self-paced activities, because peak hip extensor moment and impulse differences did not exist. In the coronal plane, peak hip moments were similar between activities. The average peak abductor moments produced during FS and LS, which were only 35–43% of the peak extensor moments, suggest that these exercises may not be preferred activities for targeting the hip abductor muscle groups.
To our knowledge, this is the first investigation to characterize ankle, knee, and hip kinetics during different stepping exercises in older adults. One group of investigators, however, compared maximum hip moments across several exercise activities and stair climbing in participants 55–75 yr (Kirkwood et al., 1999). Their reported peak extensor and abductor moments during the stair climbing were within 10% and 17% of our reported values for FS, respectively. LS, however, was not investigated in their study.
The activity-specific findings at the hip joint contrasted with our findings at the ankle and knee. At the ankle, participants demonstrated greater excursion angles, angular impulse, work and power during performance of the LS activity. Thus, clinicians wishing to target the ankle planar flexors should prescribe LS over FS. At the knee, the results were somewhat equivocal with little or no difference between activities for the peak moment (non-significant) and impulse (2%; P < 0.05); but relatively larger maximum flexion angles (8.3%; P < 0.01), concentric power (10.5%; P < 0.05) and total work (8.1%; P < 0.01) during the LS exercise. Although these differences were statistically significant, the clinical significance of these differences will have to be delineated through controlled randomized clinical trial designs.
Interpretation of the results of this investigation should be made with an appreciation of the study’s limitations. For example, the current investigation was performed under conditions where the participant’s body mass was used as the sole form of resistance. While using one’s body mass is an acceptable form of resistance during the initial stages of training, systematic increases in resistance may be required to improve muscular performance; thus, future investigations should examine the effects of weighted resistance on the biomechanical characteristics of these activities. Additionally, the current examination did not consider variations in exercise speed or the number repetitions to be performed. Alterations in performance speed as well as fatigue effects following repeated repetitions will likely change the kinetics associated with the exercises. These permutations must also be characterized with future biomechanical investigation. Finally, this investigation used an inverse dynamics approach to calculate the joint kinetics; thus, it did not account for co-activation of antagonistic muscle groups. Potential co-activation should be considered when interpreting the kinetic data because the reported net joint moments likely underestimate the actual internal (muscular) joint moments.
5. Conclusions
The results of this study indicate that, in older adults, the FS places greater demand on the hip extensors, while the LS places greater demand on the ankle plantar flexors. At the knee, the results were equivocal and the clinical relevance is not yet understood; however, the LS activity can be expected to produce greater (8–10%) knee flexion angles, concentric power, and total work than the FS activity.
Clinicians may use these findings to more effectively target specific lower-extremity muscle groups when prescribing exercise for older adults. For example, when prescribing lower-extremity activities to improve hip extensor performance, we recommend the FS activity. Conversely, to improve knee range of motion and quadriceps work and power, or to improve ankle range of motion and plantar flexor muscular performance, we recommend the LS activity over the FS activity. Moreover, in patients without joint-specific strength deficits, or in patients with combined hip, knee, and/or ankle deficits, the prescription of both FS and LS activities may be beneficial.
Relevance.
Clinicians may use data from biomechanical analyses of in-home exercises to more effectively target specific lower-extremity muscle groups when prescribing exercise activities for older adults. The forward step-up is recommended for maintaining or improving hip extensor performance; whereas, the lateral step-up is recommended when targeting the knee extensors and ankle plantar flexors.
Acknowledgements
This research was supported by the National Institute on Aging Grant #NIA AG19320-01 and the James H. Zumberge Research Fund. The authors would like to thank Ms. Caroline Reiss, Ms. Serena Sanker, and Dr. Edward Schneider for their contributions to the project.
References
- Bean J, Herman S, Kiely DK, et al. Weighted stair climbing in mobility-limited older people: a pilot study. J. Am. Geriatr. Soc. 2002;50:663–670. doi: 10.1046/j.1532-5415.2002.50160.x. [DOI] [PubMed] [Google Scholar]
- Cook TM, Zimmermann CL, Lux KM, Neubrand CM, Nicholson TD. EMG comparison of lateral step-up and stepping machine exercise. J. Orthop. Sports Phys. Ther. 1992;16:108–113. doi: 10.2519/jospt.1992.16.3.108. [DOI] [PubMed] [Google Scholar]
- Cress ME, Conley KE, Balding SL, Hansen-Smith F, Konczak J. Functional training: muscle structure, function, and performance in older women. J Orthop. Sports. Phys. Ther. 1996;24:4–10. doi: 10.2519/jospt.1996.24.1.4. [DOI] [PubMed] [Google Scholar]
- Davis RB, Ounpuu S, Tyburski D, Gage JR. A gait analysis data collection and reduction technique. Hum. Mov. Sci. 1991;10:575–587. [Google Scholar]
- Flanagan S, Salem GJ, Wang M-Y, Greendale GA. Squatting exercises in older adults: kinematic, kinetic, and electromyographic comparisons. Med. Sci. Sport Exerc. doi: 10.1249/01.MSS.0000058364.47973.06. in press. [DOI] [PMC free article] [PubMed] [Google Scholar]
- Greendale GA, Salem GJ, Young JT, et al. A randomized trial of weighted vest use in ambulatory older adults: strength, performance, and quality of life outcomes. J Am Geriatr. Soc. 2000;48:305–311. doi: 10.1111/j.1532-5415.2000.tb02651.x. [DOI] [PubMed] [Google Scholar]
- Holcomb WR. Resistance training and spotting techniques. In: Baechle TR, Earle RW, editors. Essentials of Strength Training and Conditioning. Human Kinetics; Champaign: 2000. pp. 372–373. [Google Scholar]
- Kadaba MP, Ramakrishnan HK, Wootten ME. Lower extremity joint moments and ground reaction torque in adult gait. Am. Soc. Mech. Eng. BED (4)/DSC. 1987;(7):87–92. [Google Scholar]
- Kadaba MP, Ramakrishnan HK, Wootten ME. Measurement of lower extremity kinematics during level walking. J Orthop. Res. 1990;8:383–392. doi: 10.1002/jor.1100080310. [DOI] [PubMed] [Google Scholar]
- Kirkwood RN, Culham EG, Costigan P. Hip moments during level walking, stair climbing and exercise in individuals aged 55 years or older. Phys. Ther. 1999;79:360–370. [PubMed] [Google Scholar]
- Lan C, Lai JS, Chen SY, Wong MK. 12-month Tai Chi training in the elderly: its effect on health fitness. Med. Sci. Sports Exerc. 1998;30:345–351. doi: 10.1097/00005768-199803000-00003. [DOI] [PubMed] [Google Scholar]
- Li F, Harmer P, McAuley E, et al. An evaluation of the effects of Tai Chi exercise on physical function among older persons: a randomized controlled trial. Ann. Behav. Med. 2001;23:139–146. doi: 10.1207/S15324796ABM2302_9. [DOI] [PubMed] [Google Scholar]
- Reuben DB, Laliberte L, Hiris J, Mor V. A hierarchical exercise scale to measure function at the Advanced Activities of Daily Living (AADL) level. J. Am. Geriatr. Soc. 1990;38:855–861. doi: 10.1111/j.1532-5415.1990.tb05699.x. [DOI] [PubMed] [Google Scholar]
- Salem GJ, Ward SR, Lee TQ. Regulation of plantar-foot kinetics during exercises on step benches with markedly different structural properties. J. Strength Cond. Res. 2000;14:26–31. [Google Scholar]
- Scharff-Olson M, Williford HN, Blessing DL, Brown JA. The physiological effects of bench/step exercise. Sports Med. 1996;21:164–175. doi: 10.2165/00007256-199621030-00002. [DOI] [PubMed] [Google Scholar]
- Shaw JM, Snow CM. Weighted vest exercise improves indices of fall risk in older women. J. Gerontol. A—Biol. Sci. Med. Sci. 1998;53:M53–M58. doi: 10.1093/gerona/53a.1.m53. [DOI] [PubMed] [Google Scholar]
- Snow CM, Shaw JM, Winters KM, Witzke KA. Long-term exercise using weighted vests prevents hip bone loss in postmenopausal women. J. Gerontol. A—Biol. Sci. Med. Sci. 2000;55:M489–M491. doi: 10.1093/gerona/55.9.m489. [DOI] [PubMed] [Google Scholar]
- Winter DA. Biomechanics and Motor Control of Human Movement. 2nd ed John Wiley & Sons, Inc.; New York: 1990. [Google Scholar]
- Worrell TW, Borchert B, Erner K, Fritz J, Leerar P. Effect of a lateral step-up exercise protocol on quadriceps and lower extremity performance. J. Orthop. Sports Phys. Ther. 1993;18:646–653. doi: 10.2519/jospt.1993.18.6.646. [DOI] [PubMed] [Google Scholar]


