Abstract
This research introduces a cell cryopreservation method, which utilizes thin film evaporation and provides an ultra-high cooling rate. The microstructured surface forming the thin film evaporation was fabricated from copper microparticles with an average diameter of 50 μm. Experimental results showed that a cooling rate of approximately 5×10⁴ °C/min was achieved in a temperature range from 10 °C to −187 °C. The current investigation will give birth to a cell cryopreservation method through vitrification with relatively low concentrations of cryoprotectants.
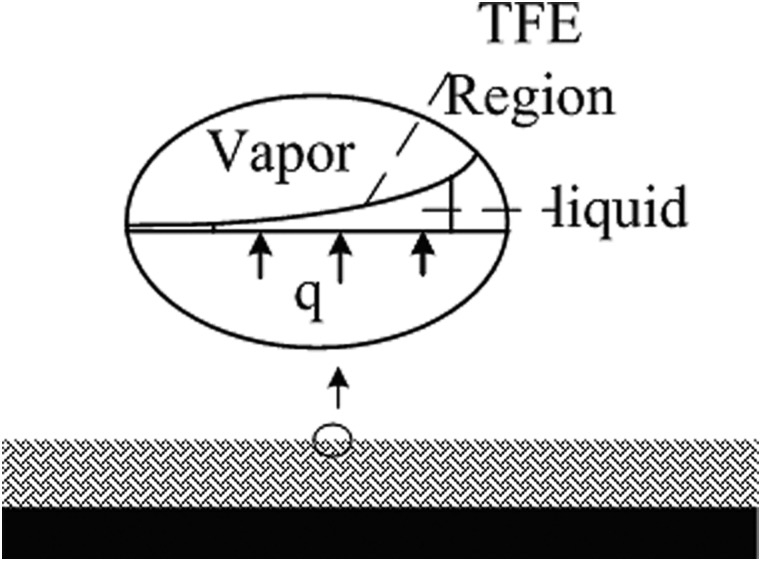
Thin film evaporation can significantly increase evaporating heat transfer coefficient.1, 2, 3, 4, 5, 6 During a typical thin film evaporation process in a porous media as demonstrated in Fig. 1, the capillary pressure and disjoining pressure interact with each other to maintain a thin film at μm level between the vapor and the solid surface. The heat transferred from the evaporating surface is absorbed at the liquid-vapor interface by the latent heat of the liquid film and transferred through heat conduction in the thin film to the vapor phase. This process provides an ultra-high heat transfer coefficient on the evaporating surface due to the extra thin liquid film. Ma et al.7 show that the heat transfer coefficient in the thin film region can reach an order of magnitude of 106 W/m2K when liquid nitrogen is used as the working fluid.
Figure 1.
A schematic of thin film evaporation on a microstructured evaporating surface.
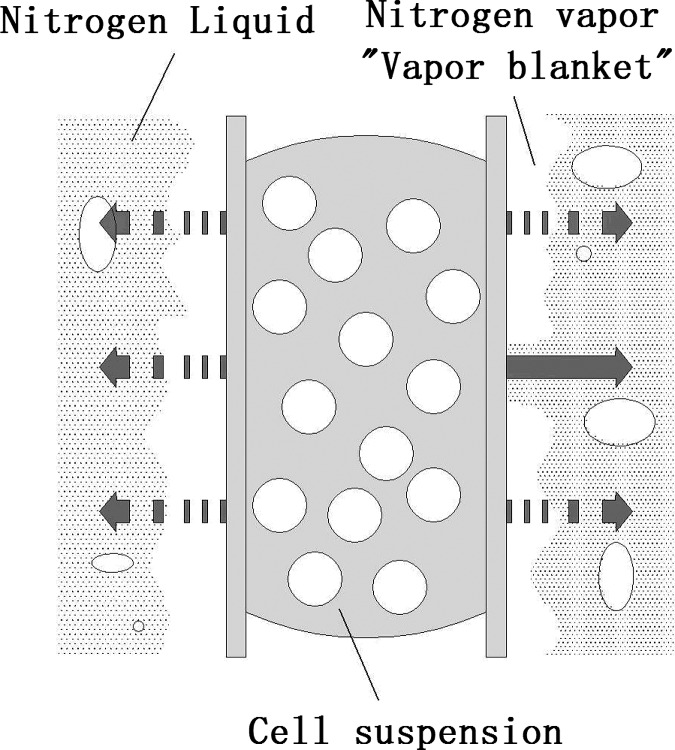
Vitrification is now regarded as an important alternative to the traditional slow freezing method for cell cryopreservation, partially because it can avoid the injury to cells due to the formation of intracellular and extracellular ice crystals in the freezing process.8, 9, 10, 11, 12, 13, 14 Ultra-fast cooling is the key to complete vitrification. It can offer two advantages:9, 12 (1) the required cryoprotectant concentration can be decreased with a consequent decrease in the associated potential toxicity; (2) a more rapid passage through the dangerous temperature zone results in reduced freezing injury. In conventional vitrification procedure, a typical cooling rate applied to samples is approximately 2500 °C/min.8 With improvements, it has increased to 24 000 °C/min using an electron microscopic (EM) grip,10, 11 20 000 °C/min when using open pulled straws (OPS),12 and 20 000 °C/min using a cryoloop.13 Although these methods achieve complete or partial vitrification of cell suspensions, highly concentrated cryoprotectants are required, and that results in reduced cell survival rates. The main obstruction to further increasing the cooling rate is that liquid nitrogen vaporizes near the sample surface during the pool boiling while directly plunging samples (e.g., the EM grips, OPS, and cryoloops) into liquid nitrogen. The evaporation forms a “vapor blanket” which acts as a heat-insulation layer as shown in Fig. 2. As a result, the heat transfer coefficient between the sample surface and liquid nitrogen is limited (<103 W/m2K) due to poor thermal conduction of the “vapor blanket.” Therefore, removal of “vapor blanket” is critical for further improving cooling rate when vitrification is used for cell cryopreservation. Steponkus and Caldwell14 attempted to further cool liquid nitrogen and transformed it into a slush state at a lower internal temperature of −210 °C by applying a negative gauge pressure. In their experiments, Drosophila melanogaster embryos were plunged directly into the slush nitrogen and cooled by the solid-liquid phase change instead of the liquid-vapor phase change. Yoon et al.15 also cooled human oocytes using this method. They observed the cooling process by microscope and found no bubble formation during the whole cooling process. Both groups came to the same conclusion that the survival rate of the sample can be improved. However, neither of them measured the cooling rate using such methods.
Figure 2.
A schematic of the formation of the “vapor blanket” during the cooling process of OPS method.
In the current investigation, an ultra-high cooling rate utilizing thin film evaporation was demonstrated. A microstructured surface composed of copper microparticles was produced to form the evaporating thin film. Liquid nitrogen, serving as the working fluid, was dispersed into the microstructured layer by capillary force and filled the void spaces among microparticles. The liquid nitrogen forming thin liquid film on the microstructured surface is provided by the capillary and disjoining pressure, preventing dryout and formation of “vapor blanket” to achieve an extra-high cooling rate.
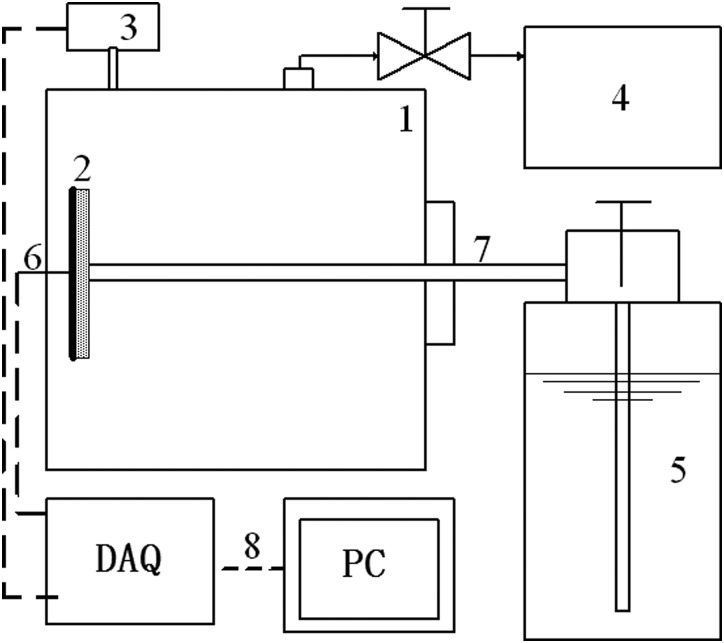
In order to demonstrate the cooling rate, the experimental setup shown in Fig. 3 was developed. A vessel, connected with a vacuum pump, provided a vacuum environment for the evaporation of liquid nitrogen. Inside the chamber, the test section was placed vertically where the thin film evaporation took place. This 5 mm× 5 mm× 0.05 mm test section as shown in Fig. 4 was coated with copper microparticles (50 μm in diameter, Goodfellow Cambridge Ltd.) by a sintering process. This microstructured layer with a thickness of 150 μm consists of several layers of particles, which can help to produce the capillary force and increase thin film region. Figure 4b shows the 3D view of the microstructured surface obtained by Olympus laser scanning confocal microscopy. Figure 4c illustrates the cross sectional view measured by the Xradia Micro-CT An Omega thermocouple (0.5 mm in diameter) was attached on the back of the copper plate (test section) in order to monitor the temperature history during the cooling process. A liquid nitrogen vessel (CRY-AC B-700, Brymill Cryogenic Systems) connected with a needle (2 mm inner diameter, 291 mm length) provided the working fluid, i.e., liquid nitrogen, for the evaporation process. The end of the needle was placed vertically against the surface of the evaporating surface. A pressure sensor was used to measure the pressure of the vessel. A data acquisition system (DAQ, NI SCXI-1000) was connected with a personal computer and used to record the temperature and pressure. The sampling rate of the DAQ was set at 10 000 samples/second, capturing extra fast change of temperature during cooling.
Figure 3.
A schematic of experimental setup ((1) vessel, (2) thin film evaporator, (3) pressure sensor, (4) vacuum pump, (5) liquid nitrogen vessel with valve, (6) thermocouple, (7) needle, and (8) DAQ system).
Figure 4.
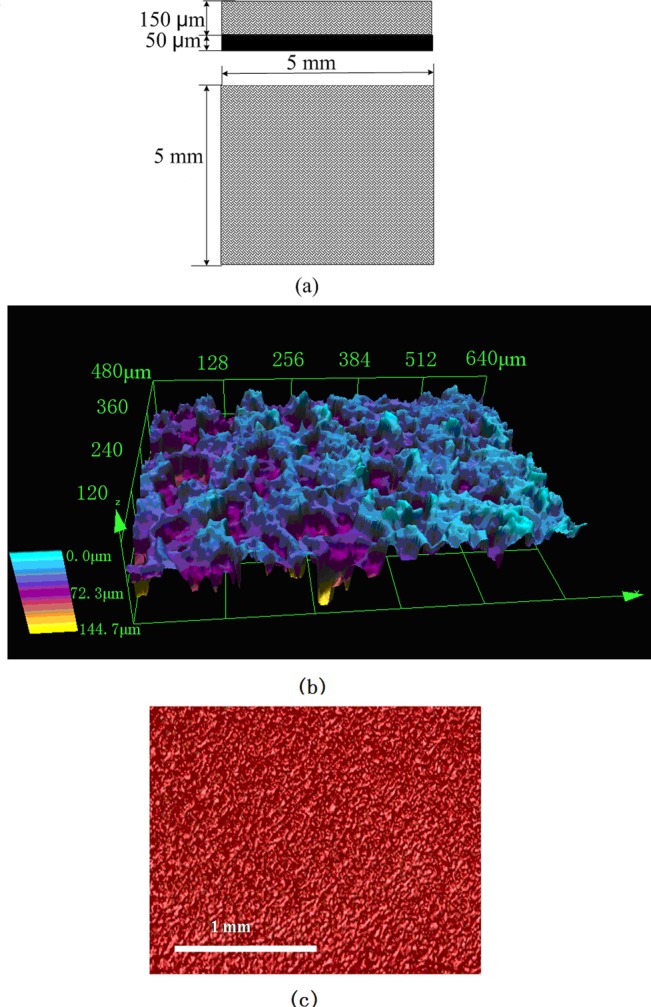
Microstructured evaporating surface for thin film evaporation (a) schematic; (b) 3D photo of surface (using 3D laser scanning confocal microscopy, Olympus Corporation); and (c) surface photo (using Micro-CT, Xradia Inc).
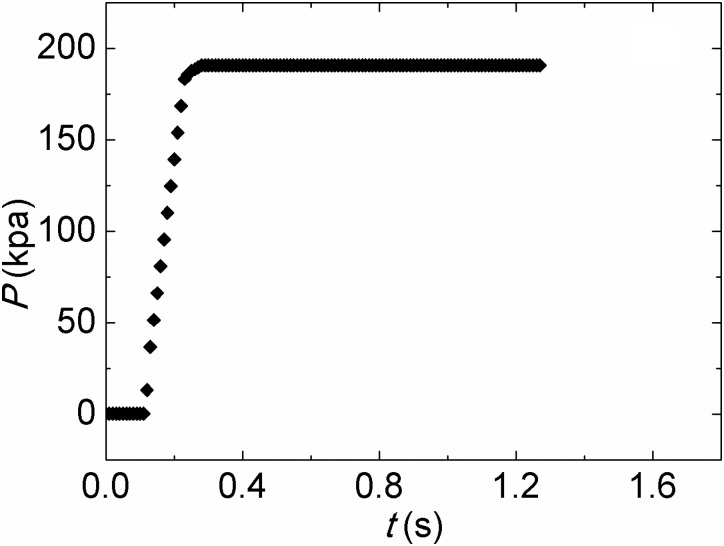
Prior to the start of the experiment, the vessel was vacuumed and the absolute pressure reached approximately 500 Pa. Then, the valve on the liquid nitrogen vessel was opened. Liquid nitrogen flowed from the liquid nitrogen vessel to the test section. As liquid nitrogen reached the evaporating surface, the liquid was instantly spreading to the whole surface of the evaporating surface by the capillary force produced by the microstructures shown in Figs. 4b, 4c. Because many microscale pores as shown in Fig. 4b exist in the evaporating surface, the total evaporating thin film region was significantly increased. Because the vessel pressure is 500 ± 25 pa before the test, which is much lower than the saturation pressure of nitrogen corresponding to the room temperature, the molecules at the liquid-vapor interface flow away from the liquid-vapor interface at a high speed. Due to the molecule escape, the temperature at the liquid-vapor interface rapidly decreases. Because the thickness of evaporating thin film is very thin, the thermal resistance across the thin liquid film is very small resulting in an extra-high heat transfer coefficient. This extra-high evaporating heat transfer coefficient makes the evaporating surface temperature fall sharply from room temperature to the saturation temperature. To sustain vacuum in the vessel, the vacuum pump was kept working and expelled nitrogen vapor during the experiment. Because the flow rate of nitrogen vapor pumped by the vacuum pump was smaller than the evaporating rate of the liquid nitrogen in the vessel, the pressure in the vessel rose from 500 pa to 190, 670 pa as shown in Fig. 5. The saturation temperature of liquid nitrogen corresponding to the vessel pressure of 190, 670 pa is about −188 °C. The temperature history of the evaporating surface was recorded by the DAQ system. To calculate the mass flow rate of liquid nitrogen, the total mass of the filled liquid nitrogen vessel was measured before and after the experiment, respectively. The difference between two measurements was hence the mass of liquid nitrogen used in the experiment. This number was then divided by the running time of the experiment. In this way, the mass flow rate of liquid nitrogen was calculated as 1.934 g/s.
Figure 5.
Pressure variation in the vessel during the test.
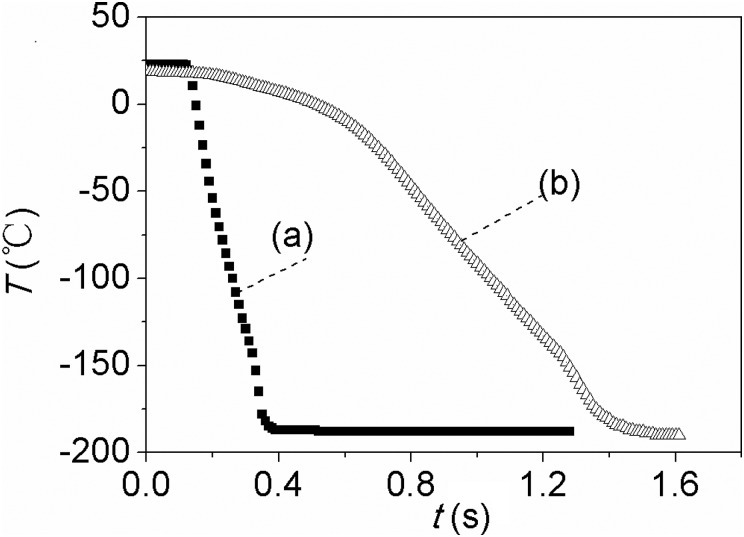
In order to compare the cooling performance of thin film evaporation with pool boiling process, which is currently being used for cell cryopreservation, a comparative experiment in which the test section was plunged directly into liquid nitrogen was also performed. Figure 6 shows the temperature histories of both experiments. As shown in Fig. 6, the cooling rate of the test section with thin film evaporation was much higher than that with pool boiling. When the temperature dropped from 10 °C to −187 °C, the cooling time spanned for only 0.241 s. The average cooling rate reached 49 045 °C/min. For comparison, 1.11 s is needed for the pool boiling test, and its average cooling rate is only 10 639 °C/min. The cooling rate with thin film evaporation is 3.6 times higher than that with pool boiling. The cooling rate is more than two times higher than those using open pulled straws12 and EM grid,10, 11 whose cooling rate is 20 000–24 000 °C/min.
Figure 6.
Temperature histories of test section by: (a) thin film evaporation; and (b) pool boiling (the test section was directly plunged in liquid nitrogen).
The extra-high cooling rate obtained is due to the effective use of thin film evaporation at the microstructured surface and no formation of “vapor blanket.” The cooling procedure will give birth to a cell cryopreservation method through vitrification with relatively low concentrations of cyroprotectants.
Acknowledgments
The authors gratefully acknowledge financial support for this work from the National Institutes of Health (5R21RR025908-02) and Dalian Science and Technology Plan Project (2010E15SF162).
References
- Bau H. H. and Torrance K. E., Int. J. Heat Mass Transfer 25, 45 (1982). 10.1016/0017-9310(82)90233-2 [DOI] [Google Scholar]
- Webb R. L., Principles of Enhanced Heat Transfer (Wiley, New York, 1994). [Google Scholar]
- Kaviany M., Principles of Heat Transfer in Porous Media (Springer-Verlag, New York, 1995). [Google Scholar]
- Demsky S. and Ma H. B., J. Microsc. Thermophys. Eng. 8, 285 (2004). 10.1080/10893950490477590 [DOI] [Google Scholar]
- Sait H. and Ma H. B., J. Nanoscale Microscale Thermophys. Eng. 13, 218 (2009). 10.1080/15567260903276973 [DOI] [Google Scholar]
- Ma H. B., Cheng P., and Borgmeyer B., J. Microfluid. Nanofluid. 4, 237 (2008). 10.1007/s10404-007-0172-5 [DOI] [Google Scholar]
- Han X., Ma H. B., Jiao A., and Critser J. K., Cryobiology 56, 195 (2008). 10.1016/j.cryobiol.2008.02.006 [DOI] [PMC free article] [PubMed] [Google Scholar]
- Rall W. F. and Fahy G. M., Nature (London) 313, 573 (1985). 10.1038/313573a0 [DOI] [PubMed] [Google Scholar]
- Huang C. C., Lee T. H., Chen S. U., Chen H. H., Cheng T. C., Liu C. H., Yang Y. S., and Lee M. S., Hum. Reprod. 20, 122 (2005) 10.1093/humrep/deh540. [DOI] [PubMed] [Google Scholar]
- Steponkus P. L., Myers S. P., Bronshteyn V., Leibo S. P., Rall W. F., Pitt R. E., Lin T. T., and Maclntyrell R. J., Nature (London) 345, 170 (1990). 10.1038/345170a0 [DOI] [PubMed] [Google Scholar]
- Martino A., Songsasen N., and Leibo S. P., Biol. Reprod. 54, 1059 (1996). 10.1095/biolreprod54.5.1059 [DOI] [PubMed] [Google Scholar]
- Vajta G., Holm P., Kuwayama M., Booth P. J., Jacobsen H., Greve T., and Callesen H., Mol. Reprod. Dev. 51, 53 (1998). [DOI] [PubMed] [Google Scholar]
- Mukaida T., Nakamura S., Tomiyama T., Wada S., Kasai M., and Takahashi K., Fertil. Steril. 76, 618 (2001). 10.1016/S0015-0282(01)01968-9 [DOI] [PubMed] [Google Scholar]
- Steponkus P. L. and Caldwell S., “An optimized procedure for the cryopreservation of Drosophila melanogaster embryos,” CryoLetters 14, 375–380 (1993). [Google Scholar]
- Yoon T. K., Lee D. R., Cha S. K., Chung H. M., Lee W. S., and Cha K. Y., Fertil. Steril. 88, 952 (2007). 10.1016/j.fertnstert.2006.12.071 [DOI] [PubMed] [Google Scholar]


