Abstract
During dynamic nuclear polarization (DNP) at 1.5 K and 5 T, 129Xe nuclear magnetic resonance (NMR) spectra of a homogeneous xenon/1-propanol/trityl-radical solid mixture exhibit a single peak, broadened by 1H neighbors. A second peak appears upon annealing for several hours at 125 K. Its characteristic width and chemical shift indicate the presence of spontaneously formed pure Xe clusters. Microwave irradiation at the appropriate frequencies can bring both peaks to either positive or negative polarization. The peculiar time evolution of 129Xe polarization in pure Xe clusters during DNP can be modelled as an interplay of spin diffusion and T1 relaxation. Our simple spherical-cluster model offers a sensitive tool to evaluate major DNP parameters in situ, revealing a severe spin-diffusion bottleneck at the cluster boundaries and a significant sample overheating due to microwave irradiation. Subsequent DNP system modifications designed to reduce the overheating resulted in four-fold increase of 129Xe polarization, from 5.3% to 21%.
INTRODUCTION
Recent reports1, 2 of 129Xe dynamic nuclear polarization (DNP) spurred renewed interest in producing large quantities of highly polarized xenon for human-lung imaging.3, 4 Unlike optical pumping techniques,5, 6 DNP is performed in the solid state, with 1000 times higher 129Xe density and, potentially, higher production rates. 129Xe DNP builds upon the earlier success of low-temperature DNP of 13C-labelled biomolecules, where high 13C polarization (15%−75%)7 is retained at room temperature after a rapid dissolution.8 However, in the previous DNP studies, 129Xe polarization has varied widely and is still inferior to that of [1-13C]pyruvate.7, 9 One of the reasons may be a lack of experimental probes to access the microscopic DNP parameters described by recent theories.10, 11 Another reason is a poorly understood process of forming a solid sample from a gaseous ingredient. DNP requires an intimate mixture of the target (xenon) with the source of unpaired electrons, such as commonly used trityls7, 12 or TEMPO (2,2,6,6-Tetramethylpiperidine-1-oxyl).2 It is well-known that crystallization often expels foreign molecules from the solid, therefore a glassing agent (e.g., 1-propanol) is usually added to achieve a homogeneous mixture of the radical with the target.13 The glassing behavior, however, is much less understood, as slight variations in molecular mobility and affinity during freezing may greatly impact polarization levels in otherwise similar molecular targets.
To address these issues, we developed a 129Xe nuclear magnetic resonance (NMR) probe with part-per-million (ppm) resolution to investigate local DNP parameters in Xe/solvent/radical mixtures. Achieving sample homogeneity required vigorous stirring of the liquid ingredients at 195 K and 4.2 atm, followed by rapid freezing.1 Inefficient stirring or thermal cycling above 100 K produced pure xenon clusters in the solid-state glassy matrix, ultimately segregating the majority of 129Xe atoms both from the unpaired electrons of the radical as well as from the 1H atoms of the solvent. 129Xe nuclei in such clusters depend solely on long-range nuclear spin diffusion to attain some degree of DNP.
We propose a simple model of spin diffusion and T1 relaxation in spherical clusters of pure Xe to extract unknown DNP parameters from our measurements of average 129Xe polarization inside and outside of the clusters. This model reveals a polarization bottleneck at the cluster boundaries and shows a high sensitivity to the internal sample temperature and to 129Xe T1 in the clusters. While the observation of the bottleneck effect and the inferred values of T1 in the clusters provide new specific constraints on the theory of spin diffusion in heterogeneous media such as our samples, the finding of highly elevated internal sample temperatures during microwave irradiation has led to a more practical advance. After a number of modifications to the DNP system with an aim of reducing sample overheating, our subsequent experiment showed a four-fold increase in 129Xe polarization, from 5.3% to 21%.
MATERIALS AND METHODS
Our DNP/NMR system was based on an Oxford Instruments TMR7/88/15 TeslatronMR superconducting magnet, operating at a 4.997 T magnetic field (212.77 MHz 1H2O NMR frequency). An integrated 4He variable-temperature insert could be cooled down to below 1.3 K for about an hour (or kept indefinitely at 1.43 K and above) using an external pump while being monitored with an Oxford Instruments ITC-503 controller. A computer-controlled primary microwave source (7–8 GHz range and 18.3 dBm power, Hewlett-Packard 83623B or Giga-tronics SNY-0410-510-01) fed via a short coaxial cable into a probe-mounted ×18 frequency multiplier/narrow-band 140 GHz, 70 mW microwave amplifier (ELVA DCOIMA-06/140/70). The primary source was calibrated using a 13.6 GHz signal analyzer (Agilent EXA N9010A-513). A home-built DNP/NMR probe supported an overmoded cylindrical aluminum microwave chamber (5 cm height and diameter, directly coupled to a 3/16″ (4.76 mm) inner-diameter (ID) stainless steel waveguide) that contained a two-turn copper NMR coil wrapped around a polyether ether ketone (PEEK) sample holder for a vertical 5-mm pyrex-glass NMR sample tube (Wilmad 504-PP or 524-PP, 0.77 mm wall, shortened as necessary for samples I and II). To protect the thermometry from the microwaves, the temperature was monitored 1 cm above the microwave chamber by a LakeShore CX-1030-SD sensor using RV-Elektronikka AVS-47 picowatt resistance bridge. A home-built spectrometer14 recorded 129Xe NMR spectra. A hermetically-sealed retractable electric stirrer was used to mix 3.0 mg (3.0 μmol) Finland-acid radical15 dissolved in 97 mg (1.6 mmol) 1-propanol with 2.4 mmol of liquid xenon (BOC, natural abundance, 99.997% pure, <1 ppm O2), while immersed in ethanol/solid-CO2 bath (195 K, 4.2 atm Xe pressure) for ∼1 min. After the bath was rapidly swapped to liquid nitrogen (LN2, 77 K), pure solid xenon from the top of the sample was removed with a warm rod. The open NMR sample tube was transferred to the probe (precooled with LN2), inserted into the magnet, and cooled down to 1.4 K.
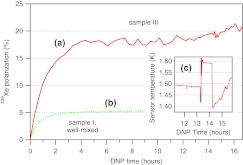
In the subsequent experiment, the primary microwave source was attenuated by 6 dB, to reduce sample overheating. Sample III was prepared using the same procedure with 4.0 mg (4.0 μmol) Finland-acid radical dissolved in 130 mg (2.2 mmol) 1-propanol and mixed with 1.1 mmol of enriched liquid xenon (Linde, 86% 129Xe fraction). The 6-mm ID glass tube containing sample III was crushed with a precooled wire cutter under LN2, and three frozen 3–6 mm pellets of the solid mixture were transferred (using precooled plastic tweezers) into an open PEEK sample cup immersed in the same pool of LN2. The cup with the frozen pellets was then transferred to a precooled NMR coil that was enlarged and mounted on a vertical, perforated G-10 plastic tube (12.7 mm ID, 1.6 mm wall thickness) to allow liquid helium circulate freely around the sample cup.
Spectra were acquired after a 9.5 ± 1 μs dead time between the center of a 5 μs pulse (10° flip angle) and the first data point (7.5 ± 1 μs dead time and 1 μs pulses, corresponding to a 0.2° flip angle, were used in the subsequent experiment on sample III). By applying base adjustment, Gaussian broadening (170 Hz for plotting only), Fourier transform, and zero-order phase correction, the spectra were plotted and fitted to single, double, or triple gaussian line shapes using a custom code in Igor Pro 6 (Wavemetrics). When the narrow peak's slightly non-Gaussian tail distorted the broad peak, a linear combination of a Gaussian and a Lorentzian of the same FWHM was used to represent the narrow peak in multi-peak fits. Areas under each peak and peak widths, calculated from the fitted curves, were corrected for the small dead-time-induced broadening and area loss. Thermally-polarized reference spectra were obtained in the same DNP system after switching the microwaves off, by averaging between 6 and 79 spectra from the steady-state regions of T1 relaxation curves with the same NMR parameters as in the corresponding DNP experiments for samples I and II, whereas 5 μs pulses (1° flip angle) were used for acquiring thermally-polarized spectra in sample III. For samples I and III, polarization values were quantitatively determined from the calculated Boltzmann values by choosing the repetition time of the rf pulses during signal averaging (101.5 min for annealed sample I and 20.4 min for well-mixed sample I and for sample III) such that the calculated spin-destruction time constants due to rf pulses (6200 and 1240 min, respectively) were at least 10 times longer than the measured T1 times. In annealed sample II, T1 exceeded 24 h, making precise signal-averaging unattainable in any reasonable time.
RESULTS
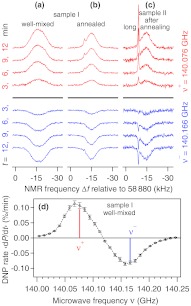
Figures 1a, 1b, 1c show the early evolution of 129Xe NMR spectra during DNP at ν+ = 140.076 GHz (or ν− = 140.166 GHz) microwave frequencies, optimized to overpopulate the ground (or inverted) state of the nuclear Zeeman system, as shown in Fig. 1d. Note that the splitting between ν+ and ν− is ∼90 MHz, which is slightly short of 2f NMR = 117.74 MHz, as would be required by the solid effect.16 Here, f NMR = 58.87 MHz is the 129Xe NMR frequency. This suggests, given the high radical concentration in the sample, an onset of the thermal mixing involving electron-electron dipolar interactions.10
Figure 1.
(a)−(c) Early evolution of 129Xe NMR spectra during DNP at microwave frequencies ν+ = 140.076 GHz (top) and ν− = 140.166 GHz (bottom). The sample magnetization was destroyed by a saturation pulse train and the microwave source was switched on at time t = 0. (a) Well-mixed sample I. Only one broad peak (corrected full width at half maximum (FWHM) of 10.0 kHz, relative NMR frequency Δf = −16.5 kHz) is observed. (b) The same sample after undergoing the annealing process of Fig. 2a. Two peaks are observed: the broad peak (FWHM 7.0 kHz, Δf = −14.9 kHz) and a much narrower, shifted second peak (FWHM 0.7 kHz, Δf = −9.8 kHz). (c) Sample II after a longer annealing process (Fig. 2b). The narrow peak (FWHM 0.5 kHz) is somewhat narrower compared to (b), whereas the broad peak's width (FWHM 6.8 kHz) is within error bars of the broad peak's width in (b). (d) Initial (0 < t < 30 min) dependence of the average DNP rate ⟨dP/dt⟩ on the microwave frequency ν in well-mixed sample I. The measured chamber temperature was (a) 1.59 K; (b) and (d) 1.58 K; (c) 1.55 K.
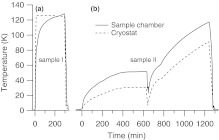
NMR spectra in Figs. 1a, 1b, 1c were acquired every 3 min starting with zero 129Xe polarization at each microwave frequency. Figure 1a illustrates a case of a homogeneous xenon/1-propanol/trityl solid-state mixture. Only one 129Xe peak appears, broadened by the dipolar coupling to 1H magnetic moments of uniformly distributed 1-propanol molecules and by Xe-propanol intermolecular chemical-shift anisotropy. This peak responds directly to DNP, growing upright (or inverted) due to ν+ (or ν−) irradiation. Its line shape and width remain constant during and after DNP, showing no evidence of being composed of several distinct peaks. Figure 1b illustrates the effect of annealing this sample for several hours above 120 K (following the temperature profile shown in Fig. 2a) on the 129Xe NMR spectra under the same low-temperature DNP conditions. The broad 129Xe peak narrows significantly, indicating fewer surrounding 1H neighbors. A second, very narrow 129Xe peak appears at higher Δf. Its width (700 Hz FWHM) and chemical shift relative to the main peak of Fig. 1a (115 ppm) are close to the known values for the line width of pure natural xenon (450 Hz FWHM at 4.2 K17) and ∼150 ppm chemical shift difference between 129Xe in liquid 1-propanol18 and low-temperature solid xenon.19
Figure 2.
Sensor temperatures during annealing. (a) four hours of annealing rearranged Xe atoms from the homogeneous mixture of Fig. 1a to the cluster-containing solid emulsion of Fig. 1b. (b) Natural warm-up of sample II over a 21-h period followed by a 45-min gradual cool-down resulted in a highly-clustered configuration of Fig. 1c.
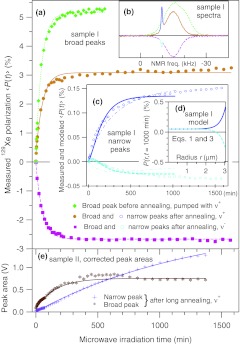
Figures 3a, 3c show the average polarization outside and inside the clusters, measured directly by normalizing the areas under NMR peaks to the areas of averaged thermal spectra of the same sample in equilibrium with the superfluid helium bath (Figs. 4a, 4b). Initially, the narrow peak appears to grow upright for both ν+ and ν−. However, this tendency is later overcome by DNP (Fig. 3c), with both peaks becoming inverted in Fig. 3b (dashed line). This peculiar time evolution of the average 129Xe polarization in pure-Xe clusters strongly suggests nuclear spin diffusion11, 20 from the cluster boundary inward, while the core of the cluster is relaxing towards the thermal equilibrium.
Figure 3.
(a) Measured DNP polarization of 129Xe in the glassy matrix (broad peak, sample I) versus microwave irradiation time t at ν+ = 140.067 GHz (homogeneous, diamonds; annealed, circles) and ν− = 140.166 GHz (annealed, squares). The lines are exponential fits. (b) Corresponding 129Xe spectra after 9 hours of DNP (homogeneous: ν+, dotted; annealed: ν+, solid, and ν−, dashed). (c) Measured average DNP polarization in pure-Xe clusters (narrow peak, sample I) after annealing (ν+, circles; ν−, squares). Note the significantly lower polarizations compared to the broad peaks in (a). Fits of the spherical-cluster model to the combined ν+ and ν− data over 0 < t < 1030 min are shown for continuous (dashed-dotted) and bottleneck (solid and dashed) boundary conditions. (d) Modelled radial dependence of the local polarization in a cluster of radius R = 3.65 μm in steady state (ν+: solid, ν−: dashed). The cluster core achieves thermal polarization in both cases, since DNP only penetrates into the cluster on the order of spin-diffusion depth. Note a ten-fold lower internal boundary polarization compared to the external case (a). (e) Measured areas under the narrow (crosses) and broad (stars) peaks in sample II as a function of time at ν+ = 140.0616 GHz. The lines are exponential fits. The measured chamber temperature was (a-c) 1.59 ± 0.02 K; (e) 1.600 K.
Figure 4.
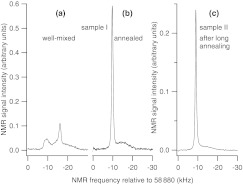
Averaged 129Xe spectra of fully relaxed samples in thermal equilibrium with the liquid helium bath. (a) Well-mixed sample I at 1.433 K (P0 = 0.0986%). (b) Sample I after the annealing process of Fig. 2a at 1.430 K (P0 = 0.0988%). (c) Sample II after the long annealing process (Fig. 2b) at 1.432 K (P0 = 0.0987%). Note that the very long inherent T1 in the clusters of sample II led to substantial saturation of the narrow peak, despite the use of small flip-angle pulses. For this reason, the peak areas of Fig. 3e could not be converted to polarization.
Figure 1c shows 129Xe NMR spectra during DNP in a case of extreme clustering in sample II. As prepared, it behaved similarly to sample I. It was later warmed up and gradually cooled down again (Fig. 2b), forming much more pronounced pure-Xe clusters. The narrow peaks in Fig. 1c are somewhat narrower (500 Hz FWHM) and much stronger compared to Fig. 1b, and are already inverted after t = 3 min at ν−. However, the most striking feature is observed in the late-time evolution (Fig. 3e): 129Xe magnetization in the clusters keeps growing after 24 h, exceeding that of the inter-cluster regions.
Figure 4 shows averages of multiple fully-relaxed, thermally polarized 129Xe spectra for the three cases presented in Fig. 1. Two narrow peaks in Fig. 4a do not exhibit any DNP, and can be due to bulk pure xenon deposited during sample preparation after the stirrer was retracted. Their areas are excluded from normalizing the polarization values in Fig. 3a (diamonds). These peaks disappear upon annealing (Fig. 4b), possibly by sublimation during the 4-h annealing time. Observed changes in NMR probe tuning upon thermal cycling may have contributed to the increase in the total peak area in Fig. 4b compared to Fig. 4a, along with the possible migration of some 129Xe atoms from within the local regions of severe NMR line-broadening by the radical electrons.
MODELLING
To quantify the results shown in Figs. 3a, 3b, 3c, we propose a model of local 129Xe polarization P(r, t) in a pure solid-xenon spherical cluster of unknown radius R, centered at the origin and surrounded by a matrix of 129Xe/1-propanol/trityl at temperature T. Here, is the radial coordinate and t is the microwave irradiation time. 129Xe nuclei in the matrix outside the cluster are polarized directly by DNP: , where τ = 54 min and 3.08% () are the DNP time constant and the ultimate polarizations in the matrix due to pumping with ν+ (ν−), obtained from the exponential fits to the broad-peak data in Fig. 3a, solid (dashed) lines. Inside the cluster, polarization obeys a spin-diffusion equation
| (1) |
Ds ≈ 7.3 × 10⁻¹⁴ cm2/s is the nuclear spin diffusion coefficient,20, 21 and T1 is the unknown local relaxation time towards thermal polarization P0 at temperature T
| (2) |
where h and kB are Planck and Boltzmann constants. The initial (t = 0) and boundary (r = R) conditions are
| (3) |
Fitting this numerical model with a simpler, continuous boundary condition fails to reproduce the experimental data (see Fig. 3c, dashed-dotted lines) and implies a cluster radius that is orders of magnitude larger than atomic-diffusion estimate below. Therefore, we introduce a polarization bottleneck constant κ, defined as a ratio between the polarization gradient inside the cluster boundary and the discontinuity in P(r, t) across the boundary. Introducing the bottleneck is motivated by the poor spectral overlap of the two 129Xe NMR peaks, and is the only way to reconcile the very low measured cluster-average polarizations of Fig. 3c with the relatively high 129Xe polarizations in the surrounding matrix (Fig. 3a). Specifically, Eq. (4.11) in Ref. 20 relates the spin-diffusion constant D to the dipolar-broadened line width of the spin-1/2 species’ NMR spectrum, parameterized by the square root of second moment S1/2
| (4) |
where the summation is carried out over all 129Xe neighbors at distances rij and angles θij with respect to the magnetic field. Since the 129Xe line outside of the clusters is 10 times broader (and therefore S−1/2 is a factor of 10 lower), while the xenon density is a factor of 3 lower (so the terms are a further factor of 4 lower) compared to pure-Xe clusters, we expect the spin diffusion to be a factor of 40 slower in polarization-producing inter-cluster regions. Thus, a thin layer just outside the cluster can play the role of the bottleneck. In addition, the chemical shift between the two NMR peaks further reduces the probability of flip-flop transitions across the cluster boundary.
DISCUSSION
Simultaneous fit of the model to the ν+ and ν− data of Fig. 3c (circles and squares: volume-averaged 129Xe polarization in clusters in annealed sample I; solid and dashed lines: fit) gives: T1 = 144 ± 12 min, P0 = (0.0501 ± 0.0013)%, R = 3 ± 3 μm, κ = 0.5 ± 0.5 μm−1, and, from Eq. 2, a significantly elevated sample temperature T = 2.8 ± 0.1 K. The variables R and κ are coupled, resulting in large individual error bars. However, if the κ value were fixed, our model would give an accurate estimate of R. The best-fit solution of Eqs. 1−3 is plotted in Fig. 3d for t = 1000 min. According to our model, DNP only penetrates into the clusters at the depth ∼m, while the cluster cores are decoupled and achieve their thermal polarization P0 on the time scale T1. The time domain of the fit was limited to <1030 min, since the very long-term creep of DNP cannot be adequately explained by our single-size, single-T1 model. Note that the inverted peak keeps growing more negative under ν−, thus ruling out contamination by superficially deposited xenon or by anomalously large clusters. A more realistic model involving a cluster-size and T1 distribution could perhaps better explain these long-term trends. Using published atomic self-diffusion data for pure solid xenon17 and the detailed plot of Fig. 2a, we estimate that Xe atoms could travel 0.7 μm during annealing. Since Xe has to diffuse through 1-propanol, this estimate is only valid to an order of magnitude. Nevertheless, it is consistent with the cluster size extracted from our model.
It is also remarkable that the long-term behavior of the polarization curves in Fig. 3c (t > 1000 min) is symmetric for ν+ and ν− with respect to the constant level ⟨P⟩ ≈ 0.06%, which is close to the P0 = 0.05% obtained from the fit. Since the polarization of the inter-cluster regions (Fig. 3a) is similarly symmetric, the long-term mean of the two averaged ν+ and ν− polarization values is a logical proxy for the long-term thermal cluster polarization, thus confirming overheating of the sample inferred from our model. A direct estimate, based on published values of pyrex glass thermal conductivity22 and assuming that 20 mW of microwave power is absorbed by the radical, yields ∼1 K of excess temperature, which may have been further elevated by the tight-fitting 1-mm thick PEEK sample holder.
To minimize this predicted overheating of the sample during DNP, a number of modifications were implemented to the system design, as described in Sec. 2. The 0.77-mm thick glass NMR sample tube was eliminated, and the tight-fitting PEEK sample holder that surrounded the tube was replaced by a much wider and more open coil support, with perforated walls for an improved access of liquid helium. The sample was broken into several 3–6 mm size pellets. In addition, the microwave power was reduced by inserting a 6-dB attenuator after the primary source. Whereas our attempts to optimize the chemical and isotopic composition of xenon/1-propanol/trityl mixtures did not lead to any appreciable increase in DNP efficiency, our modifications aimed at reducing sample overheating have allowed us to reach a maximum 129Xe polarization of (21 ± 2)%, as shown in Fig. 5a. This is a four-fold increase over the previous best value of 5.3% of Fig. 3a, shown for comparison in Fig. 5b.
Figure 5.
As overheating of the sample during DNP, predicted by the model of Figs. 3c, 3d, was reduced after implementing several system modifications, we observed a four-fold increase in the ultimate 129Xe polarization (a) compared to trace (b) of Fig. 3a. Part of this increase (from 13.3 to 16 h along the horizontal axis) was achieved by switching the cryostat from continuous to single-shot operation, where the liquid helium flow through the supply capillary was first increased (between 13.3 and 14.2 h) and then shut off completely. As a result, the equilibrium temperature of the superfluid liquid helium was first raised and then lowered by about 0.1 K relative to the continuous mode. The level of helium rose above the probe sensor during the first maneuver, but then progressively dropped below the sensor, leading to a gradual rise in the recorded temperature (c). The sample, however, was located 4 cm below the sensor, thus being exposed to the lowest temperature for a longer time, as evidenced by the gradual further rise in polarization.
We have demonstrated spontaneous pure-Xe cluster formation in a typical 129Xe DNP scheme, caused by poor sample mixing or by exposing a homogeneous solid mixture to temperatures T > 120 K. In extreme cases, 129Xe in these micron-size clusters can exhibit very slow relaxation (T1 > 24 h), while generally the spin-diffusion bottleneck at the cluster boundary prevents DNP from penetrating into the cluster cores. Additionally, we have shown that modelling polarization dynamics in these heterogeneous systems can provide new insights into the microscopic details of DNP, and in particular can be used as a sensitive intrinsic thermometer during microwave irradiation. This latter finding proved to be of crucial practical importance: mitigating the predicted sample overheating by implementing several system modifications has led to a four-fold increase in 129Xe polarization, from 5.3% to 21%.
ACKNOWLEDGMENTS
We thank Dr. Z. Han and K. Kao for assistance with the probe design and A. Clark for his computational efforts. This work was supported by the National of Institutes of Health (NIH) RO1 EB010208.
References
- Ardenkjaer-Larsen J.-H.et al. , U.S. patent 8,003,077 (24 October 2003).
- Comment A. et al. , Phys. Rev. Lett. 105, 018104 (2010). 10.1103/PhysRevLett.105.018104 [DOI] [PubMed] [Google Scholar]
- Cleveland Z. I. et al. , PLoS ONE 5, e12192 (2010). 10.1371/journal.pone.0012192 [DOI] [PMC free article] [PubMed] [Google Scholar]
- Dregely I. et al. , J. Magn. Reson Imaging 33, 1052 (2011). 10.1002/jmri.22533 [DOI] [PMC free article] [PubMed] [Google Scholar]
- Happer W., Miron E., Schaefer S., Schreiber D., van Wijngaarden W. A., and Zeng X., Phys. Rev. A 29, 3092 (1984). 10.1103/PhysRevA.29.3092 [DOI] [Google Scholar]
- Hersman F. W. et al. , Acad. Radiol. 15, 683 (2008). 10.1016/j.acra.2007.09.020 [DOI] [PMC free article] [PubMed] [Google Scholar]
- Meyer W., Heckmann J., Hess C., Radtke E., Reicherz G., Triebwasser L., and Wang L., Nucl. Instrum. Methods Phys. Res. A 631, 1 (2011). 10.1016/j.nima.2010.10.156 [DOI] [Google Scholar]
- Golman K. et al. , Acad. Radiol. 9, S507 (2002). 10.1016/S1076-6332(03)80278-7 [DOI] [PubMed] [Google Scholar]
- Johanneson H., Macholl S., and Ardenkjaer-Larsen J. H., J. Magn. Reson. 197, 167 (2009). 10.1016/j.jmr.2008.12.016 [DOI] [PubMed] [Google Scholar]
- Hovav Y., Feintuch A., and Vega S., J. Magn. Reson. 207, 176 (2010). 10.1016/j.jmr.2010.10.016 [DOI] [PubMed] [Google Scholar]
- Hovav Y., Feintuch A., and Vega S., J. Chem. Phys. 134, 074509 (2011). 10.1063/1.3526486 [DOI] [PubMed] [Google Scholar]
- Reddy T. J., Iwama T., Halpern H. J., and Rawal V. H., J. Org. Chem. 67, 4635 (2002). 10.1021/jo011068f [DOI] [PubMed] [Google Scholar]
- Ardenkjaer-Larsen J. H. et al. , Proc. Natl. Acad. Sci. U.S.A. 100, 10158 (2003). 10.1073/pnas.1733835100 [DOI] [PMC free article] [PubMed] [Google Scholar]
- Patton B., Kuzma N. N., and Happer W., Phys. Rev. B 65, 020404 (2002). 10.1103/PhysRevB.65.020404 [DOI] [PubMed] [Google Scholar]
- Macholl S., Johannesson H., and Ardenkjaer-Larsen J. H., Phys. Chem. Chem. Phys. 12, 5804 (2010). 10.1039/c002699a [DOI] [PubMed] [Google Scholar]
- Abragam A. and Goldman M., Rep. Prog. Phys. 41, 395 (1978). 10.1088/0034-4885/41/3/002 [DOI] [Google Scholar]
- Yen W. M. and Norberg R. E., Phys. Rev. 131, 269 (1963). 10.1103/PhysRev.131.269 [DOI] [Google Scholar]
- Miller K. W. et al. , Proc. Natl. Acad. Sci. U.S.A. 78, 4946 (1981). 10.1073/pnas.78.8.4946 [DOI] [PMC free article] [PubMed] [Google Scholar]
- Cowgill D. F. and Norberg R. E., Phys. Rev. B 6, 1636 (1972). 10.1103/PhysRevB.6.1636 [DOI] [Google Scholar]
- Khutsishvili G. R., Sov. Phys. Uspekhi 8, 743 (1966). 10.1070/PU1966v008n05ABEH003035 [DOI] [Google Scholar]
- Morgan S. W., “Relaxation of solid hyperpolarized 129Xe,” Ph.D. dissertation (University of Utah, 2007). [Google Scholar]
- Fisher R. A., Brodale G. E., Hornung E. W., and Giauque W. F., Rev. Sci. Instrum. 39, 108 (1968). 10.1063/1.1683081 [DOI] [Google Scholar]


