

Abstract
Simulation of the phonatory flow-structure interaction has been conducted in a three-dimensional, tubular shaped laryngeal model that has been designed with a high level of realism with respect to the human laryngeal anatomy. A non-linear spring-based contact force model is also implemented for the purpose of representing contact in more general conditions, especially those associated with three-dimensional modeling of phonation in the presence of vocal fold pathologies. The model is used to study the effects of a moderate (20%) vocal-fold tension imbalance on the phonatory dynamics. The characteristic features of phonation for normal as well as tension-imbalanced vocal folds, such as glottal waveform, glottal jet evolution, mucosal wave-type vocal-fold motion, modal entrainment, and asymmetric glottal jet deflection have been discussed in detail and compared to established data. It is found that while a moderate level of tension asymmetry does not change the vibratory dynamics significantly, it can potentially lead to measurable deterioration in voice quality.
INTRODUCTION
Phonation involves a complex biomechanical interaction process between the glottal airflow and vocal fold (VF) tissues, and the voice quality is directly determined by the dynamic behavior of glottal flow and the vibratory characteristics of the VFs. These include, but are not limited to, flow separation in the glottis, a turbulent transition, a fluctuating force between the flow and the folds, mucosal wave propagation, and dynamics of the glottal jet. Therefore, a comprehensive understanding of the flow and VF deformation, as well as the nonlinear interaction between them, is essential for understanding voice production.
Computational modeling has been used to study phonation from the very early stages of research in this arena (Flanagan and Landgraf, 1968). In the early models, the VFs were represented by a small number of lumped-elements and the flow was usually described by the Bernoulli equation. Subsequently, more complex multi-mass models were developed and employed (Titze, 1973, 1974; Koizumi et al., 1987; Wong et al., 1991; Steinecke and Herzel, 1995; Story and Titze, 1995; Alipour et al., 2000; Titze and Story, 2002; Titze, 2006; Yang et al., 2010). With the remarkable advances in computational power as well as computational modeling techniques in the last several decades, continuum based models of phonation have undergone rapid improvement. Initial attempts were mostly with two-dimensional (2D) models (Zhao et al., 2001; Zhao et al., 2002; Zhang et al., 2002; Alipour and Scherer 2004). Furthermore, immersed boundary method based solvers have also found an increased use in these models (Duncan et al., 2006; Luo et al., 2008; Luo et al., 2009; Zheng et al., 2009) due to their inherent ease of application to complex biological problems with moving/deforming boundaries.
While these 2D models have provided useful insights into phonation, they still cannot represent many of the physiological characteristics of phonation. Intraglottal vorticity-velocity interaction, glottal jet structure, and its transition to turbulence are all demonstrated to be highly three-dimensional (3D) (McGowan, 1988; Neubauer et al., 2007; Triep et al., 2005; Triep and Brücker, 2010; Zheng et al., 2011b). The 3D effects are clearly observed in the supraglottal region in both the experimental (Neubauer et al., 2007; Triep and Brücker, 2010; Khosla et al., 2007; Khosla et al., 2008) and numerical studies (Zheng et al., 2010b; Mattheus and Brücker, 2011). The asymmetric flow deflection in the 3D models is also observed to be different from the 2D models. The sub and supraglottal lumen in the human larynx also has significant variations in the anterior–posterior direction which likely produces additional 3D effects in the glottal flow. For instance, flow-induced vibration of VFs was observed to have strong anterior–posterior variations in high speed imaging studies (Švec and Schutte, 1996). Therefore, the development of more realistic 3D laryngeal models is the next logical step in the computational biomechanical analysis of phonation.
Alipour et al. (2000) developed the first 3D continuum mechanics based VF model. Tao and Jiang (2006) used the same model to study biphonation; however, the flow in this study was modeled by a simple Bernoulli’s equation. The first fully coupled, 3D continuum model for both flow and VF dynamics was developed by Rosa et al. (2003). In this model, the VF tissue was modeled as a transversely isotropic viscoelastic material, and the airflow was described by the steady Navier–Stokes equations. The authors clearly demonstrated self-sustained oscillations of the VFs; however, the grid resolution was too low to provide detailed flow field information. Suh and Frankel (2007) used the large-eddy simulation approach to simulate the compressible flow through a 3D static larynx model in order to investigate the flow-acoustic interactions during phonation. More recently, Schwarze et al. (2011) developed a highly resolved, 3D computational model of the starting glottal jet flow in a channel with a static, glottis-shaped constriction. Many interesting features of the starting glottal flow, such as the leading vortex and the trailing jet flow as well as their complex interactions, have been analyzed in this work. The same numerical model has been used to study the differences in glottal jet deflection in 2D and 3D models (Mattheus and Brücker, 2011). However, the lack of coupling to VF vibrations in these models eliminated the possibility of understanding flow-coupled vibratory dynamics.
Very recently, a 3D coupled flow-structure interaction (FSI) model with fully resolved flow and tissue dynamics was developed by Zheng et al. (2010, 2011b) to investigate the dynamics of phonation. The model coupled an accurate immersed-boundary method based flow-solver with a finite element method based solid dynamics solver, and reproduced many of the characteristic features of the glottal flow and VF dynamics observed invivo and invitro; the model also provided new insights regarding asymmetric jet deflection and transition.
Since one of the long-term goals of the current study is to use these models to understand phonation in normal and diseased larynges, as well as for surgical planning (Mittal et al., 2011), advancing the state-of-the-art to where simulations can be carried out in more realistic, 3D models is critical. However, such simulations are hampered by a number of factors; these include: (1) Simulations require large grids; this is due to the relatively high Reynolds number (∼3000) as well as the large scale-disparity between the smallest (mean glottal gap width which is around 2 mm) and largest (∼100 mm length of the vocal tract in the vicinity of the glottis that needs to be modeled) length scales that need to be resolved in these models; (2) simulations require large-integration times; the highly non-linear, coupled nature of the dynamics results in a fairly extended transient on the order of ten glottal cycles and one has to integrate past this stage in order to reach a stationary state; (3) the laryngeal geometry is highly 3D and therefore assumptions such as flow homogeneity (Batchelor, 1953) which can be used to reduce computational effort are difficult to justify a priori; (4) modeling of tissue deformation can be computationally intensive; the fidelity of the model employed for tissue deformation has to be commensurate with the model fidelity of the fluid dynamics; and finally (5) models for vocal-fold contact have to be improved in terms of their ability to model complex contact situations that are expected in diseased and surgically modified larynges.
The objective of the effort described in this paper is to (a) develop a 3D model which includes many of the important geometric and structural features of a realistic human larynx as well as a contact model that is better suited for complex 3D vibratory dynamics; (b) simulate phonation in a normal larynx as well as a larynx with tension imbalance in the two VFs, and compare computed features with established data, and (c) interpret the data so as to generate new insights into the physics of phonation with normal VFs as well as VFs with tension imbalance.
COMPUTATIONAL MODELING AND SIMULATION SETUP
Computational modeling and simulation setup
The current study employs an explicitly coupled immersed-boundary-finite-element method based FSI solver to model human phonation (Zheng et al., 2010). The glottal airflow is governed by the 3D, unsteady, viscous, incompressible Navier–Stokes equations, and the VF dynamics are governed by the Navier equation (Alipour, 2000). The coupling between the flow and solid solver is implemented by tracking the aerodynamic load on the interface mesh as well as its deformed shape and velocity in a Lagrangian fashion. Details regarding the FSI solver can be found in Zheng et al. (2010).
The 3D computational domain of the human larynx is shown in Fig. 1a. It consists of three parts: A 1.6 cm × 12 cm × 2.2 cm rectangular computational domain, an immersed tubular vocal tract wall, a pair of deformable VFs, and rigid false vocal folds (FVFs). The vocal tract is represented by a 12 cm long elliptical tube with an anterior–posterior diameter of 1.5 cm. According to Gray’s Anatomy, the typical aspect-ratio of this ellipse (transverse diameter/the anterior–posterior diameter) varies from 1.19 to 1.577 in human adults. An intermediate value of 1.4 is therefore chosen in the current study, which results in a transverse diameter of 2.1 cm, as shown in Fig. 1c.
Figure 1.

(Color online) (a) Computational domain and laryngeal model. (b) Geometric model of the VF and its three-layer inner structure, the five coronal planes correspond to x = 0.225, 0.475, 0.8, 1.125, and 1.375 cm, respectively. (c) Superior view of the geometrical model of the vocal tract and the laryngoscopic view of larynx of a human subject. (d) 3D model of the FVF wall.
In Zheng et al. (2010), a 2D VF profile was extracted from a high resolution laryngeal CT scan of a normal male subject and was “extruded” in the third direction to generate a 3D VF model without longitudinal variation. The same VF model is utilized here and is placed into the elliptical vocal tract with the medial surface 0.005 cm away from the glottal midline. The portion of the VF outside the vocal tract is removed from the current model. The resulting VF model is shown in Fig. 1b. The VFs are placed from y = 2.167 cm to y = 3.167 cm, with the glottal exit at y = 3.0 cm.
The configuration of the three layers in the current model of the VFs is adopted from Luo et al. (2008) and the key features have been kept consistent with the anatomical data. Although a longitudinal variation in layer thickness exists (Hirano et al., 1981), our previous study has shown that it has a negligible effect on VF dynamics (Xue et al., 2011). Therefore, each layer is assumed to be longitudinally invariant. The constitutive law for the viscoelastic, transversely isotropic material was described in detail in Zheng et al. (2010), and here only the material properties for each layer are reported. The tissue density (ρ), the in-plane transversal Poisson’s ratio (), and the longitudinal Poisson’s ratio () are the same for all three layers, and their values are 1.043 g/cm3, 0.9, and 0.0, respectively. Other material properties are reported in Table TABLE I., where is the transversal Young’s modulus, is the longitudinal Young’s modulus, and is the longitudinal shear modulus. It should be noted that the VFs barely vibrate in the longitudinal direction during phonation, and therefore we implement an in-plane motion constraint by setting the in each layer equal to times (Cook et al., 2008).
TABLE I.
Material properties of the VFs.
| η | ||||
|---|---|---|---|---|
| Cover | 2.041 | 20000 | 10 | 2 |
| Ligament | 3.306 | 33000 | 40 | 3.5 |
| Body | 3.990 | 40000 | 20 | 4 |
The 3D configuration of the FVF wall is shown in Fig. 1d. The overall shape and dimensions of the FVF are based on Agarwal et al. (2003), who measured ten key geometric parameters of the FVF from male and female subjects using laminagraphic tracings of the larynx. In the current study, we match only the two most essential parameters: The FVF medial diameter, which is the diameter of the circle best approximating the medial contour surface of the FVF, and the FVF included surface angle, which is the intercept angle of the lines tangent to the upper and lower surfaces of the FVFs. These two values in the current model are 0.4 cm and 77°, respectively. Before inserting these into the vocal tract model, the pair of FVFs is rotated around the vocal tract axis to form a 23.5° anterior angle, which is measured from the laryngealscopic superior-to-inferior view of the larynx of a human subject, as shown in Fig. 1c. The FVF is located from y = 3.39 cm to y = 5.3 cm, resulting in a 0.225 cm minimum height of the ventricle.
Zero and 1 kPa gauge pressure is applied at the exit and inlet, respectively, to generate a typical 1 kPa pressure drop across the vocal tract (Titze, 2000). The peak jet Reynolds number [defined as , where is the averaged peak velocity at the glottal exit, is the average maximum glottal gap width, and ν is the kinematic viscosity of air (Triep and Brücker, 2010)] is about 320. No-slip, no-penetration flow conditions are applied on all the walls. A zero displacement boundary condition is imposed on the lateral surfaces of the VF and a traction boundary condition is applied on the medial surface. The anterior and posterior ends of the VFs are fixed to the vocal tract wall to mimic the attachment to the arytenoid and thyroid cartilages.
The flow solver employs a high resolution, non-uniform 64 × 256 × 128 Cartesian grid for the computational domain. The highest grid density is provided around the intraglottal and near-supraglottal region (y = 2.0 cm to y = 5.0 cm) with this region discretized by 64 × 134 × 128 grid with uniform distribution in both the x and y directions and non-uniform distribution in the z direction. The minimum glottal gap width is resolved by at least two points in the z direction. The solid-dynamics solver employs a dense mesh consisting of 63 117 tetrahedral elements to discretize each VF. Such an arrangement of grid resolution is based on our experience with previous 2D and 3D simulations of similar configurations (Zheng et al., 2010, 2011b) and is necessary to resolve the relatively thin internal layers of the VFs.
A small time-step corresponding to 3.5 × 10⁻⁶ seconds is employed for all the simulations, and this results in about 1200 time-steps per vibration cycle. The simulations are conducted for about 30 cycles which contains about 20 stationary cycles, and each simulation takes about 1200 h on 128 processors of an Intel 3.0 GHz Quad-Core IBM iDataplex parallel computer.
Contact models
The simulation is first conducted for a normal laryngeal model where the contact of two VFs occurs at the glottal midline. For this case, a simple elastic hard-wall contact model is incorporated to model the VF collision. Two artificial non-slip and non-penetrable collision planes are placed ±0.005 cm off the medial plane to enforce a finite but small (0.1 mm) minimum glottal gap. While this gap is only 1/10 of the maximum glottal gap, it nevertheless allows some “leakage” flow even during what would be considered as glottal closure and this fact needs to be kept in mind while interpreting the results. Once a VF reaches the contact plane on its side, it will be forced to stop there until forces developed in the simulation act to push apart the VFs.
However, such treatment is only appropriate for normal phonation. With some pathological conditions (such as VF nodules, carcinomas, or unilateral paralysis/paresis), contact might be highly asymmetric and contact location may vary significantly from cycle to cycle (Tanabe et al., 1972). A contact model with a fixed and prescribed contact location is therefore no longer suitable, and a more flexible and robust model is needed to accommodate an arbitrary contact location. In the current study, a phenomenological, non-linear, spring-based contact force model is implemented for the purpose of representing contact in more general contact conditions.
Figure 2a is a schematic representation of the nonlinear spring based contact model. In this model, each surface vertex of the triangular mesh on one VF is connected to every surface vertex on the opposite VF with a non-linear spring. When the two vertexes approach each other and reach a distance smaller than a certain criterion, the spring force is activated and applies a retarding force along the direction of the line joining the two contacting nodes. The non-linear spring force is assumed to have the following form:
where F is the spring force (in Newtons), d is the distance (in cm) between two contacting nodes, and D is the distance below which the spring force is activated. The exponential variation is capable of providing a rapid but smooth buildup of contact force. The coefficient corresponds to the maximum contact force and coefficients A and exponent m allows us to adjust how “hard” the contact is. The values of these coefficients are currently chosen so as to produce a sufficient force to stop the VFs with a small (about 1.5% the VF length) but finite gap between them. This gap is necessary to ensure computational robustness and minimize spurious effects associated with under-resolution of the intraglottal flow for small gaps. In the current simulations, the following values are employed: m = 3, , , and Figure 2b is the plot of the spring force (F) versus the distance between two contacting nodes (d) and it shows that the spring force initially grows slowly for 0.015 cm < d < 0.023 cm but then increases rapidly for d< 0.015 cm. This spring force is further decomposed into components which are normal and tangential with respect to the local surface, and only the normal component of force is applied as the contact force. The contact force is added as an external force term into the finite-element equations in order to incorporate the contact effect into the dynamics of the VFs.
Figure 2.

(Color online) (a) Illustration of the nonlinear spring-based contact force. Each surface vertex of the triangular mesh on one VF is connected to every surface vertex on the opposite VF with non-linear springs. The solid line represents activated springs and the dashed line represents inactivated springs. “F” is the spring force and it is further decomposed into “Fn” and “Ft,” which are the normal and tangential components with respect to the local curvature of the VF surface, respectively. (b) Spring force versus distance between two contacting nodes.
While the above model attempts to mimic some salient features of contact (such as non-linearity and non-normal contact), it is in the end, a phenomenological model which is not based on first-principles. Unfortunately, data on VF contact that could be used to develop a more physics-based contact model is currently lacking. In the absence of this knowledge, the current phenomenological model is designed with the objective of being flexible in representing a wide variety of contact conditions, and to enable a robust simulation of phonation.
RESULTS AND DISCUSSION
Glottal waveforms
Simulation results for the model of the normal larynx are presented first. Several essential voice quality-related statistical quantities computed from the waveform of the glottal flow rate are reported in Table TABLE II. and compared to the typical ranges found invivo and invitro in previous works. It is noted that all of these quantities are consistent with typical values and this provides confidence that the current model and simulation approach is reproducing correctly the essential biomechanics of phonation.
TABLE II.
Statistical quantities computed from the current normal (symmetric) laryngeal model compared to typical ranges reported by previous studies. F0 is the fundamental frequency; and are the peak and mean glottal flow rate, respectively; is the open quotient, defined as , where is the duration of glottal open phase; is the skewness quotient, defined as where is the duration of the glottal acceleration phase and is the duration of the glottal deceleration phase.
| Computed | Typical | |
|---|---|---|
| Value | Range | |
| () | 243.5 | 65–260 (Zemlin, 1988) |
| () | 299.65 | 200–580 (Hertegard et al., 1992) |
| () | 147.55 | 110–220 (Zemlin, 1988) |
| 0.67 | 0.4–0.7 (Titze, 2000) | |
| 1.19 | 1.1–3.4 (Ishizaka and Flanagan, 1972; Lamar et al., 2003; Duncan et al., 2006) |
Figures 3b, 3c, 3d present the waveforms of the following three variables over two successive cycles: The glottal gap width, glottal exit velocity, and the glottal exit pressure. To investigate the influence of the longitudinal variation of the geometric model on the flow and VF vibration, these three quantities are extracted at five coronal planes: x = 0.225, 0.475, 0.8, 1.125, and 1.375 cm [as shown in Fig. 1b]. A zoomed-in view of the glottal flow rate waveform on two corresponding cycles is presented in Fig. 3a for the sake of comparison with the other quantities. This plot provides a glimpse of the leakage flow associated with the incomplete glottal closure, which we found to be about 25 ml/s, and which is less than 10% of the maximum glottal volume flux.
Figure 3.
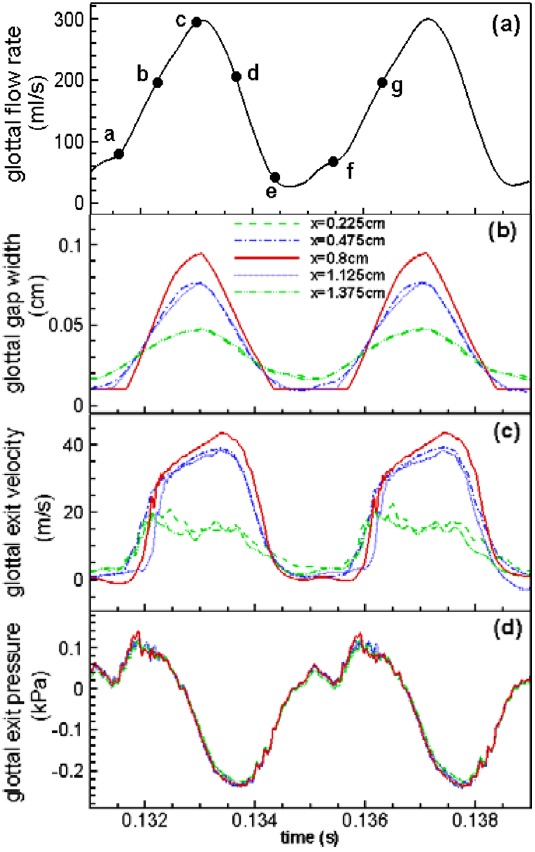
(Color online) Time-variation of several important quantities over two successive cycles including: (a) glottal flow rate; (b) glottal gap width; (c) glottal exit velocity; (d) glottal exit gauge pressure. (b)–(d) are plotted at five coronal planes.
During the phonatory vibrations, the VFs are elevated to a higher vertical position due to the net pressure force on the inferior surface of the VFs. Therefore, the glottal exit moves up to the plane of (from an initial location of y = 3.0 cm), and this is the plane where the glottal exit velocity and pressure are measured. It can be observed that the VF vibrations as well as the flow through the glottis are almost symmetric about the mid-coronal plane. Thus, the substantial anterior–posterior inclination of the FVFs does not produce noticeable asymmetric effects on the upstream flow through the glottis as well as the VF vibrations. A further comparison between Figs. 3a, 3b indicates a phase-lag of about 6° between the maximum values of volume flow rate and gap width. This phase lag is mainly caused by the air-inertia which delays the buildup of the jet column with respect to the movement of the VFs.
As described in Sec. 2, the VFs have been fixed at the two ends to mimic the anterior/posterior attachment to the cartilage; therefore, the amplitude of the glottal gap width decreases monotonically from the mid-coronal plane to each fixed end. The resulting small gap at each end constantly leaks a small amount of flow during the vibration, even when the glottis is fully closed at the center-plane. Interestingly, a significant majority of middle-aged and elderly women have incomplete glottal closure, mainly at the anterior/posterior ends (Södersten et al., 1995; Biever and Bless, 1989). Thus, the current result is not an unreasonable representation of normal phonation in human adults.
As shown in Fig. 3c, the glottal exit velocity waveform also varies along the anterior–posterior direction. The maximum glottal jet velocity is at the center and has a value of 43 m/s, which is in line with typical values measured during phonation (Alipour and Scherer, 1995). The jet velocities at planes corresponding to x = 0.8, 0.475, and 1.125 cm in Fig. 3c are observed to rise quickly during the early opening stage, but then slow down as the maximum is approached. The drop in velocity is uniformly rapid during the flow deceleration phase. The effect of air inertia is evident from this plot since the flow maintains its acceleration even though the glottis has started to close. The velocity waveform close to the longitudinal boundaries exhibits different behaviors; at planes of x = 0.225 cm and x = 1.375 cm in Fig. 3c, flow increases quickly at the beginning of the cycle, but then drops at a slow rate during the rest of the cycle. The delay of the maximum flow rate and glottal jet velocity after glottal maximum opening was also observed in experimental measurement in both excised canine larynges and mechanical scaled-up VF models (Krane et al., 2007; Alipour and Scherer, 1995). The gauge pressure at the glottal exit shown in Fig. 3d indicates that there is no noticeable anterior–posterior variation in this quantity; it decreases as the jet velocity increases and vice versa, and is below zero during most of the cycle.
Glottal jet evolution
Figure 4 shows a plot of the iso-surface of vorticity magnitude at five time instants [indicated in Fig. 3a with “•”] during one vibration cycle. Figure 5 plots the velocity vectors and 3D swirl strength contours at the mid-coronal plane at the corresponding time-instants as well as two additional time-instants from the subsequent cycle. For the sake of clarity, the velocity vectors from every three points in both the y and z directions are shown and each velocity vector has been normalized to unit length so that even weak flow motions can be clearly observed. In the subsequent sections, we will use (a)–(g) to refer these seven instants.
Figure 4.

(Color online) The iso-surface of vorticity magnitude at six different time instants over one cycle. (a) t = 0.1316 s, (b) t = 0.1323 s, (c) t = 0.1330 s, (d) t = 0.1337 s, and (e) t = 0.1344 s.
Figure 5.
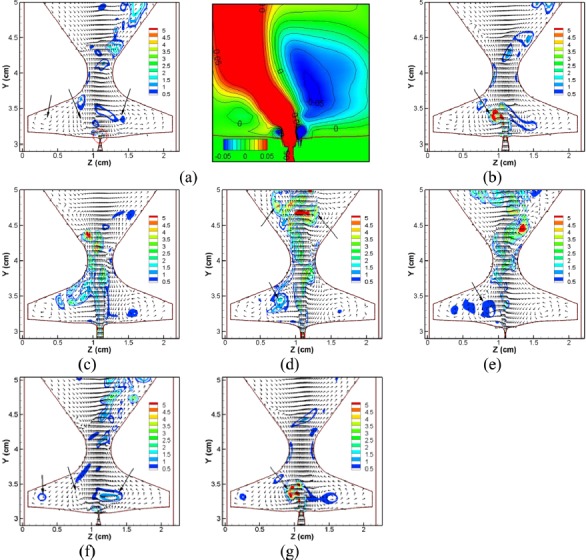
(Color online) Normalized velocity vectors and 3D swirl strength contours at the mid-coronal plane at five time instants over one cycle and two more time instants in the subsequent cycle. (a) t = 0.1316 s, (b) t = 0.1323 s, (c) t = 0.1330 s, (d) t = 0.1337 s, (e) t = 0.1344 s, (f) t = 0.13545 s, and (g) t = 0.1363 s. The figure in (a) is the zoomed-in view of the vertical velocity contours in the near-downstream region of the glottis.
As discussed in Sec. 2, there is a constant flow leakage at the anterior/posterior ends. Therefore, at the beginning of the cycle, the glottal jet in Fig. 4a is broken into two columns, emanating from anterior and posterior ends. At this early stage, a slight skewing of the jet to the left side is observed. The corresponding velocity vector plot [Fig. 5a] clearly reveals the presence of a counter-clockwise (CCW) vortex in the right ventricle and a pair of counter-rotating vortices in the left ventricle. The swirl strength of these vortices indicates that they are very weak. Figure 5a also provides a zoomed-in view of the vertical velocity contours in the region immediately downstream of the glottis. The CCW vortex in the right ventricle is very near the glottal exit, resulting in a large area of negative vertical velocities at the right side of the glottal exit. The CCW vortex in the left ventricle, which is a little further away from the glottal exit, generates positive vertical velocities on the left side downstream of the glottal exit. At this stage, the glottal flow is very weak and more susceptible to downstream disturbance. Consequently, as the glottis starts to open at the mid-plane, the incipient jet immediately encounters a blockage on its right side due to the CCW rotating jet from the right ventricle and deflects to the left; this deflection is aided by the entrainment induced by the CCW vortex in the left ventricle.
As the glottis opens further [Figs. 4b and 4c], the glottal gap width and the column of the glottal jet in the center increase quickly. The glottal jet also experiences a spreading due to the transverse diffusion of the shear layer and the entrainment between the high momentum jet core and the surrounding flow. The glottal jet continues to deflect to the left side and at instant (c), it attaches to the left FVF. Figure 5b shows that the CCW vortex in the left ventricle is strengthened by the accelerating jet and further inclines the front portion of the jet to the left side. On the other hand, due to the high vertical momentum of the jet, it tends to straighten out considerably at this phase of the cycle.
Shortly after instant (c), the glottal jet starts to decelerate and becomes unstable. In Fig. 4d, a wavy pattern starts to develop in the downstream region (y > 4.0 cm).This wave-like pattern is termed as a “flapping jet” (Neubauer et al., 2007) and is generated by an anti-symmetric array of count-rotating vortices (Gordeyev and Thomas, 2000; Thomas and Brehob, 1986; Neubauer et al., 2007). The corresponding velocity vector plot [Fig. 5d] shows that the flapping pattern is well correlated with a pair of counter-rotating vortices in the downstream region. During the late closing phase, the glottal flow decelerates quickly and becomes more susceptible to the disturbance resulting from the remnant vortices. Therefore, a larger deflection of the upstream portion of the jet and a stronger wavy pattern in the downstream portion occurs during this stage [instant (e)]. Figures 5d, 5e also indicate that the vortices in the ventricle dissipate quickly during the closing phase, and that the vortex in the left ventricle remains much stronger than the one in the right ventricle. Thus, the jet is again entrained toward the left side of the glottis.
During glottal closure [Fig. 5f], the three large vortices in the ventricle reappear in a configuration that is very similar to the previous cycle and continue to deflect the jet to the left [Fig. 5g]. Interestingly we have found that flow develops a preferential direction of deflection (left in this case) which can persist for many cycles. Note that in 2D simulations (Zheng et al., 2009) the jet deflection switched directions very rapidly from cycle-to-cycle but the switching was less frequent in the 3D planar model (Zheng et al., 2011b). The current model, which has additional 3D features than the previous 3D planar model, shows an even longer time-scale associated with direction switching in the glottal jet, which seems to be consistent with the effect of three-dimensionality. It should be noted that the asymmetric glottal jet deflection discussed here refers to supraglottal jet deflection and not to deflection inside the glottis.
Thus, although the vortex structures and jet evolution observed in the current model is seemingly different from that observed in the 2D model (Zheng et al., 2011a), the mechanism for the jet deflection is consistent with that identified in the 2D model in that it is dominated by the downstream vortex dynamics. This conclusion is also consistent with the very recent work of Mattheus and Brücker (2011) which investigated the differences of asymmetric jet deflection in 2D and 3D models. In this work, the authors found that 3D glottal jets differ from the 2D jets due to the presence of the axis-switching phenomenon and smaller deflection angles. However, even though the flow field in 2D and 3D models is very different, the jet deflection in both models was found to be associated with the supraglottal vortex structures.
VF deformation
Figure 6 shows the trajectories of the five selected points along the medial surface of the VF at the mid-coronal plane during the stationary state. All of these five points move along CCW elliptical paths and the area surrounded by these elliptical paths decreases from the superior to the inferior direction. This movement pattern is in good agreement with invitro measurement of VF trajectory in excised canine (Berry et al., 2001) and human larynges (Boessenecker et al., 2007). Recent quantitative invivo measurements of the medial surface trajectories of a canine VF during phonation also confirm that the largest deformation occurs around the superior portion of the VFs (Döllinger et al., 2005a, 2005b).
Figure 6.
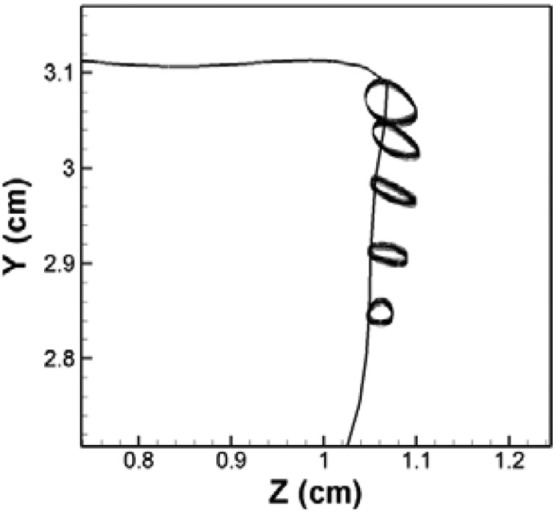
The trajectories of five points along the medial surface of the VF at the mid-coronal plane during stationary cycles for the normal (symmetric) model. These can be compared to the trajectories of points along the medial surface of the VF extracted from high-speed digital imaging of excised canine (Berry et al., 2001) and human (Boessenecker et al., 2007) larynges.
Figure 7 illustrates the VF vibration pattern captured in this study, which includes superior views (first row) as well as the center-plane configurations (second row) at five different time instants within a single stationary-state vibration cycle. The five time instants chosen here are the same as in Figs. 45. The VF surface velocity vectors are also superimposed on center-plane configurations to further illustrate the direction and speed of the movement. From the series of center-plane configurations, the “convergent–divergent” vibration pattern can be clearly observed.
Figure 7.
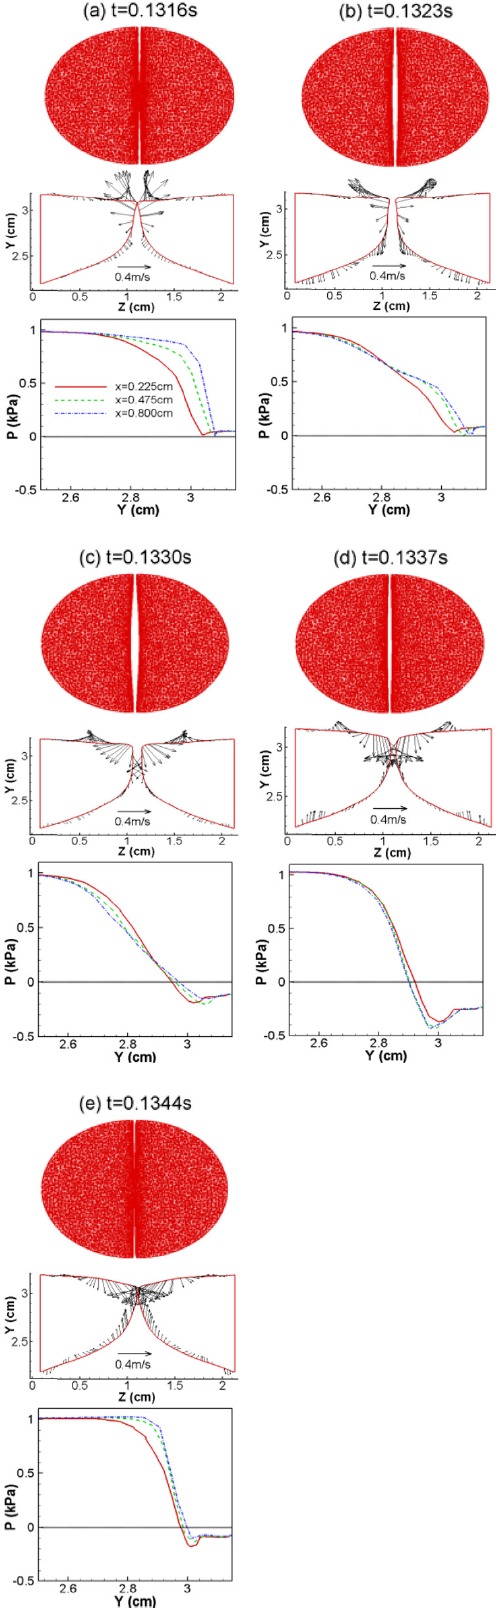
(Color online) Top view of the VF vibration pattern (first row), VF surface velocity (second row), and pressure along one of the VFs (third row) at six time instants over one vibration cycle for the normal (symmetric) model.
During the opening stage [shown in (a) to (b)], the airflow pushes the glottis to open gradually from beneath, and the two medial surfaces form a convergent shape. A strong lateral motion can also be observed during this stage and the superior and inferior portions of the VFs also experience upward and downward vertical motion, respectively. This is a manifestation of tissue incompressibility since as the VFs are compressed at the medial surface, the superior and inferior portions have to move in the vertical direction to conserve the overall volume.
During the closing stage [shown in (c) to (e)], the glottis transitions from the convergent shape to a nearly straight channel [shown in (c)], and finally, to a divergent shape [shown in (d) and (e)]. During this stage, due to the elastic recoil, the VFs try to recover the initial shape and the superior and inferior surfaces move downward and upward, respectively. The largest velocity always occurs at the superior tip of the VFs. This convergent–divergent glottis shape has been proved to be the essential mechanism for the continuous transfer of mechanical energy from the airflow to the VF (Titze, 1988; Thomson et al., 2005).
To further investigate the VF dynamics, the aerodynamic pressure along the surface of one of the VFs is shown in the third row of Fig. 7. The pressure shown here is gauge pressure with respect to the pressure at the exit. Thus, a pressure lower than the exit pressure is referred to as a “pulling force” while the pressure larger than exit gauge pressure is considered as a “pushing force” (Titze, 2006). The plots represent three anterior–posterior planes in the anterior half of the model. At the beginning of the cycle [(a)], the largest pressure gradient across the glottis occurs at the center plane and both subglottal and supraglottal pressures remain positive. This positive pressure produces pushing forces on VFs and forces them to open. When VFs open further [(b)], the pressure gradient across the glottis starts to decrease. When the glottis transitions to the closing phase (d), a negative pressure first occurs at the supraglottal region and propagates inside the glottis (e). The negative pressure causes a pulling force on the VFs, thereby assisting closure. It is noted that the maximum negative pressure always occurs at the location of the smallest orifice which is consistent with the Bernoulli equation.
To further quantify the VF dynamics, the method of empirical eigenfunction (EEF) is employed to extract the principal modes of the VF deformation. This analysis is performed on VF deformation fields of 18 successive stationary state vibration cycles. Figure 8 shows the two most energetic eigenfunctions, which together capture 98% of the total energy of VF vibrations. The first mode presents the mostly lateral motion of the VFs and captures 52% of the energy. This mode is responsible for modulating the glottal airway and generating the monopole source of the sound. The second empirical function presents the alternating convergent–divergent glottal shapes and captures 46% of the energy. Note that the second EEF also contains a clear vertical motion occurring on the superior surface of the VFs: The superior tip of the VF is lifted up to a higher vertical position in the convergent glottis and descends to a lower vertical position in the divergent glottis. The simultaneous occurrence of the rotational lateral motion and the vertical motion is considered natural because the pressure force acts in a direction normal to the VF surface, thereby pushing the convergent glottis upward and the divergent glottis downward.
Figure 8.
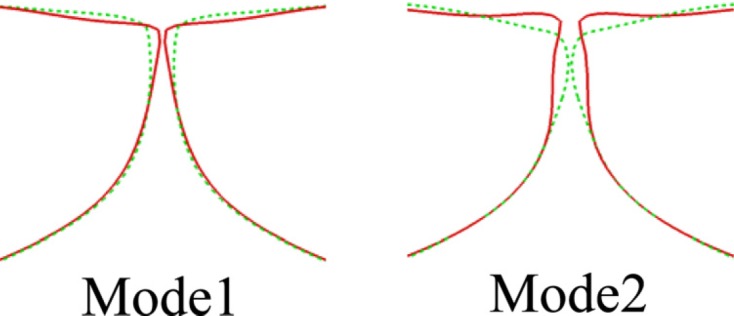
(Color online) The mid-coronal medial profile of the most energetic two empirical eigenmodes of the VFs at two-extreme phases for the normal (symmetric) model.
The shape of the two eigenmodes as well as the associated total energy percentage (98%) are found to be very similar to those extracted from high-speed imaging of the hemi-larynx (Berry et al., 2001). However, the energy ratio between the two modes is different; in the experiments the first and second modes captured 69% and 29% of the total energy, respectively, while in the current study they capture 52% and 46%, respectively. Zhang et al. (2007) pointed out that the modal energy-ratio is affected by many parameters, such as structural damping and jet velocity. Recently, Xue et al. (2011) showed that the internal structure of the VFs can also change the relative energy and even the modal sequence of the vibratory modes. Therefore, different energy ratios are not unexpected in different models. For instance, Berry et al. (1994) employed the method of EEF to investigate the effect of material compressibility on VF vibrations and found that the two principle modes retain the same shape as for the case of incompressible tissue but the sequence of the modes is switched.
It is also interesting to note that in our previous study where the vocal tract was represented by a rectangular channel (Zheng et al., 2011b), there was a third principle mode representing a purely streamwise motion which contains 18% of the vibration energy. This mode also exists in the current study; however, the associated energy is reduced to 1.1%. The significant diminishment of the third mode is likely due to the improvement of the geometric model which imposes more surface constraints on the VFs. Compared to the rectangular vocal tract model in Zheng et al. (2011b), the current tubular model imposes a stronger holding force from the boundary on the VFs, thereby preventing the streamwise vibration of VFs. It is important to note that there is generally no strong streamwise motion in the physiological observations of real phonation (Döllinger et al., 2005b; Döllinger and Berry, 2006; Boessenecker et al., 2007) and thus, the higher level of realism in the current model enhances the model fidelity in measurable ways.
The two modes vibrate at the same frequency of 243 Hz, which is also the fundamental frequency. This is a clear manifestation of 1:1 modal entrainment, which is a characteristic feature of normal phonation (Berry et al., 1994; Berry et al., 2001; Zhang et al., 2007). For the irregular voice, the vibratory modes may not entrain at all or entrain at different ratios (Berry et al., 2001). For instance, a 2:3 entrainment pattern was observed in high-speed imaging of VF vibrations in paralyzed larynges, wherein one of the modes vibrated at a lower frequency and the other vibrated at a higher frequency (Mergell et al., 2000). Such irregularity is very common in laryngeal paralysis (Berry et al., 2001).
Effect of VF tension asymmetry on phonation
Given that the model developed here predicts many verifiable details regarding the dynamics of phonation it is well suited to study phonation in abnormal situations since the abnormality can introduce additional complexity to the dynamics. Here we use the model to study the effect of unilateral superior laryngeal nerve (SLN) paralysis. In our model, unilateral SLN paralysis is modeled by introducing a tension imbalance between the two VFs. This is accomplished via a reduction in the transverse and longitudinal Young’s moduli of three inner layers of the left VF (in this case by 20% to model moderate imbalance) while keeping the material properties of the right VF the same as the previous healthy model. The initial shape of the VFs and airway lumen as well as the boundary conditions are also kept the same as the normal laryngeal model discussed in Sec. 2A.
With unilateral paralysis, the contact locations of the two VFs can vary significantly from cycle to cycle (Tanabe et al., 1972). Thus, the kinematic “hard-wall” contact model used in the symmetric laryngeal models of past studies (Luo et al., 2008, 2009; Zheng et al., 2010, 2011b) is no longer suitable and the phenomenological non-linear spring based contact force model described in Sec. 2B becomes particularly necessary.
Figure 9 shows contours of the contact force applied on the VFs and the corresponding medial profile of the VFs at the mid-coronal plane at three contact instants for the case with tension asymmetry. At t = 0.1181 s, the two VFs are approaching each other and the minimum distance between them is around 0.128 mm. At this instant, the contact force is comparatively weak and localized at the superior portion of the center region. As the glottis closes further, the contact force increases rapidly and at t = 0.1183 s, the contact force at the VF center is nearly 16 times higher than the one at t = 0.1183 s. Meanwhile, the contact area gradually extends toward the anterior/posterior ends with the contact force smoothly decreasing from the center to end. At this instant, the VFs are completely stopped with a minimum distance around 0.096 mm, which allows at least two computational grids between the two VFs to assure the success of the flow solver. The above observation shows that the proposed contact model is capable of acting rapidly to stop the VFs within a very short time period without affecting the dynamics of VFs in the rest of the cycle. At t = 0.1186 s, the two VFs start to move apart due to the combination of the contact force and elastic recoil and the contact force reduces again with the increasing glottal gap.
Figure 9.
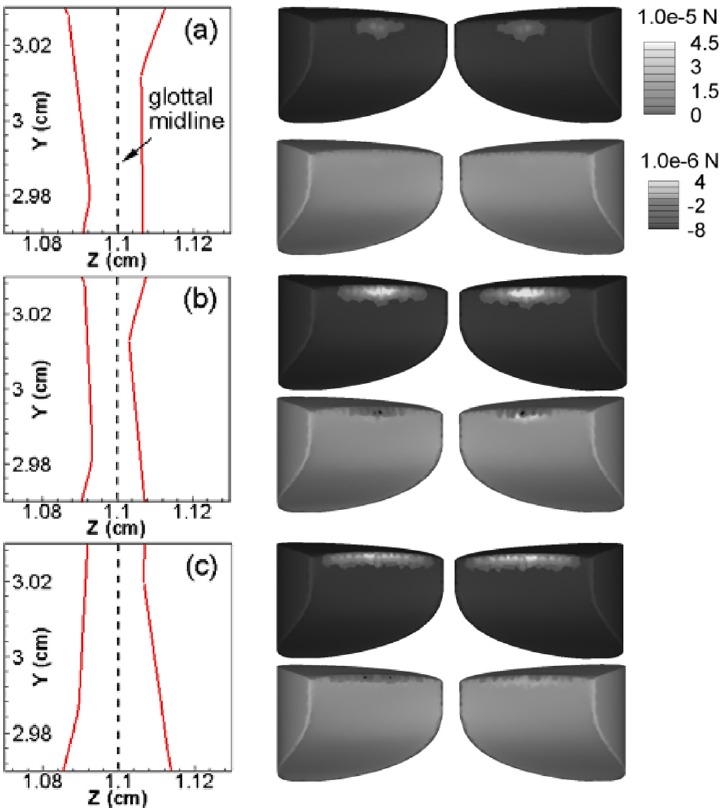
(Color online) Medial profile of the VFs at the mid-coronal plane (left column) and contour of contact forces applied on the VFs (right column) at three contact time instants for the tension-imbalanced (asymmetric) model. The contact forces in the lateral and vertical directions are shown respectively in the upper and lower rows in the right column of each time instant. (a) t = 0.1181 s, the time instant when the two VFs are moving toward each other and the contact force is just activated, (b) t = 0.1183 s, the time instant of minimum glottal gap width, (c) t = 0.1186 s, the time instant when the two VFs are moving apart.
Figure 9 also shows that contact begins at the center of the VFs and progresses toward the anterior/posterior ends. This is consistent with our previous observation that the glottis starts to close first at the center. Second, while the distribution of the contact force in the lateral direction is almost symmetric on two VFs, the distribution of the contact force in the vertical direction presents asymmetry. It is likely due to the fact that the left VF is vibrating at a higher equilibrium position than the right one. It is also found that the vertical component of the contact force is generally 1 order of magnitude smaller than the lateral component which is also in line with our expectation since the collision of VFs is mostly in the lateral direction.
The simulation of the asymmetric model is conducted over a longer duration of 30 cycles due to the more complex dynamics of this case. An examination of the flow-field indicates that the jet evolution and vortex dynamics in the supraglottal region in this case is not distinctly different from the symmetric VF case. Table TABLE III. compares the important statistical quantities for this case and it is noted that the 20% tension imbalance between the two VFs also does not have a noticeable effect on the fundamental phonation frequency. However, a significant (88.2%) increase in the leakage flow rate is observed in the asymmetric model. This implies a much larger glottal resting gap in the asymmetric model, which could be the result of a non-synchronous motion of the two VFs. A larger leakage flow also results in increases in the mean flow rates () and the peak flow rates () in the asymmetric model, which are 21.9% and 4.4% higher, respectively, than the corresponding values of the normal VF model.
TABLE III.
Comparison of statistical quantities of glottal flow rate and glottal gap width between symmetric (Sym) and asymmetric (Asy) cases.
| Sym | Asy | ||
|---|---|---|---|
| () | 243 | 239 | −1.6% |
| () | 299.7 | 312.69 | +4.3% |
| () | 198.4 | 179.9 | +21.9% |
| () | 27.4 | 51.62 | +88.2% |
| () | 95.0 | 90.14 | −5.2% |
| () | 157019 | 138969 | −11.5% |
| () | 0.942 | 0.889 | −5.6% |
| Amplitude of () | 0.841 | 0.754 | −10.3% |
The unsteady glottal flow rate has a direct relation to the sound quality (Zhao et al., 2002; Zhang et al., 2002). Two additional quantities: The root-mean-square fluctuation of the flow rate and the root-mean-square fluctuation of the time-rate change of the flow rate , are computed to further investigate the impact of tension imbalance on voice quality; indicates the intensity of glottal flow rate fluctuations and further connects to the intensity of VF vibrations, and is directly related to the monopole sound strength. It is found that and decrease by 5.2% and 11.5%, respectively, from the symmetric model to the asymmetric model. Meanwhile, we also find that the maximum gap width and the amplitude of the glottal gap decrease 5.6% and 10.3%, respectively, in the asymmetric model. These results suggest that the presence of tension imbalance would require an additional effort for maintaining sound intensity and might perhaps even increase the threshold pressure for phonation.
Changes in voice-quality can ultimately be correlated with changes in the vibratory characteristics of the VFs. Eigenmode analysis, which is the traditional means of characterizing VF dynamics, indicates little difference in the two configurations due to the moderate level of asymmetry. We therefore turn to other methods of analyses which might help us differentiate the vibratory behavior for these two cases.
Figure 10 shows the phase-plane plots of the displacement of the two VFs for both symmetric and asymmetric cases. The displacement is measured at the point on the superior tip of the mid-coronal plane of the VFs, as shown in Fig. 2b. The plots clearly show that both symmetric and asymmetric cases are undergoing periodic, limit-cycle oscillations. The symmetric case lies on the 45° line, indicating a high level of symmetry in the vibration of the two VFs. With tension asymmetry, the system reveals an elliptical trace with slight cycle-to-cycle variations. In these elliptical loops, the glottal opening phase corresponds to the upper half, and the glottal closing phase corresponds to the lower half. Therefore, these plots suggest that the right (healthy) VF precedes the left (soft) side in phase during the vibration. In the lateral direction, the long axis of the elliptical loop is found to turn about 10° anti-clockwise around the 45° symmetry line, indicating a larger vibration amplitude on the right (healthy) VF and a smaller amplitude on the left (soft) VF.
Figure 10.

Phase-plane plots of the displacement of two VFs for both symmetric (top row) and asymmetric tension-imbalanced (bottom row) cases. Phase-plane plots for both the lateral (left) and vertical displacements are shown.
This type of vibration pattern is classified as “Type-I” by Ishizaka and Isshiki (1976) and was also observed in high-speed images of live canine larynges (Tanabe et al., 1972). In the current simulation, the differences in the amplitude of lateral vibrations result in a 0.013 cm shift of the collision plane to the left of the mid-plane. Type-I motion is usually associated with a relatively small tension imbalance. For a large tension imbalance, the soft VF will have larger vibration amplitudes than the normal fold and the collision plane will shift to the higher tensioned VF. This dependence of vibration pattern on tension imbalance was observed in physiological experiments on both live dogs and excised canine larynges (Tanabe et al., 1972) and has also been discussed in our previous 2D study (Xue et al., 2010). In the vertical direction, the long axis of the elliptical loop stays oriented along the 45° direction but moves downward from the symmetry line; this indicates that the two VFs have almost the same vibration amplitude while the left (soft) VF vibrates at a higher equilibrium position. This asymmetric equilibrium position is likely to aggravate the desynchronization of the two VFs.
CONCLUSIONS
A 3D laryngeal model has been developed and used to study glottal flow and VF vibrations during phonation. Compared to our previous study (Zheng et al., 2011b), a higher level of geometric realism has been incorporated in the laryngeal model. Self-sustained vibrations and a reasonable glottal flow waveform are captured by the current model and important voice-quality associated parameters are found to be well within the normal physiological ranges. Characteristic features of phonation, including glottal jet evolution, waviness in glottal jet, mucosal wave type VF vibration and 1:1 entrainment of principal modes of vibrations have been discussed in detail. The evolution pattern of glottal jet provides support to the notion that (Zheng et al., 2011a; Mattheus and Brücker, 2011) the glottal flow asymmetry is driven primarily by the postglottal vortex dynamics.
The data from the model with tension-imbalance also leads to a number of observations and insights. First, tension-imbalance reduces the intensity of sound; this implies that tension-imbalance will increase the effort required to maintain the intensity of sound and might also potentially delay the onset of phonation. Second, a larger glottal leakage is found with tension imbalance, which could be indicative of a “breathy” voice. These observations are consistent with our previous findings for 2D models (Xue et al., 2010). Third, we have found that with a slight (20%) tension imbalance, the healthy VF precedes the soft fold in phase and this behavior is consistent with past studies (Tanabe et al., 1972).
All of the above results suggest that the model and modeling approach employed here have the potential for enabling useful insights into the dynamics of phonation in normal and diseased larynges. Higher levels of tension asymmetry as well as other structural asymmetries such as those introduced by VF nodules and carcinomas will be studied with this model in the future.
ACKNOWLEDGMENTS
The project described was supported by Grant No. ROIDC007125 from NIDCD. The computational resources were provided through NSF TeraGrid by NICS under Grant No. TG-CTS100002.
References
- Agarwal, M., Scherer, R. C., and Hollien, H. (2003). “The false vocal folds: shape and size in frontal view during phonation based on laminagraphic tracings,” J. Voice 17(2), 97–113. 10.1016/S0892-1997(03)00012-2 [DOI] [PubMed] [Google Scholar]
- Alipour, F., Berry, D. A., and Titze, I. R. (2000). “A finite-element model of vocal-fold vibration,” J. Acoust. Soc. Am. 108(6), 3003–3012. 10.1121/1.1324678 [DOI] [PubMed] [Google Scholar]
- Alipour, F., and Scherer, R. C. (1995). “Pulsatile airflow during phonation: An excised larynx model,” J. Acoust. Soc. Am. 97(2), 1241–1248. 10.1121/1.412233 [DOI] [PubMed] [Google Scholar]
- Alipour, F., and Scherer, R. C. (2004). “Flow separation in a computational oscillating vocal fold model,” J. Acoust. Soc. Am. 116(3), 1710–1719. 10.1121/1.1779274 [DOI] [PubMed] [Google Scholar]
- Batchelor, G. (1953). The Theory of Homogeneous Turbulence (Cambridge University Press, Cambridge: ), p. 183. [Google Scholar]
- Berry, D. A., Herzel, H., Titze, I. G., and Krischer, K. (1994). “Interpretation of biomechanical simulations of normal and chaotic vocal fold oscillations with empirical eigenfunctions,” J. Acoust. Soc. Am. 95(6), 3595–3604. 10.1121/1.409875 [DOI] [PubMed] [Google Scholar]
- Berry, D. A., Montequin, D. W., and Tayama, N. (2001). “High-speed digital imaging of the medial surface of the vocal folds,” J. Acoust. Soc. Am. 110(5), 2539–2547. 10.1121/1.1408947 [DOI] [PubMed] [Google Scholar]
- Biever, D. M., and Bless, D. M. (1989). “Vibratory characteristics of the vocal folds in young adult and geriatric women,” J. Voice 3(2), 120–131. 10.1016/S0892-1997(89)80138-9 [DOI] [Google Scholar]
- Boessenecker, A., Berry, D. A., Lohscheller, J., Eysholdt, U., and Doellinger, M. (2007). “Mucosal wave properties of a human vocal fold,” Acta Acust. Acust. 93, 815–823. [Google Scholar]
- Cook, D. D., Nauman, E., and Mongeau, L. (2008). “Reducing the number of vocal fold mechanical tissue properties: Evaluation of the incompressibility and planar displacement assumptions,” J. Acoust. Soc. Am. 124(6), 3888–3896. 10.1121/1.2996300 [DOI] [PMC free article] [PubMed] [Google Scholar]
- Döllinger, M., and Berry, D. A. (2006). “Visualization and quantification of the medial surface dynamics of an excised human vocal fold during phonation,” J. Voice 20(3), 401–413. 10.1016/j.jvoice.2005.08.003 [DOI] [PubMed] [Google Scholar]
- Döllinger, M., Berry, D. A., and Berke, G. S. (2005a). “Medial surface dynamics of an invivo canine vocal fold during phonation,” J. Acoust. Soc. Am. 117(5), 3174–3183. 10.1121/1.1871772 [DOI] [PubMed] [Google Scholar]
- Döllinger, M., Tayama, M., and Berry, D. A. (2005b). “Empirical eigenfunctions and medial surface dynamics of a human vocal fold,” Methods Inf. Med. 44(3), 384–391. [PubMed] [Google Scholar]
- Duncan, C., Zhai, G., and Scherer, R. (2006). “Modeling coupled aerodynamics and vocal fold dynamics using immersed boundary methods,” J. Acoust. Soc. Am. 120(5), 2859–2871. 10.1121/1.2354069 [DOI] [PubMed] [Google Scholar]
- Flanagan, J., and Landgraf, L. (1968). “Self-oscillating source for vocal-tract synthesizers,” IEEE Trans. Audio Electroacoust. 16(1), 57–64. 10.1109/TAU.1968.1161949 [DOI] [Google Scholar]
- Gordeyev, S. V., and Thomas, F. O. (2000). “Coherent structure in the turbulent planar jet. Part1. Extraction of proper orthogonal decomposition eigenmodes and their self-similarity,” J. Fluid Mech. 414, 145–194. 10.1017/S002211200000848X [DOI] [Google Scholar]
- Hertegard, S., Gauffin, J., and Karlsson, I. (1992). “Physiological correlates of the inverse filtered flow waveform” J. Voice 6(3), 224–234. 10.1016/S0892-1997(05)80147-X [DOI] [Google Scholar]
- Hirano, M., Kurita, S., and Nakashima, T. (1981). “The structure of the vocal folds,” in Vocal Fold Physiology (University of Tokyo Press, Tokyo, Japan: ), pp. 33–41. [Google Scholar]
- Ishizaka, K., and Flanagan, J. L. (1972). “Synthesis of voiced sounds from a two-mass model of the vocal folds,” Bell Syst. Tech. J. 51(6), 1233–1268. [Google Scholar]
- Ishizaka, K., and Isshiki, N. (1976). “Computer simulation of pathological vocal-cord vibration,” J. Acoust. Soc. Am. 60, 1193–1198. 10.1121/1.381221 [DOI] [PubMed] [Google Scholar]
- Khosla, S., Muruguppan, S., Gutmark, E., and Scherer, R. (2007). “Vortical flow field during phonation in an excised canine larynx model,” Ann. Otol. Rhinol. Laryngol. 116(3), 217–228. [DOI] [PMC free article] [PubMed] [Google Scholar]
- Khosla, S., Murugappan, S., Lakhamraju, R., and Gutmark, E. (2008). “Using particle imaging velocimetry to measure anterior-posterior velocity gradients in the excised canine larynx model,” Ann. Otol. Rhinol. Laryngol. 117(2), 134–144. [DOI] [PMC free article] [PubMed] [Google Scholar]
- Koizumi, T., Taniguchi, S., and Hiromitsu, S. (1987). “Two-mass models of the vocal cords for natural sounding of voice synthesis,” J. Acoust. Soc. Am. 82, 1179–1192. 10.1121/1.395254 [DOI] [PubMed] [Google Scholar]
- Krane, M. H., Barry, M., and Wei, T. (2007). “Unsteady behavior of flow in a scaled-up vocal folds model,” J. Acoust. Soc. Am. 122(6), 3659–3670. 10.1121/1.2409485 [DOI] [PMC free article] [PubMed] [Google Scholar]
- Lamar, M. D., Qi, Y., and Xin, J. (2003). “Modeling vocal fold motion with a hydrodynamic semicontinuum model,” J. Acoust. Soc. Am. 114(1), 455–464. 10.1121/1.1577547 [DOI] [PubMed] [Google Scholar]
- Luo, H., Mittal, R., and Bielamowicz, S. (2009). “Analysis of flow-structure interaction in the larynx during phonation using an immersed-boundary method,” J. Acoust. Soc. Am. 126(2), 816–824. 10.1121/1.3158942 [DOI] [PMC free article] [PubMed] [Google Scholar]
- Luo, H., Mittal, R., Bielamowicz, S., Walsh, R., and Hahn, J. (2008). “An immersed-boundary method for flow-structure interaction in biological systems with applications to phonation,” J. Comput. Phys. 227, 9303–9332. 10.1016/j.jcp.2008.05.001 [DOI] [PMC free article] [PubMed] [Google Scholar]
- Mattheus, W., and Brücker, C. (2011). “Asymmetric glottal jet deflection: Differences of two- and three-dimensional models,” J. Acoust. Soc. Am. 130(6), 373–379. 10.1121/1.3655893 [DOI] [PubMed] [Google Scholar]
- McGowan, R. S. (1988). “An aeroacoustic approach to phonation,” J. Acoust. Soc. Am. 83(2), 696–704. 10.1121/1.396165 [DOI] [PubMed] [Google Scholar]
- Mergell, P., Herzel, H., and Titze, I. R. (2000). “Irregular vocal-fold vibration—high-speed observation and modeling,” J. Acoust. Soc. Am. 108(6), 2996–3002. 10.1121/1.1314398 [DOI] [PubMed] [Google Scholar]
- Mittal, R., Zheng, X., Bhardwaj, R., Seo, J. H., Xue, Q., and Bielamowicz, S. (2011). “Towards a simulation-based tool for the treatment of vocal fold paralysis,” Front Comput. Physiol. Med. 2(19), 1–15. [DOI] [PMC free article] [PubMed] [Google Scholar]
- Neubauer, J., Zhang, C., Miraghaie, R., and David, A. B. (2007). “Coherent structure of the near field flow in a self-oscillating physical model of the vocal folds,” J. Acoust. Soc. Am. 121(2), 1102–1118. 10.1121/1.2409488 [DOI] [PubMed] [Google Scholar]
- Rosa, M. O., Pereira, J. C., Grellet, M., and Alwan, A. (2003). “A contribution to simulating a three-dimensional larynx model using the finite-element method,” J. Acoust. Soc. Am. 114(5), 2893–2950. 10.1121/1.1619981 [DOI] [PubMed] [Google Scholar]
- Schwarze, R., Mattheus, W., Klostermann, J., and Brücker, C. (2011). “Starting jet flows in a three-dimensional channel with larynx-shaped constriction,” Comp. Fluids 48, 68–83. 10.1016/j.compfluid.2011.03.016 [DOI] [Google Scholar]
- Södersten, M., Hertegård, S., and Hammerberg, B. (1995). “Glottal closure, transglottal airflow, and voice quality in healthy middle-aged women,” J. Voice 9(2), 182–197. 10.1016/S0892-1997(05)80252-8 [DOI] [PubMed] [Google Scholar]
- Steinecke, I., and Herzel, H. (1995). “Bifurcations in an asymmetric vocal fold model,” J. Acoust. Soc. Am. 97, 1571–1578. 10.1121/1.412061 [DOI] [PubMed] [Google Scholar]
- Story, B. H., and Titze, I. R. (1995). “Voice simulation with a body-cover model of the vocal folds,” J. Acoust. Soc. Am. 97, 1249–1260. 10.1121/1.412234 [DOI] [PubMed] [Google Scholar]
- Suh, J., and Frankel, S. H. (2007). “Numerical simulation of turbulence transition and sound radiation for flow through a rigid glottal model,” J. Acoust. Soc. Am. 121, 3728–3739. 10.1121/1.2723646 [DOI] [PubMed] [Google Scholar]
- Švec, J. G., and Schutte, H. K. (1996). “Videokymography: High-speed line scanning of vocal fold vibration,” J. Voice. 10(2), 201–205. 10.1016/S0892-1997(96)80047-6 [DOI] [PubMed] [Google Scholar]
- Tanabe, M., Isshiki, N., and Kitajima, K. (1972). “Vibratory pattern of the vocal cord in unilateral paralysis of the cricothyroid muscle: an experimental study,” Acta Oto-Laryngol. 74, 339–345. 10.3109/00016487209128460 [DOI] [PubMed] [Google Scholar]
- Tao, C., and Jiang, J. J. (2006). “Anterior-posterior biphonation in a finite-element model of vocal fold vibration,” J. Acoust. Soc. Am. 120(3), 1570–1577. 10.1121/1.2221546 [DOI] [PubMed] [Google Scholar]
- Thomas, F. O., and Brehob, E. G. (1986). “An investigation of large-scale structure in the similarity region of a two-dimensional turbulent jet,” Phys. Fluids 29, 1788–1795. 10.1063/1.865606 [DOI] [Google Scholar]
- Thomson, S. L., Mongeau, L., and Frankel, S. H. (2005). “Aerodynamic transfer of energy to the vocal folds,” J. Acoust. Soc. Am. 118(3), 1689–1701. 10.1121/1.2000787 [DOI] [PubMed] [Google Scholar]
- Titze, I. R. (1973). “The human vocal cords: A mathematical model, Part I.,” Phonetica 28, 129–170. 10.1159/000259453 [DOI] [PubMed] [Google Scholar]
- Titze, I. R. (1974). “The human vocal cords: A mathematical model, part II.,” Phonetica 29, 1–21. 10.1159/000259461 [DOI] [PubMed] [Google Scholar]
- Titze, I. R. (1988). “The physics of small-amplitude oscillation of the vocal folds,” J. Acoust. Soc. Am. 83, 1536–1552. 10.1121/1.395910 [DOI] [PubMed] [Google Scholar]
- Titze, I. R. (2000). Principles of Voice Production (National Center for Voice and Speech, Iowa City, IA: ), p. 354. [Google Scholar]
- Titze, I. R. (2006). The Myoelastic Aerodynamic Theory of Phonation (National Center for Voice and Speech, Iowa City, IA: ). [Google Scholar]
- Titze, I. R., and Story, B. (2002). “Rules for controlling low-dimensional vocal fold models with muscle activation,” J. Acoust. Soc. Am. 112, 1064–1076. 10.1121/1.1496080 [DOI] [PubMed] [Google Scholar]
- Triep, M., and Brücker, Ch. (2010). “Three-dimensional nature of the glottal jet,” J. Acoust. Soc. Am. 127(3), 1537–1547. 10.1121/1.3299202 [DOI] [PubMed] [Google Scholar]
- Triep, M., Brücker, Ch., and Schröder, W. (2005). “High-speed PIV measurements of the flow downstream of a dynamic mechanical model of the human vocal folds,” Exp. Fluids. 39, 232–245. 10.1007/s00348-005-1015-3 [DOI] [Google Scholar]
- Wong, D., Ito, M., Cox, N., and Titze, I. (1991). “Observation of perturbation in a lumped-element model of the vocal folds with application to some pathological cases,” J. Acoust. Soc. Am. 89, 383–394. 10.1121/1.400472 [DOI] [PubMed] [Google Scholar]
- Xue, Q., Mittal, R., Zheng, X., and Bielamowicz, S. (2010). “A computational study of the effect of vocal-fold asymmetry on phonation,” J. Acoust. Soc. Am. 128(2), 818–827. 10.1121/1.3458839 [DOI] [PMC free article] [PubMed] [Google Scholar]
- Xue, Q., Zheng, X., Mittal, R., and Bielamowicz, S. (2011). “Sensitivity of vocal-fold vibratory modes to their three-layer structure: Implication for simulation based phonosurgical planning,” J. Acoust. Soc. Am. 130(2), 965–976. 10.1121/1.3605529 [DOI] [PMC free article] [PubMed] [Google Scholar]
- Yang, A., Lohscheller, J., Berry, D. A., Becker, S., Eysholdt, U., Voigt, D., and Döllinger, M. (2010). “Biomechanical modeling of the three-dimensional aspects of human vocal fold dynamics,” J. Acoust. Soc. Am. 127(2), 1014–1031. 10.1121/1.3277165 [DOI] [PMC free article] [PubMed] [Google Scholar]
- Zemlin, W.R. (1988). Speech and Hearing Science: Anatomy and Physiology, 3rd ed. (Prentice Hall, Englewood Cliffs, NJ: ), p. 610. [Google Scholar]
- Zhang, C., Zhao, W., Frankel., S. H., and Mongeau, L. (2002). “Computational aeroacoustics of phonation, Part II: Effects of flow parameters and ventricular folds,” J. Acoust. Soc. Am. 112(5), 2147–2154. 10.1121/1.1506694 [DOI] [PubMed] [Google Scholar]
- Zhang, Z., Neubauer, J., and Berry, D. A. (2007). “Physical mechanisms of phonation onset: A linear stability analysis of an aeroelastic continuum model of phonation,” J. Acoust. Soc. Am. 122(4), 2279–2295. 10.1121/1.2773949 [DOI] [PubMed] [Google Scholar]
- Zhao, W., Frankel, S. H., and Mongeau, L. (2001). “Numerical simulations of sound from confined pulsating axisymmetric jets,” AIAA J. 39, 1868–1874. 10.2514/2.1201 [DOI] [Google Scholar]
- Zhao, W., Zhang, C., Frankel, S. H., and Mongeau, L. (2002). “Computational aeroacoustics of phonation, Part I: Computational methods and sound generation mechanisms,” J. Acoust. Soc. Am. 112(5), 2134–2146. 10.1121/1.1506693 [DOI] [PubMed] [Google Scholar]
- Zheng, X., Bielamowicz, S., Luo, H., and Mittal, R. (2009). “A computational study of the effect of false vocal folds on glottal flow and vocal folds vibration during phonation,” Ann. Biomed. Eng. 37(3), 625–642. 10.1007/s10439-008-9630-9 [DOI] [PMC free article] [PubMed] [Google Scholar]
- Zheng, X., Mittal, R., and Bielamowicz, S. (2011a). “A computational study of asymmetric glottal jet deflection during phonation,” J. Acoust. Soc. Am., 129(4), 2133–2143. 10.1121/1.3544490 [DOI] [PMC free article] [PubMed] [Google Scholar]
- Zheng, X., Mittal, R., Xue, Q., and Bielamowicz, S. (2011b). “Direct-numerical simulation of the glottal jet and vocal-fold dynamics in a three-dimensional laryngeal model,” J. Acoust. Soc. Am. 130(1), 404–415. 10.1121/1.3592216 [DOI] [PMC free article] [PubMed] [Google Scholar]
- Zheng, X., Xue, Q., Mittal, R., and Bielamowicz, S. (2010). “A coupled sharp-interface immersed-boundary-finite-element method for flow-structure interaction with application to human phonation,” J. Biomech. Eng. 132(11), 111003. 10.1115/1.4002587 [DOI] [PMC free article] [PubMed] [Google Scholar]