

Abstract
Vibration characteristics of a self-oscillating two-layer vocal fold model with left-right asymmetry in body-layer stiffness were experimentally and numerically investigated. Two regimes of distinct vibratory pattern were identified as a function of left-right stiffness mismatch. In the first regime with extremely large left-right stiffness mismatch, phonation onset resulted from an eigenmode synchronization process that involved only eigenmodes of the soft fold. Vocal fold vibration in this regime was dominated by a large-amplitude vibration of the soft fold, and phonation frequency was determined by the properties of the soft fold alone. The stiff fold was only enslaved to vibrate at a much reduced amplitude. In the second regime with small left-right stiffness mismatch, eigenmodes of both folds actively participated in the eigenmode synchronization process. The two folds vibrated with comparable amplitude, but the stiff fold consistently led the soft fold in phase for all conditions. A qualitatively good agreement was obtained between experiment and simulation, although the simulations generally underestimated phonation threshold pressure and onset frequency. The clinical implications of the results of this study are also discussed.
INTRODUCTION
In human phonation, the stiffness or tension of the vocal fold structure is controlled through activation of laryngeal muscles. When such control of stiffness is lost or weakened in pathological conditions such as unilateral paralysis or paresis, left-right asymmetry in vocal fold stiffness occurs and often leads to asymmetry in vibration amplitude and phase between the two vocal folds. Such left-right difference in vibration between the two folds can be directly observed and measured in humans and thus is considered to be of clinical importance. However, the exact relationship between the left-right asymmetry in vibration amplitude and phase and the underlying left-right stiffness asymmetry still remains unclear. Clinically, an improved understanding of this relationship is required before these measures of amplitude and phase asymmetry can be used to improve diagnosis and treatment of voice disorders such as unilateral vocal fold paralysis and paresis.
There have been many previous studies on vocal fold vibration in asymmetric conditions (e.g., Isshiki et al., 1977; Sercarz et al., 1992; Moore et al., 1987; Smith et al., 1992; Berke and Gerratt, 1993; Steinecke and Herzel, 1995; Xue et al., 2010). While many studies (e.g., Ishizaka and Isshiki, 1976; Isshiki et al., 1977; Sercarz et al., 1992; Steinecke and Herzel, 1995; Pickup and Thomson, 2009; Xue et al., 2010) reported that the motion of the normal fold preceded the paralyzed fold in phase, the opposite (i.e., the soft fold leads in phase) was also reported (e.g., Moore et al., 1987). Inconsistence also exists in the literature regarding the relative difference in vibration amplitude. For example, Sercarz et al. (1992) observed a larger amplitude in the normal fold as compared to the paralyzed fold, whereas Pickup and Thomson (2009) reported a slightly larger vibration amplitude in the softer fold in their physical model experiments. Isshiki et al. (1977) showed that generally the tense (normal) fold vibrated with the same or sometimes greater amplitude than the lax (paralyzed) fold. However, Isshiki et al. (1977) also reported that the tense fold vibrated with a greatly reduced amplitude in the case of extreme tension imbalance. Such greatly reduced vibration amplitude of the tense or normal fold was also reported in the invivo canine experiment of Moore et al. (1987) and physical model experiments (Zhang, 2010b). Similar controversy also exists between different computational models of phonation. For example, in Steinecke and Herzel (1995), the normal fold always exhibited a smaller vibration amplitude than the soft fold. This contrasts with Xue et al. (2010) in which the normal fold exhibited a greater amplitude than that of the soft fold at certain conditions.
Although such controversy could be due to the different models used in these studies and limitations of measurement instruments (e.g., earlier studies often used stroboscopy, which may not be appropriate for imaging non-modal phonation), it is also possible that they arise because of the limited parameter range investigated in these previous studies. In this study, the phonatory characteristics of an asymmetric two-layer physical vocal fold model were investigated by systematically varying the left-right stiffness mismatch in a large range while other vocal fold properties were kept constant. As in Zhang (2010b), for each stiffness condition, both aerodynamic and acoustic data were recorded, from which phonation threshold pressure and frequency were measured. High-speed images of the vocal fold vibration from a superior view were recorded from which the phase and amplitude differences between the two folds were measured. It was hypothesized that investigation of the phonatory process in a large range of stiffness mismatch would lead to a more complete and systematic understanding of vocal fold vibration in asymmetric conditions and thus provide a framework to better interpret the contradictory results in previous studies.
To further understand the influence of stiffness mismatch on the underlying physical mechanisms of phonation, the linear stability model developed in our previous studies (Zhang et al., 2007; Zhang, 2009) was extended to asymmetric conditions in this study. These previous studies showed that phonation onset initiates from the synchronization of two vocal fold eigenmodes by the glottal airflow. Theoretically, such synchronization can occur between either two eigenmodes of the same fold (same-fold coupling) or eigenmodes originated from different folds (cross-fold coupling). For conditions of left-right symmetry, there is no difference of physical importance between these two types of eigenmode coupling. However, in conditions of left-right asymmetry, these two coupling types may interact and lead to different synchronization patterns, thus producing different asymmetric vibration patterns. Because the synchronization critically determines the resulting vibration pattern, an improved understanding of how left-right asymmetry affect the synchronization pattern will likely provide new insights into the relative phase and amplitude difference between the two folds in asymmetric conditions.
Although stiffness mismatch in humans may occur in either the body layer or the cover layer, this study focused on the stiffness mismatch in the body layer. Clinically, this corresponds to the condition of unilateral paralysis or paresis in the recurrent laryngeal nerve, which is one of the most commonly observed voice disorders in the clinic.
In the following, the experimental setup and the numerical model are described in Secs. 2, 3, respectively. The experimental results are then presented in Sec. 4A. In Sec. 4B, the predictions from the numerical model are compared to the experiments, and the influence of stiffness mismatch on the eigenmode synchronization pattern is then discussed.
EXPERIMENTAL SETUP AND METHODS
The experimental setup is similar to that used in previous studies (Zhang et al., 2006; Zhang, 2010b; Mendelsohn and Zhang, 2011). More details of the setup can be found in these previous studies. As shown in Fig. 1a, the setup consisted of an expansion chamber (with a rectangular cross-section of the dimension 23.5 × 25.4 cm and 50.8-cm long) simulating the lungs, an 11-cm-long straight circular PVC tube (inner diameter of 2.54 cm) simulating the tracheal tube, and a self-oscillating model of the vocal folds. The expansion chamber was connected upstream to a pressurized airflow supply through a 15.2-m-long rubber hose. No vocal tract was used in this study to avoid possible source-tract interaction.
Figure 1.

Sketch of (a) the experimental setup and (b) the two-layer physical model.
The two-layer physical models used in this study had a uniform cross-sectional geometry along the anterior-posterior direction. The cross-sectional geometry was defined in the same way as that used in Zhang (2009, 2010a). For the data presented in the following text, all vocal fold models had identical geometry with a medial surface thickness (dimension in the flow direction) of 2 mm, a lateral surface thickness of 9 mm, a body-layer depth (dimension in the medial-lateral direction) of 5 mm, and a cover-layer depth of 2.5 mm [Fig. 1b]. The vocal fold models were made by mixing a two-component liquid polymer solution (Ecoflex 0030, Smooth On, Inc.) with a silicone thinner solution with different composition ratios resulting in different model stiffness. A series of two-layer isotropic physical models were constructed with identical cover-layer Young’s modulus of approximately 3.25 kPa but with body-layer Young’s modulus varying between 3.25 and 73.16 kPa. For each stiffness condition, two identical physical models were constructed for use in the symmetric conditions as described below.
Similar to Zhang (2010b), the phonatory characteristics of individual models were first studied in a symmetric configuration, i.e., pairing two models of identical geometrical and stiffness properties. Left-right asymmetric vocal fold configurations were then investigated by pairing two models of different body-layer stiffness and comparing its vibration characteristics to those in the two symmetric conditions of the individual component vocal fold models.
For each physical model configuration, the flow rate was increased in discrete increments from zero to a value above onset (or a very high flow rate if no vibration was observed). At each step, after a delay of about 1–2 s after the flow rate change, the mean subglottal pressure (measured at 2 cm from the entrance of the glottis), mean flow rate, acoustic pressure inside the tracheal tube (2 cm from the entrance of the glottis), and outside acoustic pressure (about 20 cm downstream and about 30° off axis) were measured for a 1-s period. These data were recorded at a sampling rate of 50 kHz.
For each model configuration, a superior view of the vibrating vocal folds was recorded at three flow conditions (no flow, slightly above onset, and above onset) using a high-speed digital camera (Fastcam-Ultima APX, Photron USA) at a frame rate of 3000 fps and an image resolution of 512 × 1024 pixels. A spatiotemporal plot (also known as kymogram) was generated for each recording for a medial-lateral line located in the middle of the anterior-posterior direction, from which the left-right phase difference and vibration amplitude ratio were measured at the superior tip of the medial surface.
NUMERICAL MODEL
The numerical vocal fold model and the linear stability analysis were similar to those in previous studies (Zhang et al., 2007; Zhang, 2009). The reader is referred to these two previous studies for details of the model and equation derivation. In the following, we focus on the model modifications made to relax the assumption of left-right symmetry to a full left-right vocal fold model.
Figure 2 shows the two-dimensional vocal fold model used in this study. A body-cover idealization as suggested by Hirano (1974) was used with each layer modeled as an isotropic plane-strain elastic layer. The vocal fold geometry was defined similarly as in previous studies (Zhang, 2009, 2010a; Fig. 2) and had the same cross-sectional geometry as the physical models used in the experiments of this study. The material control parameter for each vocal fold included the body and cover layer Young’s modulus Eb and Ec, the density, and the Poisson’s ratio.
Figure 2.

The two-dimensional numerical model of the vocal fold.
For simplicity and to focus on the influence of left-right stiffness asymmetry, the two vocal folds were assumed to have identical geometry and the static deformation of the vocal folds under subglottal pressure was neglected. In other words, the vocal fold geometry was assumed to remain unchanged as the subglottal pressure was increased. The influence of geometrical asymmetry and static deformation will be addressed in a different study.
As in previous studies (Zhang et al., 2007; Zhang, 2009), no vocal tract was included in this study to avoid possible source-tract coupling. A constant flow rate Q was imposed at the glottal entrance. A potential-flow description was used for the glottal flow up to the point of flow separation beyond which the pressure was set to the atmospheric pressure. The flow was assumed to separate from the glottal wall at a point downstream of the minimum glottal constriction at which the glottal width was 1.2 times the minimum glottal width. Note that the flow separation model of this study gives only a rough estimation (Sidlof et al., 2011) of the complex flow separation pattern in asymmetric vocal fold vibration (see e.g., Zheng et al., 2011). It was chosen in this study because of its simplicity and low computational costs, which makes it possible to perform the parametric study as reported in the following text. The sensitivity of phonation onset to variations of the flow separation location was investigated in a previous study (Zhang, 2008).
The x-component (medial-lateral direction) and z-component (inferior-superior direction) of vocal fold displacement [ξ, η] were approximated as linear superposition of the in vacuo eigenmodes of the vocal folds:
| (1) |
where φi,x and φi,z are the x-component and z-component of the ith in vacuo eigenmode of the vocal folds, and N is the number of eigenmodes included in the numerical simulation. In this study, N = 20 was used. The subscripts l and r denote the left and right vocal fold, respectively. The coefficients in Eq. 1 form the generalized coordinate vector q:
| (2) |
In contrast to that in a symmetric vocal fold condition as considered in previous studies (Zhang et al., 2007; Zhang, 2009), the fluctuating glottal width h in the full vocal fold model induced by vocal fold vibration was the difference in the medial-lateral displacement between the two vocal folds:
| (3) |
Phonation onset was investigated by examining how the eigenmodes and eigenvalues of the coupled airflow-vocal fold system vary as the subglottal pressure is increased from zero. Phonation onset occurs when the growth rate (real part of the eigenvalue) of one of the eigenvalues first becomes positive, indicating the coupled system becomes linearly unstable. The governing equations of the eigenvalue problem were derived from Lagrange’s equations (Zhang et al., 2007) as
| (4) |
where M, C, and K are the combined mass, damping, and stiffness matrices of the two-vocal fold structure, and Q is the generalized force due to the fluctuating intraglottal pressure. The mass and stiffness matrices M and K are defined as
| (5) |
where Lagrangian L = V−U. The associated kinetic energy V and potential energy U of the vocal fold structure are defined similarly to that in Zhang et al. (2007) except that in this study they included contributions from both two folds:
| (6) |
where ρvf is the vocal fold density, [εx, εz, γxz] and [τx, τz, τxz] are the vocal fold strain and stress (see definitions in Zhang et al., 2007), and Sl and Sr are the two-dimensional volume of the left and right vocal fold, respectively. Similarly, the corresponding generalized force Q has contributions from both two vocal folds:
| (7) |
where lFSI,l and lFSI,r denote the fluid-structure interface of the left and right vocal folds with the normal vector n pointing outward from the vocal fold volume, and p is the fluctuating flow pressure on the fluid-structure interface which is obtained by solving the linearized Bernoulli’s equation and the one-dimensional continuity equation (Zhang et al., 2007).
In this study, a constant loss factor σ was used, which relates the mass and damping matrices as follows:
| (8) |
where ω is the angular frequency.
Equation 4 was solved as an eigenvalue problem by assuming a solution form of q = q0est, where s is the eigenvalue and q0 is the corresponding eigenmode. The subglottal pressure was gradually increased until phonation onset was detected. The phonation threshold pressure would then be the subglottal pressure at onset, and the phonation onset frequency would then be given by the imaginary part of the corresponding eigenvalue. The vibratory pattern at onset can be calculated from the corresponding eigenvector.
RESULTS
Experiments
Two series of experiments were conducted in this study. In the first series, a baseline model with a body-layer stiffness of 73.16 kPa was mounted on the right hand side and paired with different vocal fold models of lower body-layer stiffness mounted on the left hand side. In the second series, a baseline model with a body-layer stiffness of 3.25 kPa was mounted on the right hand side and paired with vocal fold models of higher body-layer stiffness.
Figure 3 shows the results obtained from the first series of experiments with a baseline body-layer stiffness of 73.16 kPa. For comparison with the symmetric conditions, Fig. 3 also showed the phonation threshold pressure and onset frequency for the two corresponding symmetric conditions. Note that the asymmetric-condition experiments were performed at a different time (about 1–2 months after) from the symmetric-condition experiments; this caused an upward shift of approximately 0.5 kPa in phonation threshold pressure and a drift of approximately 10% in phonation onset frequency for the same physical model in a similar mounting configuration.
Figure 3.

Experimentally measured (square symbols) phonation threshold pressure (a), phonation onset frequency (b), left-right phase difference (c), and left-right vibration amplitude ratio (d) as a function of the body-layer stiffness of the left vocal foldmodel. For all conditions, Eb,right = 73.16 kPa. For comparison, the corresponding phonation threshold pressure and onset frequency of the two individual component vocal fold models in symmetric conditions (○: right fold; △: left fold) were also shown in subplots (a) and (b).
Two regimes can be identified in Fig. 3. The first regime corresponds to the conditions of large left-right stiffness mismatch (Eb,right/Eb,left > 5.1, or Eb,left < 14 kPa). In this regime, the soft fold was strongly excited with a very large vibration amplitude [Fig. 4a], whereas the stiff fold barely moved. There was a phase difference of approximately 180° between the two folds in the medial-lateral motion [Fig. 3c]. Due to the dominance of the soft fold, phonation onset frequency in this regime closely followed the phonation onset frequency of the soft (left) vocal fold model in symmetric conditions (despite the approximate 10% drift between symmetric- and asymmetric-condition experiments). Phonation threshold pressure in this regime was slightly higher than that of the soft vocal fold model in symmetric conditions (taking into consideration of the 0.5 kPa upward drift in asymmetric condition data) but lower than that of the stiff fold in symmetric conditions.
Figure 4.

Superior views of the vocal fold model during one oscillating cycle in the two regimes of large (a) and small (b) left-right stiffness mismatch.
As the left-right stiffness mismatch was reduced (Eb,right/Eb,left < 5.1), a second regime can be identified in Fig. 3. The start of the second regime was marked by a sudden increase in phonation onset frequency as the stiffness of the soft (left) vocal fold model was gradually increased. Unlike the regime of large stiffness mismatch, phonation onset frequency in this regime was in between the phonation onset frequencies of two corresponding symmetric conditions, indicating both folds were actively involved in initiating phonation. Indeed, the stiff vocal fold model in this regime was more strongly excited [Fig. 4b], and the two folds had comparable vibration amplitude [Fig. 3d]. The motion of the soft fold (left fold) consistently lagged behind that of the stiff fold in phase. The phase difference was much smaller than 180° and decreased with decreasing stiffness mismatch.
Figure 5 shows the data obtained in the second series of experiments in which the baseline (right) vocal fold model had a body-layer stiffness of 3.25 kPa. Similar to that in the first series, two regimes can be identified. One regime corresponds to conditions of small left-right stiffness mismatch (Eb,left/Eb,right < 4.5 or Eb,left < 14 kPa). In this regime, although phonation onset frequency increased with increasing Eb,left, both vocal folds were strongly excited with a left-right amplitude ratio around one. Except for the two conditions of the smallest stiffness mismatch (Eb,left/Eb,right = 1 and 1.46), the stiff vocal fold model led in phase and the phase difference increased with increasing stiffness mismatch. The other regime corresponds to conditions of large left-right stiffness mismatch (Eb,left/Eb,right > 4.5). In this regime, similar to the first series of experiments, the soft vocal fold model was strongly excited with a much larger vibration amplitude than that of the stiff model, which barely moved, and the phase difference between the soft and the stiff models was approximately 180° (note that a phase difference of 180° is the same as −180°). Due to this dominant role of the soft fold, the phonation onset frequency in this regime stayed close to that of the soft vocal fold model in symmetric conditions and did not vary much with increasing stiffness of the other fold.
Figure 5.

Experimentally measured (square symbols) phonation threshold pressure (a), phonation onset frequency (b), left-right phase difference (c), and left-right vibration amplitude ratio (d) as a function of the body-layer stiffness of the left vocal fold model. For all conditions, Eb,right = 3.25 kPa. For comparison, the corresponding phonation threshold pressure and onset frequency of the two individual component vocal fold models in symmetric conditions (○: right fold; △: left fold) were also shown in subplots (a) and (b). Note that a phase difference of 180° is the same as −180°.
For both series of experiments, the stiff fold in the regime of large stiffness mismatch exhibited an extremely small vibration amplitude [Fig. 4a] except for one condition in the second series of experiments (Eb,right = 3.25 kPa, Eb,left = 21.4 kPa). Under this condition [Fig. 6a], although the soft fold still dominated in vibration amplitude, the stiff fold (left fold) was more strongly excited than in other conditions in the regime of large stiffness mismatch [Fig. 6b]. This strong excitation of the stiff fold was most likely due to that the phonation onset frequencies of the corresponding left fold and right fold in symmetric conditions had a ratio of 2:1 [Fig. 5b]. In fact, the stiff fold (left fold) was observed to vibrate at its own natural frequency [Fig. 6a]. Acoustically, this led to a second harmonic that was more dominant than the first harmonic in the resulting sound spectrum. Similar excitation of the stiff fold to vibrate at its own natural frequency was also observed in Zhang (2010b) but not as strongly as observed in this study. Such subharmonic synchronization was also observed in the simulation of Xue et al. (2010) and discussed in detail in Steinecke and Herzel (1995).
Figure 6.

Time history of a medial-lateral slice (taken from the middle along the anterior-posterior direction) of the asymmetric vocal fold model from a superior view. (a). Eb,left = 21.4 kPa; (b). Eb,left = 36.2 kPa. For both conditions, Eb,right = 3.25 kPa. For the condition in (a), because the phonation onset frequencies of the left fold and right fold in symmetric conditions had a ratio of 2:1 [Fig. 5b], the stiff fold (left fold) was excited to vibrate at its own natural frequency and had a much larger vibration amplitude than otherwise observed for the stiff fold in the regime of large stiffness mismatch (b).
Numerical simulations
To compare with the experimental results, numerical simulations as described in Sec. 3 were performed using identical cross-sectional geometry to those in the experiments. Because no efforts were made to measure vocal fold damping in the experiments, a constant loss factor of 0.4 as in previous studies was used in the simulations of this study. Similarly, a Poisson’s ratio of 0.47 was used as the vocal fold is generally considered nearly incompressible. Although the glottis was closed at rest in all experimental conditions, the vocal fold models were pushed open when airflow was applied during the experiments so that the prephonatory glottal opening was nonzero and varied with the body-layer stiffness. Our simulations showed that different values of the glottal half-width produced no qualitative changes in the general trends of the results. Therefore for the results presented in the following text, a constant glottal half-width of 0.27 mm as in our previous studies was used for all conditions.
Similar to the experiments, two series of simulations were performed. For the first series of simulations, the right vocal fold model had a constant body-layer stiffness of 73.16 kPa, and the body-layer stiffness of the left vocal fold model was gradually reduced from 73.16 kPa. In the second series, the right vocal fold model had a constant body-layer stiffness of 3.25 kPa, whereas the body-layer stiffness of the left vocal fold was graduated increased from 3.15 kPa. The results of the two series are shown in Figs. 78, respectively.
Figure 7.

Numerically predicted (square symbols) phonation threshold pressure (a), phonation onset frequency (b), left-right phase difference in medial-lateral motion (c), and left-right vibration amplitude ratio in medial-lateral motion (d) as a function of the body-layer stiffness of the left vocal fold model. For all conditions, Eb,right = 73.16 kPa. For comparison, the corresponding phonation threshold pressure and onset frequency of the two individual component vocal fold models in symmetric conditions (○: right fold; △: left fold) were also shown in subplots (a) and (b).
Figure 8.

Numerically predicted (square symbols) phonation threshold pressure (a), phonation onset frequency (b), left-right phase difference in medial-lateral motion (c), and left-right vibration amplitude ratio in medial-lateral motion (d) as a function of the body-layer stiffness of the left vocal fold model. For all conditions, Eb,right = 3.25 kPa. For comparison, the corresponding phonation threshold pressure and onset frequency of the two individual component vocal fold models in symmetric conditions (○: right fold; △: left fold) were also shown in subplots (a) and (b).
Compared to the experimental data (Figs. 35), although the predicted phonation onset frequency and phonation threshold pressure were generally lower, the simulation successfully reproduced the general trends of the experimental data. Specifically, the simulation predicted regimes of distinct vibratory pattern as a function of left-right stiffness mismatch. In the regime of large stiffness mismatch, the simulation predicted a vibration pattern dominated by the soft fold: phonation onset frequency was determined by the properties of the soft fold alone (close to that of the soft fold in a symmetric condition), and the soft fold had a much larger amplitude than the stiff fold, which barely vibrated. Similar to the experiments, there was a large phase difference of approximately 180° between the motion of two folds (note that a phase difference of 180° is the same as −180°). In the regime of small stiffness mismatch, both folds were excited with comparable vibration amplitude (except in the transition region between the two regimes in Fig. 8), and the soft fold lagging behind the stiff fold in phase, similar to the experimental observations in this regime. Similar trends as in the experiment were also observed in the simulation regarding the phonation onset frequency and phonation threshold pressure as a function of left-right stiffness mismatch in both regimes. In Fig. 7, the simulation also predicted a third regime for a narrow range of intermediate values of stiffness mismatch in which the vibration was dominated by the stiff fold with a phonation frequency close to that of the stiff fold in a symmetric condition. This regime was not observed in the experiment.
To further understand the eigenmode synchronization pattern at different conditions of stiffness mismatch, Figs. 9a, 9b show the correlation between the vibratory pattern at onset and the first four in vacuo eigenmodes of individual component vocal folds for the first series of simulations. Figure 9c shows the frequencies of the first four in vacuo eigenmodes of each of the two folds together with the predicted phonation onset frequencies. As the correlation measures the degree of similarity, a high correlation indicates that the corresponding eigenmode is strongly excited at phonation onset and actively involved in the eigenmode synchronization process (Zhang et al., 2007). Thus the correlation analysis allows us to at least identify the eigenmodes that are actively synchronized and thus responsible for the initiation of phonation.
Figure 9.
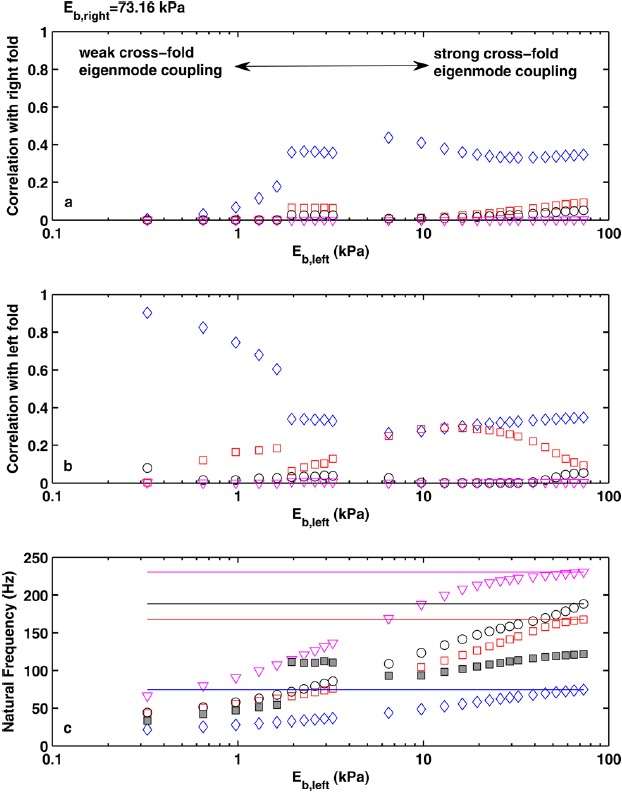
(Color online) Correlation between the vocal fold vibration pattern at onset and the first four in vacuo eigenmodes (◇: first; ◻: second; ○: third; ▽: fourth in vacuo eigenmode) of the right (a) and left (b) vocal fold model as a function of the body-layer stiffness of the left vocal fold model. For all conditions, Eb,right = 73.16 kPa. (c), the frequencies of the first four in vacuo eigenmodes of the left (open symbols) and right (lines) vocal folds as a function of the body-layer stiffness of the left vocal fold model (note that the in vacuo eigenmodes are numbered in the order of ascending frequencies). The solid square symbols denote the corresponding phonation onset frequency in asymmetric conditions.
Figure 9 shows that for the symmetric condition, phonation onset involved strong excitation of the first two eigenmodes (diamond and square symbols), indicating synchronization of the first and second eigenmodes. For asymmetric conditions, Fig. 9 further shows that the two regimes of large and small stiffness mismatch corresponded to regimes of weak and strong cross-fold eigenmode coupling, respectively. For conditions of large stiffness mismatch, the eigenfrequencies of the stiff vocal folds were much higher than those of the soft vocal folds so that there was not much cross-fold eigenmode synchronization. Under this condition of weak cross-fold synchronization, phonation onset was determined by the fold with a lower symmetric-condition phonation threshold pressure, which was the soft fold in this study. As a result, phonation onset occurred as the first and second eigenmodes of the soft fold were synchronized [Fig. 9b], whereas no eigenmodes of the stiff fold was noticeably excited [Fig. 9a]. As the stiffness mismatch was reduced, the first two eigenfrequencies of the soft vocal fold model gradually approached the first eigenfrequency of the stiff vocal fold [Fig. 9c] and cross-fold eigenmode synchronization became possible. Consequently, the first eigenmode of the stiff vocal fold was gradually excited. As the stiffness mismatch was further reduced, cross-fold eigenmode coupling strengthened, and the degree of excitation of the first eigenmode of the stiff vocal fold model continued to increase and, beyond a certain critical point, became the most dominant eigenmode as the system transitioned to a second regime. This transition was marked by a sudden change in phonation frequency. For this particular case in Fig. 9, the transition from the first to the second regime was also accompanied by strong excitation of the second eigenmode of the stiff vocal fold. This eigenmode was subsequently suppressed as the stiffness mismatch continued to decrease and as the system transitioned to a third regime.
Figure 10 reveals similar changes in the eigenmode synchronization pattern in the second series of simulations except that only two regimes are observed in this case. For large stiffness mismatch, large spacing between the eigenfrequencies of the two vocal folds prevented strong cross-fold eigenmode synchronization, and phonation was dominated by the soft fold that had a lower symmetric-condition phonation threshold pressure. Cross-fold eigenmode coupling gradually increased with reduced stiffness mismatch, and the first eigenmode of the stiff fold started to participate in the eigenmode synchronization process. The continuously increased role of the first eigenmode of the stiff fold eventually led to a qualitative change as the vocal fold vibration pattern changed from one dominated by the soft fold to one that involved both folds with comparable vibration amplitude.
Figure 10.

(Color online) Correlation between the vocal fold vibration pattern at onset and the first four in vacuo eigenmodes (◇: first; ◻: second; ○: third; ▽: fourth in vacuo eigenmode) of the right (baseline) vocal fold (a) and the left vocal fold model (b) as a function of the body-layer stiffness of the left vocal fold model. For all conditions, Eb,right = 3.25 kPa. (c), the frequencies of the first four in vacuo eigenmodes of the left (symbols) and right (lines) vocal folds as a function of the body-layer stiffness of the left vocal fold model (note that the in vacuo eigenmodes are numbered in the order of ascending frequencies). The solid square symbols denote the corresponding phonation onset frequency in asymmetric conditions.
DISCUSSION
The results of this study revealed two regimes of distinct vibratory characteristics as a function of left-right stiffness mismatch. For large stiffness mismatch, cross-fold interaction was weak, and vibration was dominated by the soft fold and the stiff fold was enslaved to vibrate at a much smaller vibration amplitude and an opposite phase. Phonation frequency in this regime was close to that of the soft fold in a symmetric condition and remained almost unaffected by the stiffness of the other fold. For small stiffness mismatch, both folds were strongly excited with relatively comparable amplitude and phonation frequency depended on the stiffness of both folds. The stiff fold in this regime consistently led the soft fold in phase and the phase difference decreased with decreasing stiffness mismatch.
The numerical simulations further showed that the two regimes of small and large stiffness mismatch corresponded to regimes of strong and weak cross-fold eigenmode synchronization, respectively. In the regime of weak cross-fold eigenmode coupling, eigenmode synchronization occurred between two eigenmodes of the soft fold only, and the stiff fold was not active in the eigenmode synchronization process. Because the stiff fold was simply driven by the motion of the soft fold through aerodynamic coupling, its motion was about 180° lagging behind the soft fold. In the regime of strong cross-fold eigenmode coupling, eigenmodes of both folds were actively involved in the eigenmode synchronization process, and the first eigenmode of the stiff fold became the most excited eigenmode. Previous theoretical studies (Zhang, 2010a, 2011) showed that the phase difference between the two synchronizing eigenmodes need to satisfy certain condition to establish a positive net energy flow into the vocal folds (Table I in Zhang, 2011). Such phase requirement may be responsible for the leading phase of the stiff fold over the soft fold in this regime as observed in both the experiments and simulations of this study.
The controversy in the literature regarding the left-right phase and amplitude difference may be explained based on the existence of two primary vibratory regimes as revealed in this study. Studies that reported a leading phase of the stiff fold over the soft fold (e.g., Isshiki et al., 1977; Sercarz et al. 1992; Steinecke and Herzel, 1995) were likely to fall in the regime of relatively small stiffness mismatch. As shown in this study, in this regime, both folds were actively excited, and either fold can exhibit a relatively larger vibration amplitude, which also explains the contradictory observations regarding the left-right vibration amplitude difference in those studies. On the other hand, studies that reported a large phase difference (e.g., Moore et al., 1987; Zhang, 2010b) were likely to be conducted in a condition of large left-right stiffness mismatch. Indeed, both studies also reported a greatly reduced vibration amplitude in the stiff fold; this is consistent with the observation of this study in the regime of large stiffness mismatch.
The results of this study suggest that improved diagnosis of pathological conditions such as unilateral vocal fold paresis may be achieved by considering both phase and amplitude measures of left-right asymmetry in vocal fold vibration. A vibration pattern dominated by one fold in amplitude and with a large left-right phase difference (approximately 180°) indicates large stiffness mismatch, in which case the fold with the larger vibration amplitude is likely to be the fold weakened (i.e., lower stiffness). However, a vibration pattern with a not-so-large difference in vibration amplitude between the two folds indicates small left-right stiffness mismatch, and the fold with a lagging phase in motion is likely the weakened fold.
It is worth noting that although the physical models used in this study had a two-layer structure, each layer had isotropic material properties. This is different from human vocal folds, which are at least transversely-isotropic with the longitudinal stiffness or tension regulated through contraction of the TA and CT muscles. Also, the physical models of this study had a uniform cross-section in the anterior-posterior direction, whereas in humans, the cross-sectional geometry varies along the anterior-posterior direction. Third, in the extreme case of complete unilateral vocal fold paralysis, a relatively large glottal opening is often present due to the inability of the vocal folds to be adducted toward midline. Despite these differences, the general observations of this study should still hold true for human phonation because vibration of the physical models of this study and human vocal folds is governed by the same fluid-structure interaction principles. For example, it is expected that the two regimes of distinct vibratory pattern exist even for conditions of large glottal opening, although in that case the regime of strong cross-fold eigenmode coupling may exist only for a much reduced range of small stiffness mismatch because the fluid-structure coupling is significantly reduced at large glottal openings.
Although the numerical model was able to qualitatively reproduce the experimental observation, it consistently underestimated both phonation threshold pressure and phonation onset frequency. This underestimation is likely due to simplifications in both the structural and flow models. The two-dimensional plane-strain vocal fold model neglects the constraining effect of the anterior and posterior boundary conditions and thus underestimates the eigenfrequencies of the vocal fold structure (Cook and Mongeau, 2007), making it easier to synchronize relevant eigenmodes (Zhang, 2010a). The use of the one-dimensional flow model may have overestimated the flow reaction to vocal fold motion, especially at the anterior and posterior ends, and thus the fluid-structural coupling strength. Indeed, the regime of strong cross-fold eigenmode coupling extended over a larger range of stiffness mismatch in the simulation than that observed in the experiment, indicating a stronger fluid-structural coupling strength in the simulation. Overall, this reduced frequency spacing and the overestimated fluid-structure coupling strength combined to produce an overly underestimated phonation threshold pressure in the simulations. Work is currently in progress to improve the linear stability model for a better quantitative agreement with experiments.
CONCLUSIONS
The influence of left-right asymmetry in body-layer stiffness on phonation characteristics was investigated using experimental and numerical methods. The results revealed two regimes of distinct vibratory characteristics. The first regime corresponded to conditions of large left-right stiffness mismatch for which vocal fold vibration was dominated by the soft fold and had a phonation frequency determined by properties of the soft fold alone. The stiff fold was enslaved to vibrate at the same frequency but with a much smaller vibration amplitude. The second regime occurred for conditions of small left-right stiffness mismatch. In this regime, both folds were excited with comparable magnitude but the stiff fold consistently led the soft fold in phase. Comparison between experiments and numerical predictions shows that the linear stability model was able to qualitatively reproduce the experimental observation but consistently underestimated the phonation threshold pressure. This study shows that measures of left-right difference in vibration amplitude and phase can be used to improve diagnosis of pathological conditions such as unilateral vocal fold paresis.
ACKNOWLEDGMENTS
This study was supported by Grant No. R01 DC011299 from the National Institute on Deafness and Other Communication Disorders, the National Institutes of Health.
References
- Berke, G. S., and Gerratt, B. R. (1993). “ Laryngeal biomechanics: An overview of mucosal wave mechanics,” J. Voice 7, 123–128. 10.1016/S0892-1997(05)80341-8 [DOI] [PubMed] [Google Scholar]
- Cook, D., and Mongeau, L. (2007). “ Sensitivity of a continuum vocal fold model to geometric parameters, constraints, and boundary conditions,” J. Acoust. Soc. Am. 121, 2247–2253. 10.1121/1.2536709 [DOI] [PubMed] [Google Scholar]
- Hirano, M. (1974). “ Morphological structure of the vocal cord as a vibrator and its variations,” Folia Phoniatr. 26, 89–94. 10.1159/000263771 [DOI] [PubMed] [Google Scholar]
- Ishizaka, K., and Isshiki, N. (1976). “ Computer simulation of pathological vocal-cord vibration,” J. Acoust. Soc. Am. 60, 1193–1198. 10.1121/1.381221 [DOI] [PubMed] [Google Scholar]
- Isshiki, N., Tanabe, M., Ishizaka, K., and Broad, D. (1977). “ Clinical significance of asymmetrical vocal cord tension,” Ann. Otol. Rhinol. Laryngol. 86, 58–66. [DOI] [PubMed] [Google Scholar]
- Mendelsohn, A., and Zhang, Z. (2011). “ Phonation threshold pressure and onset frequency in a two-layer physical model of the vocal folds,” J. Acoust. Soc. Am. 130, 2961–2968. 10.1121/1.3644913 [DOI] [PMC free article] [PubMed] [Google Scholar]
- Moore, D. M., Berke, G. S., Hanson, D. G., and Ward, P. H. (1987). “ Videostroboscopy of the canine larynx: The effects of asymmetric laryngeal tension,” Laryngoscope 97, 543–553. [DOI] [PubMed] [Google Scholar]
- Pickup, B. A., and Thomson, S. L. (2009). “ Influence of asymmetric stiffness on the structural and aerodynamic response of synthetic vocal fold models,” J. Biomech. 42, 2219–2225. 10.1016/j.jbiomech.2009.06.039 [DOI] [PMC free article] [PubMed] [Google Scholar]
- Sercarz, J. A., Berke, G. S., Ye, M., Gerratt, B. R., and Natividad, M. (1992). “ Videostroboscopy of human vocal fold paralysis,” Ann. Otol. Rhinol. Laryngol. 101, 567–577. [DOI] [PubMed] [Google Scholar]
- Sidlof, P., Doare, O., Cadot, O., and Chaigne, A. (2011). “ Measurement of flow separation in a human vocal folds model,” Exp. Fluids 51, 123–136. 10.1007/s00348-010-1031-9 [DOI] [Google Scholar]
- Smith, M. E., Berke, G. S., Gerratt, B. R., and Kreiman, J. (1992). “ Laryngeal paralyses: Theoretical considerations and effects on laryngeal vibration,” J. Speech Hear. Res. 35, 545–554. [PubMed] [Google Scholar]
- Steinecke, I., and Herzel, H. (1995). “ Bifurcations in an asymmetric vocal fold model,” J. Acoust. Soc. Am. 97, 1874–1884. 10.1121/1.412061 [DOI] [PubMed] [Google Scholar]
- Xue, Q., Mittal, R., Zheng, X., and Bielamowicz, S. (2010). “ A computational study of the effect of vocal-fold asymmetry on phonation,” J. Acoust. Soc. Am. 128, 818–827. 10.1121/1.3458839 [DOI] [PMC free article] [PubMed] [Google Scholar]
- Zhang, Z. (2008). “ Influence of flow separation location on phonation onset,” J. Acoust. Soc. Am. 124, 1689–1694. 10.1121/1.2957938 [DOI] [PMC free article] [PubMed] [Google Scholar]
- Zhang, Z. (2009). “ Characteristics of phonation onset in a two-layer vocal fold model,” J. Acoust. Soc. Am. 125, 1091–1102. 10.1121/1.3050285 [DOI] [PMC free article] [PubMed] [Google Scholar]
- Zhang, Z. (2010a). “ Dependence of phonation threshold pressure and frequency on vocal fold geometry and biomechanics,” J. Acoust. Soc. Am. 127, 2554–2562. 10.1121/1.3308410 [DOI] [PMC free article] [PubMed] [Google Scholar]
- Zhang, Z. (2010b). “ Vibration in a self-oscillating vocal fold model with left-right asymmetry in body-layer stiffness,” J. Acoust. Soc. Am. 128(5 ), EL279–EL285. [DOI] [PMC free article] [PubMed] [Google Scholar]
- Zhang, Z. (2011). “ On the difference between negative damping and eigenmode synchronization as two phonation onset mechanisms,” J. Acoust. Soc. Am. 129, 2163–2167. 10.1121/1.3543989 [DOI] [PMC free article] [PubMed] [Google Scholar]
- Zhang, Z., Neubauer, J., and Berry, D. A. (2006). “ The influence of subglottal acoustics on laboratory models of phonation,” J. Acoust. Soc. Am. 120(3 ), 1558–1569. 10.1121/1.2225682 [DOI] [PubMed] [Google Scholar]
- Zhang, Z., Neubauer, J., and Berry, D. A. (2007). “ Physical mechanisms of phonation onset: A linear stability analysis of an aeroelastic continuum model of phonation,” J. Acoust. Soc. Am. 122(4 ), 2279–2295. 10.1121/1.2773949 [DOI] [PubMed] [Google Scholar]
- Zheng, X., Mittal, R., and Bielamowicz, S. (2011). “ A computational study of asymmetric glottal jet deflection during phonation,” J. Acoust. Soc. Am 129(4 ), 133–2143. [DOI] [PMC free article] [PubMed] [Google Scholar]