

Abstract
Slower and more variable reaction times to computerized tasks have been documented in children diagnosed with Attention Deficit Hyperactivity Disorder (ADHD). Recent research supports a role for attentional lapses in generating abnormally variable and slow responses. However, given the association between ADHD and impairments in motor control, we hypothesized that slower or more variable reaction times might also correlate with motor development. The aim of this case-control study was to explore the relationship between motor function, reaction speed and variability, and ADHD. After comprehensive educational and clinical assessments, motor skill development was evaluated in 35 children ages 9 to 14 (19 with ADHD) using the Physical and Neurological Examination for Subtle Signs (PANESS) test battery. Finger sequencing speed and variability were quantified with goniometers. Reaction times were measured with 20 trials each of computerized simple and choice (binary) tasks. Compared to healthy controls, children with ADHD had slower and more variable reaction times, and these findings correlated with impaired motor development (PANESS) and slow and variable finger sequencing (goniometers). Further studies of motor development in ADHD may identify factors influencing speed and variability of reaction times.
Keywords: Reaction Time Variability, Motor Development, Children, Attention Deficit Hyperactivity Disorder, Goniometer, PANES
INTRODUCTION
Multiple studies have shown that children who meet diagnostic criteria for Attention Deficit Hyperactivity Disorder (ADHD) have slower average reaction times and greater intra-individual variation over multiple trials (Epstein, Hwang, Antonini, Langberg, Altaye et al. , 2010; Hervey, Epstein, Curry, Tonev, Arnold et al. , 2006; Smith & Parent, 1984; Wahlstedt, 2009). The consistency of these results suggests that reaction times reflect in part the neurological substrate of core ADHD symptoms. In particular, longer-latency responses in children with ADHD may result from attentional lapses (Hervey et al. , 2006; Zahn, Kruesi & Rapoport, 1991).
Reaction times, the intervals between a particular external stimulus and a response, are at the most basic level an indicator of the processing speed of the nervous system. Slow reaction times can occur due to a wide variety of diseases, disorders, and acquired brain conditions that affect white matter conduction, gray matter neurotransmission, and efficiency of cognitive neural networks. These systems mature in childhood, such that reaction times shorten and become less variable as part of typical development. Concurrently, many components of motor control are also maturing in typically developing (TD) children. In children with ADHD, the development of motor control, including speed and timing, balance, and suppression of contralateral overflow movements, lags compared to TD children (Denckla & Rudel, 1978). Rating these developmental skills using the Physical and Neurological Examination for Subtle Signs (PANESS) (Denckla, 1985), distinguishes children with ADHD from TD (healthy control) children (Cole, Mostofsky, Larson, Denckla & Mahone, 2008; Schuerholz, Cutting, Mazzocco, Singer & Denckla, 1997).
We hypothesized, therefore, that the speed and variability of reaction times in ADHD children would correlate with differences in development of motor control, characterized using two methods: 1) the PANESS; and 2) goniometers placed on both dominant and non-dominant hands to quantify the rate and variability of sequential finger movements. Our rationale for this study was the theoretical construct that frontal-striatal and frontal-cerebellar circuits necessary for development of motor control parallel those circuits necessary for development of higher order behavioral control (Diamond, 2000) as well as empirical evidence that motor cortex physiology reflects ADHD behavioral severity (Gilbert, Isaacs, Augusta, Macneil & Mostofsky, 2011; Gilbert, Wang, Sallee, Ridel, Merhar et al. , 2006). Reaction times were quantified using simple and two-choice reaction time paradigms, without response inhibition demands. To minimize effects of lapses of attention, fatigue, and frustration, we evaluated a relatively small number of trials.
METHODS
Participants
Nineteen children with ADHD and 16 TD children (healthy controls) ages 8-14 years, participated in the study. Subjects were recruited from general pediatric clinics by advertisement. Only right hand dominant subjects were included, as determined by parent report and the Edinburgh Handedness Inventory (Oldfield, 1971). ADHD children taking psychostimulants were required to stop medication the day prior to testing. Subjects currently using any other psychotropic agents such as non-stimulant medications for ADHD, anti-depressants, mood stabilizers, or dopamine receptor-blocking agents were excluded. This study was approved by the Cincinnati Children’s Hospital Medical Center Institutional Review Board. The subjects in this study were recruited in conjunction with another study of motor physiology in ADHD. Recruitment methods and the rationale are described there (Gilbert et al. , 2011; Macneil, Xavier, Garvey, Gilbert, Ranta et al. , 2011) as well as briefly included here.
Diagnosis and Symptom severity rating
The diagnosis of ADHD was based on DSM-IV criteria, confirmed by a child neurologist, based on history and parent responses to the Attention Deficit Hyperactivity Disorder Rating Scale IV--Home Version (DuPaul, Power, Anastopoulos & Reid, 1998), the Conners’ Parent Rating Scale-Revised (Conners, Sitarenios, Parker & Epstein, 1998), and on results of a structured parent interview--the Diagnostic Interview for Children and Adolescents-IV (DICA-IV) (Reich, 2000). Children who screened positive for any other DSM-IV developmental or psychiatric diagnosis, other than oppositional defiant disorder, were excluded. Typically developing children had no developmental or psychiatric disorders and took no psychotropic medications. Study personnel with supervision of a licensed psychologist also administered the Wechsler Intelligence Scale for Children, Fourth Edition (WISC-IV), the Word Reading subtest of the Wechsler Individual Achievement Test, Second Edition (WIAT-II). Children were excluded for any speech/language disorder or Reading Disability, based on 1) school assessments; 2) a statistically significant discrepancy between IQ and reading test subscores; or 3) a Word Reading Subtest score below 85. The rationale for excluding children with a reading disability was literature suggesting language impairments (indexed by reading disability) may developmentally influence performance measures of inhibitory control (Pennington & Ozonoff, 1996).
Reaction times
All subjects were administered a computerized version of a mental chronometry task (Life Science Assoc., Bayport NY, USA). The simple response task (SRT) involved 2 blocks of 10 trials in which subjects pressed a key with the dominant index finger as rapidly as possible in response to the appearance of a black circle on the computer laptop screen. The choice response task involved 2 blocks of 10 trials in which subjects correctly pressed one of two keys as rapidly as possible in response to the appearance of either a red or green circle on the screen. Simple and Choice Blocks were permuted in an ABBA design (first and last are Simple). Importantly, in addition to the limited number of trials, the onset of each trial is triggered by the participant by pushing the space bar key. The response cue (circle) then appears at an interval of from 1000 to 4000 ms, randomized across trials. Individual trial times (cue to response) were recorded and mean and standard deviations (SD) were calculated. A difference score for an individual’s choice versus simple response time was calculated by subtracting mean values. The difference in choice and simple reaction times reflects the subject’s ability to distinguish between two stimuli and to choose a response (Posner, 2005). Variability for each subject was represented as the coefficient of variation (SD/mean).
Developmental Motor function
Motor function was assessed with the Physical and Neurological Examination for Subtle Signs (PANESS) (Denckla, 1985) by trained raters. The PANESS scales involve a series of standardized tasks including timed movements as well as observational data which are rated, including lateral preference, motor overflow, dysrhythmia, coordination, gait, balance, and motor persistence. Total PANESS score and selected subscale scores were used for analysis as previously done in motor physiology studies (Gilbert et al. , 2011). Compared to their peers, children with ADHD have higher PANESS scores, indicating lower levels of motor development (Cole et al. , 2008; Gilbert et al. , 2011; Macneil et al. , 2011).
Speed and variability of sequential finger movements in each hand were evaluated using a goniometer (TSD131, Biopac Systems Inc., Goleta CA, USA), as recently described (Macneil et al. , 2011). In brief, each subject completed 4 blocks of sequential finger-tapping on each hand while seated with hands supported in their laps with a firm pillow. During each block of finger-sequencing, subjects were asked to successively tap each finger to the thumb in a fixed sequence (index-middle-ring-little) which was repeated at least 10 times. Finger electro-goniometers were attached to the index and ring fingers on both hands in order to measure angular deviations during the task, and hands alternated between blocks. The task hand was raised, with the elbow resting on the pillow. The contralateral hand rested on the pillow. The finger tapping sequence was demonstrated to the subjects and they were instructed to tap with large finger movements at the maximum speed at which they could maintain the proper sequence. All subjects practiced one full sequence on each hand and repeated the directions back to the administrators to ensure understanding. Study personnel observed the practice with each hand to make sure the subject understood instructions.
Data from angular finger deviations during the tapping task, 10 sequences per hand per trial, 4 trials per hand per subject, were amplified by an MP100 system and sampled at a frequency of 100 Hz. Data were analyzed offline using Biopac AcqKnowledge software (v3.9.1, Biopac Systems Inc., Goleta CA, USA). Onset of each index finger tap was identified visually, blinded to diagnosis (a cursor is placed at the onset of each finger deflection) (Figure 1), and times exported for analysis. Mean tap times were calculated from the inter-tap-onset intervals for the 40 trial; variability was calculated using the CV (SD/mean).
Figure 1.
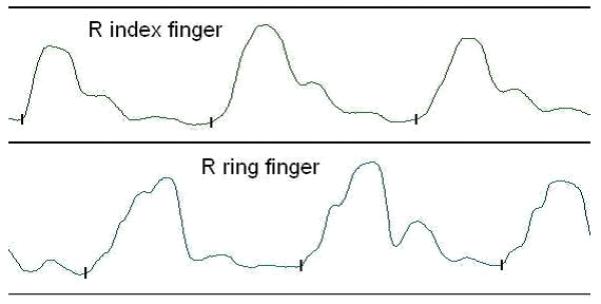
Goniometer tracing of fixed sequencing tapping of thumb to fingers (index-middle-ring-little)
Vertical mark (  ) denotes the beginning of finger extension. Mean and Standard Deviations of tap times were calculated from the inter-tap-onset intervals between the vertical marks, for four series of ten 1-2-3-4 finger taps.
Statistical analyses
Analyses were conducted using IBM SPSS/PASW Statistics 18.0.0.
Analyses of motor function and reaction time in ADHD vs TD children
Univariate diagnosis group analyses
To evaluate for possible confounding, non-diagnosis factors Age, Gender, reading scores, and IQ were compared across diagnostic groups using t test and Chi Square test.
Diagnosis group comparisons and Age Correlations
Reaction times (simple, choice, difference) and variability, PANESS scores, and goniometer data were compared across ADHD vs. TD groups with unpaired t test or non-parametric Wilcoxon Signed Rank test depending on normality of the data. Age effects within diagnostic groups were evaluated with Spearman nonparametric correlations.
Analyses of relationship between reaction times, variability, and motor function
Exploratory Univariate analyses of reaction times and motor function
Reaction Times were correlated with PANESS total scores, PANESS subscores, Goniometer data (mean finger speed; CV finger speed), and ADHD symptom severity (Conners’ ADHD parent rating T scores) conservatively, using Spearman nonparametric correlations.
Multivariate regressions of reaction times, variability, and motor function
Simple and choice reaction times (mean) and variability (CV) were regressed over the global rating of developmental motor function (PANESS score) and the finger movement parameters from the goniometer tracings – mean tapping times, tapping variability (CV). Stepwise regression was used with criterion .05 for variable entry and .10 for removal. As there are 4 primary comparisons, p < .0125 was considered significant (bonferroni correction). Secondary analysis in the ADHD subgroup was also conducted.
RESULTS
Demographics
There were no significant demographic differences between ADHD (n=19, 11 male, mean age 10 years 4.8 months, SD 19.2 months; IQ 103, reading score 104) and TD children (n=16, 10 male, mean age 11 years 3.6 months, SD 18 months, IQ 109, reading score 104).
Reaction times and Finger sequencing, by diagnosis group
Accuracy in both groups was 100% for Simple and 94% for Choice Reactions. Compared to their peers, ADHD children had significantly worse PANESS scores and slower simple and choice reaction times (Table 1). In addition, the choice-minus-simple reaction time differences were larger in the ADHD group. Intra-individual reaction time variability was approximately 50% greater for both simple and choice tasks, although the group difference was statistically more robust for variability in the choice task. Sequential finger tapping rates, particularly in the nondominant (left) hand, were significantly slower in ADHD children. Although inter-tap rate variability was higher in ADHD, this did not reach significance.
Table 1.
Reaction times and motor control by diagnosis and correlations with age
| Diagnosis Group Comparisons | Age Correlations, by Diagnosis | ||||||||
|---|---|---|---|---|---|---|---|---|---|
|
| |||||||||
| ADHD | TD | ADHD | TD | ||||||
| Mean | SD | Mean | SD | P | r | p | r | p | |
| Reaction Times | |||||||||
| SRT mean | 0.50 | 0.17 | 0.36 | 0.09 | <.01 | −0.60 | 0.01 | −0.81 | <.01 |
| ChRT mean | 0.80 | 0.34 | 0.51 | 0.11 | <.01 | −0.73 | <0.01 | −0.31 | .25 |
| RT difference | 0.30 | 0.20 | 0.14 | 0.07 | <.01 | −0.56 | 0.01 | 0.07 | .81 |
| SRT CV | 0.53 | 0.30 | 0.36 | 0.16 | .03 | −0.42 | 0.07 | −0.33 | .21 |
| ChRT CV | 0.36 | 0.16 | 0.24 | 0.05 | <.01 | −0.28 | 0.24 | 0.14 | .60 |
| Motor | |||||||||
| Development | |||||||||
| PANESS-total | 27.6 | 9.5 | 16.3 | 8.2 | <.01 | −0.54 | 0.05 | −0.46 | .08 |
| Finger | |||||||||
| Sequencing | |||||||||
| Goniometer | |||||||||
| RH tap time | 2.18 | 0.72 | 1.71 | 0.38 | .04 | 0.00 | 1.00 | −0.34 | .21 |
| LH tap time | 2.27 | 0.60 | 1.70 | 0.38 | <.01 | −0.17 | 0.64 | −0.39 | .16 |
| RH tap CV | 0.16 | 0.06 | 0.12 | 0.05 | .18 | −0.29 | 0.42 | −0.49 | .06 |
| LH tap CV | 0.16 | 0.08 | 0.12 | 0.05 | .14 | −0.57 | 0.08 | −0.48 | .07 |
ADHD = attention deficit hyperactivity disorder, TD = typically developing, SRT = simple reaction time, ChRT = choice reaction time, CV = coefficient of variation, PANESS = Physical and Neurological Examination for Subtle Signs, RH = right hand, LH = left hand. All times are in seconds.
Age correlations, by diagnosis group
In ADHD children, simple reaction times, choice reaction times, and reaction time differences decreased (improved) with age. PANESS total scores also improved in both groups with age, although only at the trend level in the TD group. Goniometer finger sequencing time improvements with age were not statistically significant. At the trend level, variability in inter-tap intervals tended to improve in both hands in TD, but only in non-dominant hand in ADHD children.
Longer Reaction Times and Worse Motor Function
Longer Simple and Choice Reaction Times correlated with higher (worse) PANESS scores and slower and more variable Goniometer-finger sequencing values (Table 2). These correlations were generally more robust for the Simple Reaction Task, and for goniometer-finger sequencing speed in the non-dominant (left) hand.
Table 2.
Univariate correlations of motor development, fine motor function, and behavioral ratings with reaction times
| Simple Reaction Time |
Choice Reaction Time |
Reaction Time difference |
Simple Reaction Time CV |
Choice Reaction Time CV |
||||||
|---|---|---|---|---|---|---|---|---|---|---|
| R | P | r | p | r | p | r | p | r | p | |
| Global motor development – PANESS total and subscores | ||||||||||
| Total | .544 | .002 | .605 | <.001 | .361 | .050 | .508 | .004 | .403 | .027 |
| Overflow | .434 | .017 | .430 | .018 | .191 | .311 | .484 | .007 | .303 | .104 |
| Gait/ Balance | .473 | .008 | .429 | .018 | .261 | .164 | .465 | .010 | .313 | .093 |
| Timed tasks | .539 | .002 | .625 | <.001 | .341 | .065 | .457 | .011 | .368 | .045 |
| Finger sequencing – Goniometer | ||||||||||
| RH tap time | .425 | .034 | .330 | .107 | .097 | .645 | .191 | .361 | .018 | .930 |
| LH tap time | .580 | .002 | .465 | .019 | .136 | .516 | .205 | .327 | .065 | .759 |
| RH tap CV | .340 | .096 | .351 | .086 | .138 | .512 | .474 | .017 | .196 | .347 |
| LH tap CV | .481 | .015 | .348 | .089 | .132 | .531 | .554 | .004 | .279 | .176 |
| ADHD Symptoms – Conners’ T scores | ||||||||||
| Conners’ Inattention |
.257 | .170 | .490 | .006 | .432 | .017 | .189 | .318 | .281 | .132 |
| Conners’ Hyperactivity |
.390 | .033 | .582 | .001 | .443 | .014 | .155 | .413 | .248 | .187 |
| Conners’ Total |
.317 | .088 | .543 | .002 | .440 | .015 | .181 | .338 | .272 | .147 |
ADHD Attention Deficit Hyperactivity Disorder (Diagnosis is categorical, Conners’ score is T Score for symptom severity, for all participants). CV = coefficient of variation; LH = left hand. RH = right hand. PANESS = Physical and Neurological Examination for Subtle Signs
Reaction Variability and Worse Motor Function
More variable Simple Reaction Times correlated with higher (worse) PANESS scores and more variable Goniometer-finger sequencing values (Table 2).
Dimensional inattention/hyperactivity and Motor Function
Slower Choice Reaction Times correlated with higher (worse) Conners’ ADHD T scores (Table 2). Hyperactivity scores only correlated modestly with simple reaction times. Parent-rated symptom severity did not correlate with reaction time variability.
Multivariate analyses of Motor Function and Reaction Times
Stepwise regression showed that total motor development, as rated by the PANESS score, was more significant than goniometer rated finger tapping speed or variability as a predictor for both Simple (F = 4.49, p = .045) and Choice (F = 5.34, p = .030) Reaction Times. Variability in timing in the LH finger tapping was the most significant predictor of Simple (F = 25.29, p < .001) and (F = 6.77, p = .016) Choice Reaction Time variability. Other factors, including FSIQ, were not significant in the regression (not shown).
DISCUSSION
In this case control study in 9-14 year children with ADHD and typically developing children, we explored relationships between motor development and simple and binary choice reaction times. We found correlations between the subtle, age-related differences in development of motor control characteristic of ADHD (Cole et al. , 2008; Denckla, 1985; Denckla et al. , 1978; Macneil et al. , 2011) and slower and more variable simple reaction times. Interestingly, we also found that variability in finger tapping speed during finger sequencing correlated with variability in simple response times. While studies in larger samples and using complementary techniques are needed, taken together, these findings suggest a role for the neural substrate of motor control in the slower and more variable reaction times in children with ADHD.
Reaction speeds to Go cues involve a combination of consistently attending and efficiently engaging the motor system. In studies evaluating reactions using the Conners Continuous Performance Task or Go/No-Go Tasks, scores or even hundreds of trials may be used, offering ample opportunity for susceptibility to fatigue, reduced motivation, enhanced frustration, consistently inefficient attention, or episodic lapses in attention to be reflected in summary scores of both speed and variability. The influence of such factors can be challenging to disentangle. Reaction time variability in ADHD children likely does relate in part to inattention (Smith et al. , 1984; Wahlstedt, 2009; Wahlstedt, Thorell & Bohlin, 2009). There appears to be a gradual slowing in reaction times in impaired ADHD children over the course of a sustained attention to response task (Smith et al. , 1984). These increases in mean reaction times and variability appear to result in part from occasional very prolonged responses detected through non-Gaussian analyses as an elevation in the Tau variable (Hervey et al. , 2006; Vaurio, Simmonds & Mostofsky, 2009).
In the present study, we identified ADHD-related differences and age correlations in a task with a small number of self-initiated trials. Thus our very short task appears to be valid and reasonably sensitive to timed neuropsychological functions that are impaired in ADHD children but improve with age. Despite these limited demands, response times were significantly longer in ADHD children. The association we found between chronometry and motor function using both PANESS and goniometer tracings suggests that motor system function may be a fruitful area for research into cognitive impairments in ADHD. We cannot exclude that inattention played some role in the diagnosis-group differences in reaction times, however. We note that the correlations of interest with motor development were generally most apparent in the simple reaction task, in Univariate and multivariate analyses.
The use of goniometers to quantify and compare fine motor skills children with ADHD is relatively new. This methodology can accurately detect differences in contralateral posturing (“tonic overflow”) during sequential finger movements in children with ADHD (Macneil et al. , 2011). We expected larger between-group differences and age correlations. It is possible that simple finger sequencing has matured to a sufficient degree by the ages of the children in the study that age-improvements are not statistically detectable in a sample of this size. Greater age/speed or variability correlations might be evident in younger children. Still, the findings of general improvement with age and detection of slower rates in ADHD children suggest goniometers or other methods quantifying fine finger movements may have some utility in motor and behavioral research in children. The data in the current study suggest this device and method may also be useful for quantifying dysrhythmia in finger movements in a variety of conditions where motor function is impaired, such as cerebellar diseases, to help tease out relationships between variable motor function and variable cognitive performance during timed tasks.
Limitations of this study include small sample size and biases inherent in samples of convenience. For example, it is possible, despite age, gender, and IQ matching, that normal volunteers function better than average and that more families with more impaired ADHD children were more likely to participate. However, all subjects underwent detailed diagnostic and cognitive assessments and results were consistent across groups. Thus some factors like IQ should not be confounders. Demographics and cognitive functions appear to be relatively generalizable as well. Still, these findings should be replicated independently.
Studies of reaction times may provide some quantitative functional and behavioral data which correspond to differences in brain volumes and maturation of white matter and cortical thickening in ADHD.(Castellanos, Lee, Sharp, Jeffries, Greenstein et al. , 2002; Mostofsky, Cooper, Kates, Denckla & Kaufmann, 2002; Shaw, Lerch, Greenstein, Sharp, Clasen et al. , 2006) We suggest that the development of the motor system in childhood may also provide an important window into the neurobiology of higher cognitive and behavioral functions. Motor functions are readily and reliably quantified and mature during time periods of interest for understanding ADHD and other developmental and behavioral disorders. Motor functions can also be incorporated into imaging or neurophysiology studies. Future studies of ADHD may benefit from combining and comparing motor function and neuropsychological function.
Acknowledgment
We acknowledge Ms. Amanda Lewis, Ms. Erica Kao and Ms. Natalia Carvalho for assistance gathering and processing data in this study, and Stewart M Mostofsky for insight and technical assistance.
Funding: University of Cincinnati Medical Student Summer Research Program, Cincinnati Children’s Hospital Medical Center Division of Neurology Summer Research Program, and NIH R01 MH078160
Donald L. Gilbert has received honoraria from the Tourette Syndrome Association/Centers for Disease Control, the Movement Disorder Society, the American Academy of Neurology, and the American Academy of Pediatrics; serves on the medical advisory board for the Tourette Syndrome Association; writes board review questions for PREP SA (American Academy of Pediatrics); has received research support from the NIH [NIMH R01 MH078160 (co-I), NIMH R01 MH08185 (co-I), and NINDS NS056276 (co-I)], Cincinnati Children’s Hospital Research Foundation, the University of Cincinnati, and the Tourette Syndrome Association, Otsuka Pharmaceuticals, and Psyadon Pharmaceuticals.
Footnotes
Financial disclosures Steve W. Wu receives research support from the Tourette Syndrome Association, Genzyme Corporation, and Otsuka Pharmaceuticals.
Contributor Information
Jenna M. Klotz, University of Cincinnati College of Medicine.
Matthew D. Johnson, University of Cincinnati College of Medicine.
REFERENCES
- Castellanos FX, Lee PP, Sharp W, Jeffries NO, Greenstein DK, Clasen LS, et al. Developmental trajectories of brain volume abnormalities in children and adolescents with attention-deficit/hyperactivity disorder. JAMA. 2002;288:1740–8. doi: 10.1001/jama.288.14.1740. [DOI] [PubMed] [Google Scholar]
- Cole WR, Mostofsky SH, Larson JC, Denckla MB, Mahone EM. Age-related changes in motor subtle signs among girls and boys with ADHD. Neurology. 2008;71:1514–20. doi: 10.1212/01.wnl.0000334275.57734.5f. [DOI] [PMC free article] [PubMed] [Google Scholar]
- Conners CK, Sitarenios G, Parker JD, Epstein JN. The revised Conners’ Parent Rating Scale (CPRS-R): factor structure, reliability, and criterion validity. Journal of Abnormal Child Psychology. 1998;26:257–68. doi: 10.1023/a:1022602400621. [DOI] [PubMed] [Google Scholar]
- Denckla MB. Revised Neurological Examination for Subtle Signs (1985) Psychopharmacology Bulletin. 1985;21:773–800. [PubMed] [Google Scholar]
- Denckla MB, Rudel RG. Anomalies of motor development in hyperactive boys. Ann Neurol. 1978;3:231–3. doi: 10.1002/ana.410030308. [DOI] [PubMed] [Google Scholar]
- Diamond A. Close interrelation of motor development and cognitive development and of the cerebellum and prefrontal cortex. Child Development. 2000;71:44–56. doi: 10.1111/1467-8624.00117. [DOI] [PubMed] [Google Scholar]
- DuPaul GJ, Power TJ, Anastopoulos AD, Reid R. ADHD Rating Scale-IV: Checklist, norms, and clinical interpretations. Guilford Press; New York: 1998. [Google Scholar]
- Epstein JN, Hwang ME, Antonini T, Langberg JM, Altaye M, Arnold LE. Examining predictors of reaction times in children with ADHD and normal controls. Journal of the International Neuropsychological Society. 2010;16:138–47. doi: 10.1017/S1355617709991111. [DOI] [PMC free article] [PubMed] [Google Scholar]
- Gilbert DL, Isaacs KM, Augusta M, Macneil LK, Mostofsky SH. Motor cortex inhibition: a marker of ADHD behavior and motor development in children. Neurology. 2011;76:615–21. doi: 10.1212/WNL.0b013e31820c2ebd. [DOI] [PMC free article] [PubMed] [Google Scholar]
- Gilbert DL, Wang ZW, Sallee FR, Ridel KR, Merhar S, Zhang J, et al. Dopamine transporter genotype influences the physiological response to medication in ADHD. Brain. 2006;129:2038–46. doi: 10.1093/brain/awl147. [DOI] [PubMed] [Google Scholar]
- Hervey AS, Epstein JN, Curry JF, Tonev S, Arnold LE, Conners CK, et al. Reaction time distribution analysis of neuropsychological performance in an ADHD sample. Child Neuropsychology. 2006;12:125–40. doi: 10.1080/09297040500499081. [DOI] [PubMed] [Google Scholar]
- Macneil LK, Xavier P, Garvey MA, Gilbert DL, Ranta ME, Denckla MB, et al. Quantifying excessive mirror overflow in children with attention-deficit/hyperactivity disorder. Neurology. 2011;76:622–8. doi: 10.1212/WNL.0b013e31820c3052. [DOI] [PMC free article] [PubMed] [Google Scholar]
- Mostofsky SH, Cooper KL, Kates WR, Denckla MB, Kaufmann WE. Smaller prefrontal and premotor volumes in boys with attention-deficit/hyperactivity disorder. Biological Psychiatry. 2002;52:785–94. doi: 10.1016/s0006-3223(02)01412-9. [DOI] [PubMed] [Google Scholar]
- Oldfield RC. The assessment and analysis of handedness: the Edinburgh inventory. Neuropsychologia. 1971;9:97–113. doi: 10.1016/0028-3932(71)90067-4. [DOI] [PubMed] [Google Scholar]
- Pennington BF, Ozonoff S. Executive functions and developmental psychopathology. J Child Psychol Psychiatry. 1996;37:51–87. doi: 10.1111/j.1469-7610.1996.tb01380.x. [DOI] [PubMed] [Google Scholar]
- Posner MI. Timing the brain: mental chronometry as a tool in neuroscience. PLoS Biol. 2005;3:e51. doi: 10.1371/journal.pbio.0030051. [DOI] [PMC free article] [PubMed] [Google Scholar]
- Reich W. Diagnostic interview for children and adolescents (DICA) Journal of the American Academy of Child and Adolescent Psychiatry. 2000;39:59–66. doi: 10.1097/00004583-200001000-00017. [DOI] [PubMed] [Google Scholar]
- Schuerholz LJ, Cutting L, Mazzocco MM, Singer HS, Denckla MB. Neuromotor functioning in children with Tourette syndrome with and without attention deficit hyperactivity disorder. J Child Neurol. 1997;12:438–42. doi: 10.1177/088307389701200705. [DOI] [PubMed] [Google Scholar]
- Shaw P, Lerch J, Greenstein D, Sharp W, Clasen L, Evans A, et al. Longitudinal Mapping of Cortical Thickness and Clinical Outcome in Children and Adolescents With Attention-Deficit/Hyperactivity Disorder 10.1001/archpsyc.63.5.540. Arch Gen Psychiatry. 2006;63:540–9. doi: 10.1001/archpsyc.63.5.540. [DOI] [PubMed] [Google Scholar]
- Smith Y, Parent A. Distribution of acetylcholinesterase-containing neurons in the basal forebrain and upper brainstem of the squirrel monkey (Saimiri sciureus) Brain Res Bull. 1984;12:95–104. doi: 10.1016/0361-9230(84)90220-x. [DOI] [PubMed] [Google Scholar]
- Vaurio RG, Simmonds DJ, Mostofsky SH. Increased intra-individual reaction time variability in attention-deficit/hyperactivity disorder across response inhibition tasks with different cognitive demands. Neuropsychologia. 2009;47:2389–96. doi: 10.1016/j.neuropsychologia.2009.01.022. [DOI] [PMC free article] [PubMed] [Google Scholar]
- Wahlstedt C. Neuropsychological deficits in relation to symptoms of ADHD: independent contributions and interactions. Child Neuropsychol. 2009;15:262–79. doi: 10.1080/09297040802524198. [DOI] [PubMed] [Google Scholar]
- Wahlstedt C, Thorell LB, Bohlin G. Heterogeneity in ADHD: neuropsychological pathways, comorbidity and symptom domains. J Abnorm Child Psychol. 2009;37:551–64. doi: 10.1007/s10802-008-9286-9. [DOI] [PubMed] [Google Scholar]
- Zahn TP, Kruesi MJ, Rapoport JL. Reaction time indices of attention deficits in boys with disruptive behavior disorders. J Abnorm Child Psychol. 1991;19:233–52. doi: 10.1007/BF00909980. [DOI] [PubMed] [Google Scholar]