Abstract
Denaturation of macromolecules within the tissues is believed to be the major factor contributing to the damage of tissues upon hyperthermia. As a result, the value of the spin-lattice relaxation time T1 of the tissue water, which is related to the translational and rotational rates of water, represents an intrinsic probe for investigating structural changes in tissues at high temperature. Therefore, the goal of the present work is to investigate whether the simultaneous measurement of temperature and T1 using a hybrid PRF-T1 measurement technique, can be used to detect irreversible changes in T1 that might be indicative of tissue damage. A new hybrid PRF-T1 sequence was implemented based on the variable flip angle DESPOT1 method from a standard 3D segmented EPI sequence by alternating two flip angles from measurement to measurement. The structural changes of the heated tissue volumes were analyzed based on the derived T1 values and the corresponding PRF temperatures. Using the hybrid PRF-T1 technique, we demonstrate that the change of spin lattice relaxation time T1 is reversible with temperature for low thermal dose (thermal dose ≤ 240 CEM43°C) and irreversible with temperature after significant accumulation of thermal dose in ex vivo chicken breast tissue. These results suggest that the hybrid PRF-T1 method may be a potentially powerful tool to investigate the extent and mechanism of heat damage of biological tissues.
Keywords: T1 mapping, MR Thermometry, Focus ultrasound, Thermal dose, Chicken breast
I Introduction
Focused Ultrasound Surgery (FUS) has been investigated for noninvasive destruction of deep-seated tumors for more than half a century (1,2). The effort to utilize high-intensity FUS (HIFU) as a modality for cancer treatment has been hindered by the lack of reliable treatment monitoring and guidance. Using magnetic resonance imaging (MRI), it has become possible to define the tissue to be treated, measure induced temperature changes in the tissue (3–5), and ensure proper targeting by localizing sub-threshold heating (6). However, there is currently no good way to assess the extent of biological tissue damage during the treatment process. Three methods are commonly used to predict or assess tissue damage (7): the first method uses the power output of the treatment device and the exposure duration to predict tissue damage (8–12). The second method postulates a critical temperature, Tc, above which tissue damage occurs (13). The third method uses the entire temperature history of the tissue to estimate the thermal dose (14). Because it is believed that denaturation of macromolecules within the tissues is the major factor contributing to the damage of tissues upon hyperthermia (15,16), a fourth method to assess tissue damage might be the longitudinal relaxation time (T1) of the tissue water, which is related to the translational and rotational rates of water and depends directly on the fraction of bound water. Since water in biological tissues exchanges freely with the fraction of water that is bound to macromolecules including protein, fibers, and membranes, T1 represents an intrinsic probe for investigating the structural changes in tissues at high temperature.
The water proton resonance frequency (PRF) shift is the currently accepted method to quantify temperature rises in aqueous soft tissues (4,17,18). PRF shows little dependence on the tissue changes that occur when the tissue is rapidly heated, such as with HIFU. The linearity of the PRF shift above the tissue necrosis threshold allows the tissue temperature to be estimated during the therapeutic ultrasound exposure.
The goal of the present work is to investigate whether a hybrid PRF-T1 measurement technique can be used to detect irreversible changes in tissue T1 that might be indicative of tissue damage during an MRgHIFU procedure. A new hybrid PRF-T1 sequence was implemented based on the variable flip angle (FA) DESPOT1 method (19) from a standard 3D segmented EPI sequence by alternating two FAs every other image. Evidence for structural changes of the heated tissue volumes was inferred based on changes in the relationship between derived T1 values and the corresponding PRF temperatures. These changes were compared with thermal dose measurements calculated using the Sapareto and Dewey (14) method.
II Theory
A conventional 3D segmented EPI sequence was modified to simultaneously determine the PRF shift and the spin-lattice relaxation time, T1, in all of the experiments presented in this work.
II.1 Measurement of T1 using the Variable Flip Angle (VFA) method
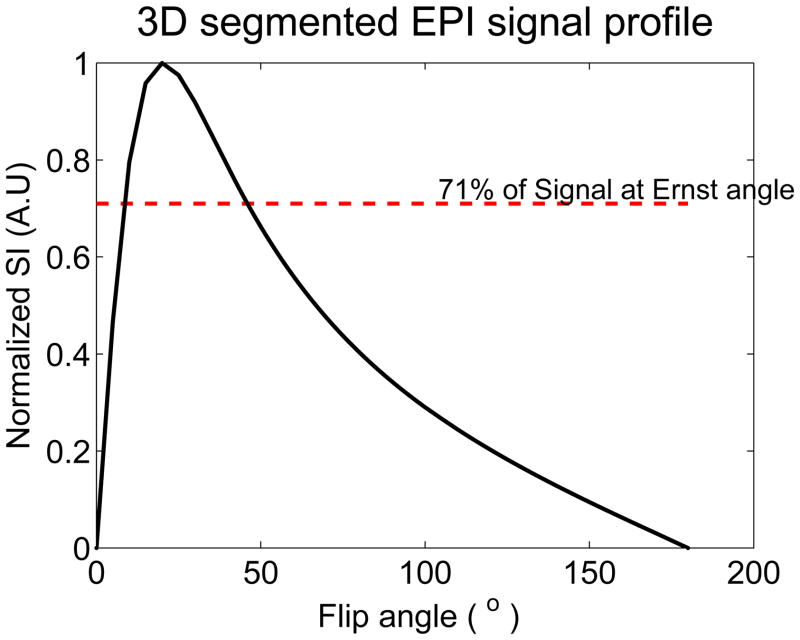
The variable flip angle method (19) using a 3D segmented EPI approach for T1 measurement is based on the ideally spoiled steady-state gradient echo signal. When two measurements are made at different flip angles, the signal equation can linearized and T1 extracted as described in (19). The two flip angles should be chosen carefully to optimize precision of the measurement. Deoni et al and Schabel et al have each shown that the precision is best when the flip angles are chosen such that they are on either side of the Ernst angle and each produces a signal that is 0.71 times the signal produced at the Ernst angle (19–21). The accuracy of the measurement is compromised when the actual flip angles achieved in the region of interest do not correspond with the nominal flip angles prescribed by the user. This is often the case in practice due to inhomogeneities in the B1 field and therefore a B1 field map for correcting these variations needs to be obtained prior to the measurement. In this work, this was done using the double flip angle method (20).
| (1) |
II.2 Measurement of PRF shift
The phase difference images are proportional to the temperature dependent PRF change and the echo time TE. The phase difference can be converted to a temperature change as (22):
| (2) |
where γ is the gyromagnetic ratio, β is the apparent PRF-thermal coefficient, B0 is the main magnetic field, and ΔΦ is the phase change. The basic (non-referenceless) PRF shift method relies on the subtraction of a baseline phase image acquired before heating from subsequent phase images that are acquired during the course of the heating experiment. This phase-image subtraction is necessary to exclude non-thermal contributions to the phase (e.g. phase due to RF coil sensitivity or B0 field inhomogeneities) leaving only the spatially resolved phase-shift attributable to temperature induced shift in the PRF. The echo time TE can be optimized to increase the phase contrast-to-noise ratio and thereby the temperature accuracy.
II.3 Pulse sequence design
To simultaneously calculate the PRF shift and the relaxation time, T1, a new hybrid PRF-T1 sequence based on the variable flip angle method described above was implemented from a standard 3D segmented EPI sequence. The modified 3D segmented EPI sequence consists of two FA’s that alternate from measurement to measurement. Hence the complete temperature maps can be acquired in either one or two measurements for PRF and T1 methods respectively.
III Materials and Methods
III.1 Experimental Setup
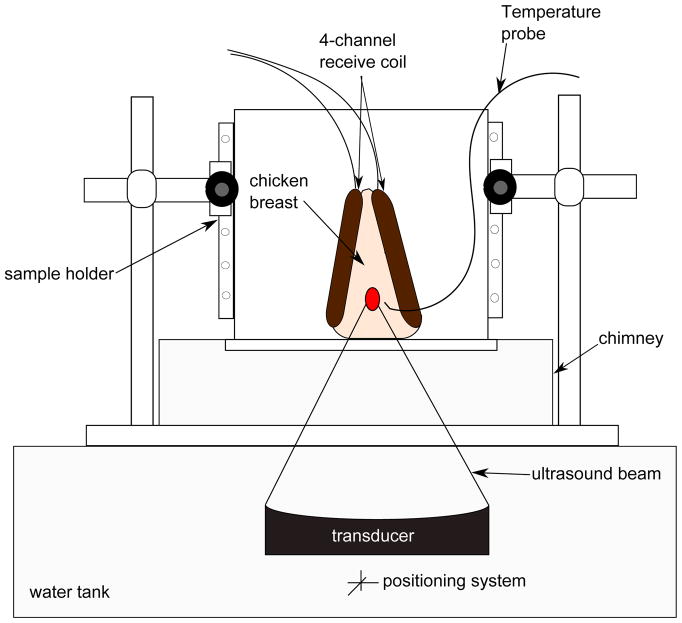
All imaging experiments were carried out on a Siemens TIM Trio 3T MRI scanner (Siemens Healthcare, Erlangen, Germany), using in-house built 4-channel RF receive surface coils. Multiple HIFU heating experiments were performed on ex vivo chicken breast tissue samples. Special care was taken to avoid any chicken breast with fat layers susceptible to corrupt the temperature measurement data. A 256-element MRI compatible phased-array ultrasound transducer (Imasonic, Besançon, France) was housed in a bath of deionized and degassed water. The transducer (1 MHz, 13 cm focal length) was mounted in a computer-controlled, mechanically driven, MRI compatible positioning system (Image Guided Therapy, Bordeaux, France). The ultrasound power was controlled outside the MR room via the controller computer. The tissue sample was sandwiched between the 4-channel RF receive coils for better imaging SNR at the ultrasound focus, and was placed in a sample holder container. To provide proper acoustic coupling, a layer of degassed water was poured between the bottom of the container made of Mylar film and the tissue sample. After obtaining high-resolution images of the sample, a fiberoptic temperature probe (OpSens, Inc, Quebec, Canada) was positioned near the focus but outside of the direct ultrasound beam path. Figure 1 shows a diagram of the experimental setup. The whole unit fit inside the bore of the magnet and heating was performed simultaneously with MR imaging with no apparent artifacts.
Figure 1.
Experiment setup. The chicken breast, sandwiched between the 4-channel receive coils, was placed within the sample holder container. A chimney filled with degassed water ensured an acoustic beam path to the tissue sample. A fiberoptic temperature probe was positioned near the focus to record temperature changes in real time.
III.2 Spin-Lattice Relaxation Time T1 and Temperature Imaging
A series of three experiments, using three separate chicken breast samples, was conducted. In each experiment, the prescribed (nominal) flip angles that would result in the best precision in T1 measurements were empirically determined by measuring the signal intensity averaged over a large region of interest using the PRF-T1 sequence with a range of flip angles from 5 to 95° in 10° increments. The two optimum FA’s were derived from the plot of the normalized signal intensity versus the nominal FA’s (see figure 2) as described in (19). Furthermore to minimize error in T1, the flip angle map of each optimum flip angle was obtained using the steps described earlier (equation 1). For all experiments, the HIFU heating parameters are given in Table 1.
Figure 2.
Plot of the normalized signal intensity (SI) of the 3D segmented EPI versus the flip angles. The maximum relaxation time T1 precision is achieved by choosing the flip angles such that: SI(α1) = SI(α2) = 71% of the signal intensity at Ernst angle αE.
Table 1. Experimental parameters.
The measurements were acquired with the following scan parameters for all heating runs: repetition time TR = 40 ms, echo time TE = 7 ms, bandwidth = 752 Hz/pixel, image matrix = 128×64, 12 slices, and 2 mm isotropic resolution.
| Flip angle 1 [°] | Flip angle 2 [°] | Acoustic Power [watts] | Heating time [min] | Cooling time [min] | |
|---|---|---|---|---|---|
| Experiment 1 | |||||
| Run 1 | 3 | 20 | 22 | 5 | 6 |
| Run 2 | 3 | 20 | 32 | 7 | 8 |
| Experiment 2 | |||||
| Run 1 | 8 | 42 | 7 | 3 | 5 |
| Run 2 | 8 | 42 | 7 | 3 | 5 |
| Run 3 | 8 | 42 | 11 | 3 | 5 |
| Run 4 | 8 | 42 | 7 | 3 | 5 |
| Run 5 | 8 | 42 | 14 | 3 | 5 |
| Run 6 | 8 | 42 | 7 | 3 | 5 |
| Run 7 | 8 | 42 | 21 | 3 | 5 |
| Run 8 | 8 | 42 | 7 | 3 | 5 |
| Run 9 | 8 | 42 | 24 | 3 | 5 |
| Run 10 | 8 | 42 | 7 | 3 | 5 |
| Experiment 3 | |||||
| Run 1 | 7 | 34 | 27 | 3 | 5 |
| Run 2 | 7 | 34 | 39 | 3 | 5 |
| Run 3 | 7 | 34 | 39 | 3 | 5 |
| Run 4 | 7 | 34 | 39 | 3 | 5 |
| Run 5 | 7 | 34 | 39 | 3 | 5 |
To supplement the PRF-T1 method, a conventional inversion recovery (IR) spin echo pulse sequence (TR/TE = 4100/17 ms, 2×2×2 mm resolution, 128×64 image matrix, echo train = 11, TI = [50 200 400 800 2000 2500 3000]) was used for T1 mapping of the chicken breast before and after the entire HIFU heating series. The values of T1 obtained were used to verify any permanent change in T1.
III.2.1 Experiment 1
The first experiment determined how T1 changes with temperature over time (23,24), Two separate HIFU heating runs were performed. Our 3D hybrid PRF-T1 sequence was used to acquire images during the heating and the cooling phases. Scan parameters for both heating runs were: TR/TE = 40/7 ms, readout bandwidth (BW) = 752 Hz/pixel, echo train length (ETL) = 5, image matrix = 128×64, 12 slices, and 2 mm isotropic resolution for a scan time of 8.3 seconds per measurement. The empirically determined optimum FA’s for this sample with these parameters were 3° and 20° respectively. Although TE= T2* is the optimal TE for PRF temperature imaging (25 msec in muscle (25)), a shorter TE was used to increase the image SNR for improved accuracy of T1 measurements and to potentially avoid exceeding 2π with the temperature-dependent phase shift at high-temperature elevation. To induce a uniform temperature rise in the target region, both heatings used a spiral trajectory (r = 2mm, 19 focal points, 100 msec/point).
III.2.2 Experiment 2
Experiment 2, was designed to determine the repeatability of T1 changes with temperature over time before permanent tissue damage occurs (thermal dose ≤ 240 Cumulative Equivalent Minutes at 43°C (CEM43)). Multiple sonications were applied at a single location in the chicken breast. Sonications were first applied at a relatively low power level (5 acoustic watts for 20 sec). The temperature information acquired during this sonication was scaled to find the power needed to produce the desired thermal dose in the subsequent heating runs. A series of ten sonications were applied at several power levels as outlined in Table 1. All heating runs used a circular trajectory (r =1 mm, 12 points, 100 msec/point). A variable time delay, ranging from 10 to 20 minutes was applied between ultrasound sonications to allow the heated region to cool to within about 5 °C of the starting temperature. The optimum FA’s were derived to be 8° and 42° respectively. All other scan parameters were equivalent to those used in experiment 1.
III.2.3 Experiment 3
Experiment 3 was performed to assess T1 changes with temperature over time when tissue damage has already occurred (thermal dose ≥ 240 CEM43). Five larger power values (Table 1) were used to sonicate the chicken breast. All the pulses were applied at the same location. The tissue was heated and cooled using the same timing described in experiment 2. The optimum FAs used were 7° and 34°.
III.3 Thermal Dose Calculation
To obtain an estimate of tissue thermal damage for comparison with the T1 measurements, corresponding maps of the accumulated thermal dose, as defined by Sapareto and Dewey (14), were generated for each time point of each sonication based on the fiber optic probe and PRF temperature measurements.
| (3) |
Where t43 is the thermal dose in CEM43, T is the average absolute temperature during time Δt, and tfinal = theating + tcooling is the final dose measurement time. T was determined by adding the fiber optic probe reading at the time of sonication to the PRF temperature change measurement. R is the isodose constant, which is temperature dependent, and was determined based on experimental data (26). Therefore, R = 0 for T < 39 °C, R = 0.25 for 39 < T < 43 °C and R = 0.5 for T > 43 °C (27). The dose maps for all the sonications at each location were summed to calculate the accumulated thermal dose. Based on literature values for muscle, 240 CEM43°C was used as a threshold dose for total necrosis (28,29).
III.4 Data Processing
For this work, all MR image reconstruction and post-processing was performed off-line. The optimal SNR multicoil algorithm was used to combine the coils (30). Averaging over the phase maps of the two optimum FAs was used to improve the SNR of the temperature map. To avoid phase wraparound errors that would occur at sufficiently high temperature, a phase difference image ΔΦi was constructed on a pixel-by-pixel basis from each image complex image, SIi, acquired during the heating cycle such as:
| (4) |
The total phase change was obtained as the sum of ΔΦi over time. For continuous heating experiments where images are acquired sequentially, this technique prevents the phase difference from exceeding ±2π. Magnitude images were used as masks to remove background noise in the phase and temperature images. While there exists temperature dependence values for muscle (31) or pure water (17) in the literature, our calibration experiments showed a value of −0.009 ppm/°C in ex vivo chicken breast. Finally, the temperature maps were converted to thermal dose maps using equation 3. The values of the spin-lattice relaxation time T1 were calculated from the magnitude images of the two optimum FAs (Eq. 3). Before obtaining the T1 maps, the image noise was reduced by applying a Hanning-filter to the raw data before reconstruction. To compensate for tissue variability of T1, the data were plotted as relative change.
To examine whether dynamic changes in T1 can be used to indicate irreversible changes in tissues the dependence of T1 on temperature prior to tissue damage was determined on a voxel basis using all time points for which the accumulated thermal dose remained negligible. This voxel specific slope was then used dynamically to correct the T1 measurement for all subsequent time points:
| (5) |
where is the voxel-specific dependence of T1 on temperature.
IV Results
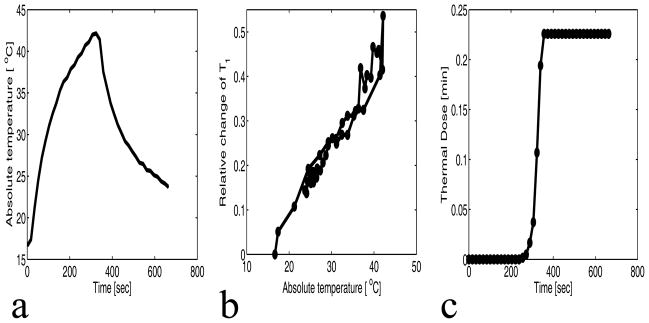
The simultaneous water proton spin-lattice relaxation time T1 and the temperature change (PRF) were measured for the chicken breast tissues over a 2×2 voxel ROI centered at the focus. Figure 3(a) shows the plot of the absolute temperature (fiberoptic temperature + PRF temperature change) versus the time for experiment 1, run 1 at 22 acoustic watts. The recorded temperatures via the fiberoptic temperature probe during the experiment vary from the PRF-derived temperature at an ROI chosen near the tip of the probe by ±1°C. Figures 3(b) and 3(c) are the corresponding plots of the relative change of T1 versus the absolute temperature and the cumulative equivalent minute thermal dose versus the time, respectively. To estimate precision, the standard deviation of relative change in T1 measured in a uniform, non-heated region was found to be 0.009. From figure 3(b–c), it can be seen that T1 is reversible with temperature when the maximum cumulative equivalent minute thermal dose at the focus is very low (0 and 0.25 CEM) compared to the threshold value of 240 CEM.
Figure 3.
Sonication results of chicken breast for experiment 1 run 1 (22 watts). a: Plot of the average absolute temperature versus time of 4 voxels centered at the focus. b: Plot of the relative change of T1 versus the absolute temperature of the 4 voxels centered at the focus. The precision of the relative change of T1 is 0.009. c: Plot of the mean thermal dose versus time of the 4 voxels centered at the focus.
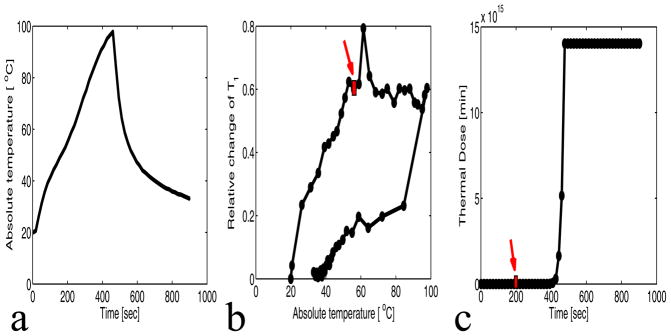
Figure 4(a) shows the plot of the absolute temperature versus the time for experiment 1 run 2 at 32 acoustic watts. Figure 4(b) and 4(c) show that the relative change of T1 versus temperature curve deviates from linearity when the thermal dose exceeds 240 CEM43, and that T1 is no longer reversible. The precision of the relative change in T1 is 0.0014. The rectangle in figures 4(b) and 4(c) indicate the time point at which 240 CEM43 was reached.
Figure 4.
Sonication results of chicken breast for experiment 1 run 2 (32 watts). a: Plot of the absolute temperature versus time of 4 voxels centered at the focus. b: Plot of the relative change of T1 versus the absolute temperature of the 4 voxels centered at the focus. The precision of the relative change of T1 is 0.014. c: Plot of the mean thermal dose versus the time of the 4 voxels centered at the focus. The arrows on parts b and c indicate the time at which 240 CEM was reached.
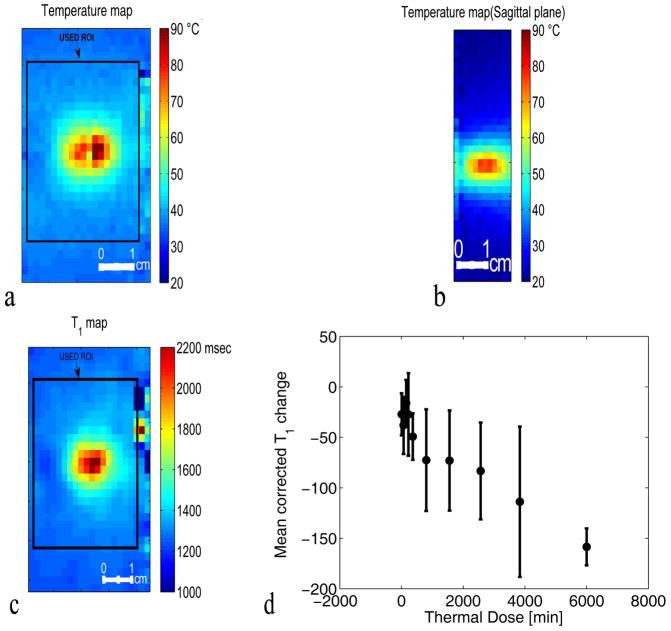
The deviation of the T1 versus temperature curve from linearity is observed in voxels in all five central slices from the 3D volume where significant thermal dose was accumulated (Figure 5(c)). In this plot, the T1 measurements in every voxel in a 21×21 voxel ROI (see the absolute temperature and the absolute T1 maps shown in figure 5(a–b)) for the five central slices covering the focal zone at all time points are corrected for the instantaneous temperature and then the T1cor values are averaged based upon accumulated dose. The thermal dose was subdivided in ten different ranges of dose: [0 50], [50 100], [100 200], [200 240], [240 500], [500 1000], [1000 2000], [2000, 3000], [3000 5000], and [5000 (higher dose)]. The mean corrected T1 change for the range of thermal dose 5000 and higher is plotted at the location 6000 along the dose axis for better visualization. The error bars represent the standard error of the corrected T1 change values in each dose range.
Figure 5.
Coronal (a) and sagittal (b) planes through the 3D PRF temperature map around the focal spot at the peak temperature in experiment 1 run 2 (32 watts). (c) Corresponding T1 map of the focal zone at the peak temperature for experiment 1 run 2 (32 watts). (d) Plot of the dose-interval-averaged change of T1cor versus the thermal dose. T1cor values were calculated in the volume defined by the black rectangle in (c) (21×21 voxels) over the 5 central slices. For averaging, the thermal dose was subdivided in ten different ranges of dose: [0 50], [50 100], [100 200], [200 240], [240 500], [500 1000], [1000 2000], [2000, 3000], [3000 5000], and [5000 (higher dose)]. The mean value of T1cor change for the range of thermal dose 5000 and higher is located at the point 6000 CEM on the dose axis for better visualization of all voxels used. The error bars represent the standard error of the mean value of the T1cor change values averaged in each dose range.
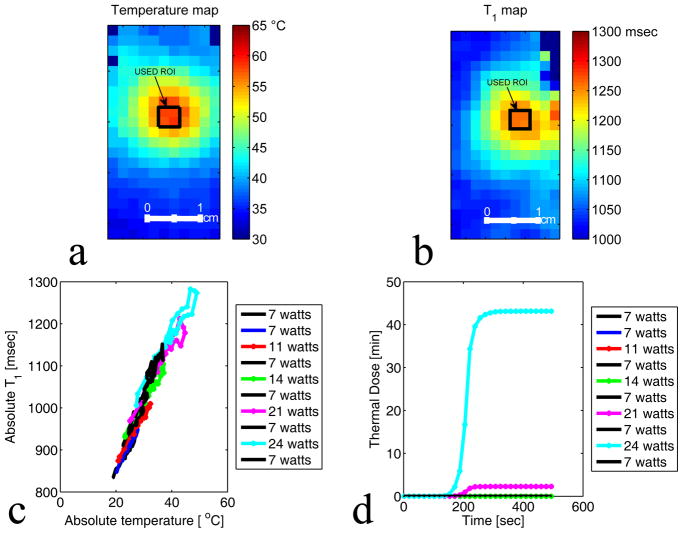
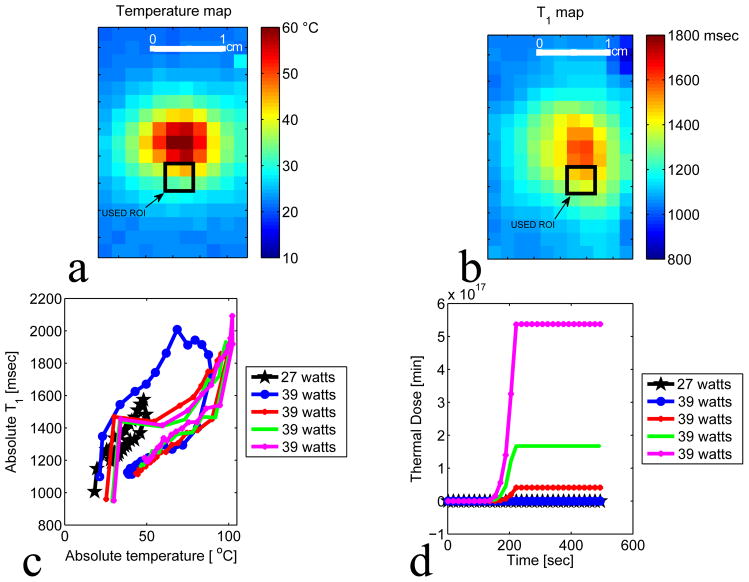
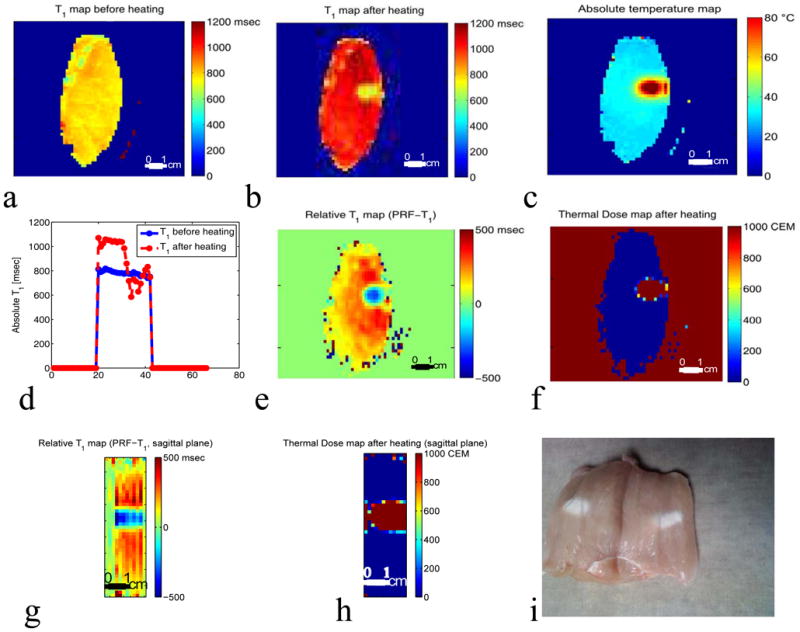
Figures 6(a) and 6(b) show the absolute temperature and the absolute T1 maps of the focal zone for experiment 2 run 9. The black rectangle represents the ROI used to plot figures 6 (c) and (d). Figures 6 (c) and (d) present the results of experiment 2 and plots the absolute T1 versus the absolute temperature and the corresponding thermal dose versus the time for a series of ten HIFU heating and cooling runs ranging from 7 to 24 acoustic watts. Figures 6(c) and 6(d) show that the relative T1 is reversible with temperature before tissue damage occurs. Figures 7(a) and 7(b) present the absolute temperature and the absolute T1 maps of experiment 3 run 1. Figure 7(b) and 7(c) show the results of experiment 3 and plot the absolute T1 versus the absolute temperature and the corresponding thermal dose versus the time for five HIFU heating and cooling runs ranging from 27 to 39 acoustic watts. Figures 7(c) and 7(d) demonstrate that the irreversibility in T1 is observed when the accumulated thermal dose exceeds the tissue damage threshold value of 240 CEM43. The T1 values calculated using the IR method as shown in Figure 8(a–b) were obtained before any heating and after the last heating run in experiment 3. The irreversible tissue changes were visually detectable (figure 8(i)). Comparisons of the T1 changes with thermal dose are also shown in Figure 8 (e–h). The color of the chicken breast tissue changed from light pink to white, and free fluid was visible.
Figure 6.
Plot of absolute T1 with low accumulated thermal dose. a–b: Temperature and T1 maps of the focal zone for experiment 2 run 9. The black rectangle represents the ROI used to plot figure c and d. c: Plot of average T1 versus the average absolute temperature of 4 voxels centered at the focus. A series of ten heating and cooling runs were performed at the acoustic powers: 7 watts, 7 watts, 11 watts, 7 watts, 14 watts, 7 watts, 21 watts, 7 watts, 24 watts, and 7 watts. d: Plot of the corresponding thermal dose versus time averaged over the same 4 voxels centered at the focus.
Figure 7.
Plot of absolute T1 after high thermal dose. a–b: Temperature and T1 maps of the focal zone for experiment 3 run 1. The black rectangle represents the ROI used to plot figure c and d. The ROI was chosen in region where no voxel were heated to boiling temperature. c: Plot of T1 versus the absolute temperature of 4 voxels at the focus. A series of five heating and cooling runs were performed at the acoustic powers: 27 watts, 39 watts, 39 watts, 39 watts, 39 watts. d: Plot of the corresponding thermal dose versus time of the 4 voxels centered at the focus.
Figure 8.
Distribution of absolute and relative T1 obtained using Inversion Recovery (IR) and PRF-T1 in a coronal slice of the chicken breast. a: IR T1 map before the HIFU heating. b: IR T1 map of the same coronal slice after the five heating runs in experiment 3 were performed. c: Absolute temperature map of the slice at peak temperature during heating in experiment 3, run 5. d: Cross-section taken centrally through IR T1 maps before (blue line) and after heating (red dashed line) in experiment 3. The local drop in T1 corresponds to the region of heating. e: T1 change map derived from the PRF-T1 method after the five heating runs in experiment 3. The T1 changes map was obtained by subtracting the first time frame of run 1 from the last time frame of run 5. f: Corresponding thermal dose map of the same coronal slice. The local drop in T1 corresponds to the region of heating as shown by the thermal dose map. Sagittal (g–h) through the 3D relative T1 and thermal dose maps derived from the PRF-T1 method. i: Picture of the chicken breast after the 5 runs of experiment 3. The color of the chicken breast tissue changed from light pink to white. The color change was the visual indicator that tissue damage has occurred.
V Discussions and Conclusion
The results we have obtained in ex vivo chicken breast tissue using the hybrid PRF-T1 technique are consistent with the suggestion that the spin lattice relaxation time T1 changes reversibly with temperature for low thermal dose accumulation and irreversibly with temperature after significant accumulation of thermal dose. According to the hyperthermia literature (16,32,33), the dose threshold of 240 CEM43 is adequate to coagulate all tissue and thus has been used as an indicator of tissue damage caused by focused ultrasound. Figure 6(c and d) shows that repeated MRgHIFU sonications at the same location with minimal thermal dose accumulation (<50 CEM43) results in reversible changes in T1. The results in Figure 4(b and c) are consistent with the hypothesis that irreversible change in T1 occurs at about 240 CEM43. This conclusion is further confirmed by the results shown in Figure 5d and Figure 7(c and d).
Temperature measurements and indications of tissue changes are both important for the monitoring and quality control of thermal therapy treatments. Therefore, the hybrid PRF-T1 method has the advantages of simultaneously producing two types of valuable information about the tissue during thermal therapy: a change in T1 that depends on temperature and cell/tissue structure and a change in the PRF that depends only on temperature. The presented results indicate that monitoring the T1 change along with temperature is a potential complementary indicator for assessing tissue damage due to hyperthermia.
One of the prerequisites for successful T1 monitoring of thermal therapy is stability over the entire treatment period. The data presented in this paper, such as that shown in Figure 6(c) demonstrate the stability of T1 determination for a treatment time of approximately three hours during the application of several individual sonications. T1 has the advantage of being less dependent on fluctuations of the magnetic field than the chemical shift at high field, and is highly dependent on temperature, providing improved measurement stability when compared to PRF temperature measurements. Therefore, while the hybrid PRF-T1 technique requires several calibration steps, the obtained calibration does remain valid over a clinically feasible MRgHIFU treatment duration.
It may be feasible to improve the practicality of applying the hybrid PRF-T1 technique by reducing the calibrations steps and the acquisition times. The temporal footprint of each image can be reduced by subsampling and using parallel image reconstruction (e.g. GRAPPA) to reduce the acquisition time by 2 or more with minimal loss in accuracy of the temperature and T1 maps. The reduction of acquisition time would allow a better evaluation of T1 evolution during the treatment, and thus the assessment of thermal dose effects. The calibration steps described earlier in this paper are necessary for an accurate T1 calculation. Therefore, it should be noted that the accuracy of the variable flip angle technique is essentially dependent on using the actual local flip angles. B1 inhomogeneity causes a spatial variation in the flip angle and therefore needs to be corrected (34). Several other B1 mapping techniques exist, which are capable of producing accurate B1 maps (35). We have chosen the double flip angle method because of its simplicity and accuracy. Although B1 mapping over the entire volume can require several minutes of acquisition and processing, it has to be performed only once and then can be used throughout the procedure.
There are several limitations to the results in this study: The dose calculations assume that our PRF temperature measurements are accurate. Small errors in the temperature measurement can lead to large errors in thermal dose calculation. While the measured PRF temperature localized around the fiberoptic probe were accurate to within +/− 1°C, that does not necessarily translate to accuracy across the entire region of interest. The dose calculations also assume that accumulated dose is additive over the relatively long time-course of each experiment. Further, although the double angle method should be reasonably accurate, there were larger variations in T1 than expected and are likely due to uncompensated variations in the B1 across the sample. Although the dependence of tissue T1 on the dynamic structure and amount of water in the tissue should make it a valuable index for reflecting the state of tissue, a major concern is whether water migration due to sublethal heating of tissue may cause a confounding change in T1. Finally, we note that jumps in the T1 values were observed in all experiments, as can be seen in Figures 3(b), 4(b), and 7(c). These jumps only occur in voxels in the ultrasound focus and correspond to a measured increase in T1 when ultrasound is turned on and a decrease when it is turned off. These jumps are very consistent and are a subject of an ongoing investigation that will be reported subsequently.
In summary, this work has introduced and tested the 3D hybrid PRF-T1 technique as a new method of evaluating the thermal exposure induced by focused ultrasound sonications. We have demonstrated in ex vivo tissue samples that the temperature-corrected T1 values obtained using the hybrid PRF-T1 method gives potentially very useful information about tissue damage that correlates with our estimates of accumulated thermal dose. However, further investigation is needed to more completely assess the link between the T1 temperature dependence and tissue damage. First, the reversibility of T1 with temperature at low thermal dose and the transition to irreversibility at high dose needs to be validated in vivo. These experiments should test for the existence of a threshold at which such a transition occurs. Because tissue T1 is influenced by a delicate balance of the water content, the macroscopic and microscopic distribution of water in different sites, and the macromolecular-water interactions (36), it is important to determine the effects of heating on T1 in vivo. Although the T1 dependence in vivo may be confounded by changes in water content or other tissue properties, a detectable change in the functional relationships between T1 and temperature might be an indicator of the point at which damage occurs. Determining this functional relationship for a variety of tissues might be used during treatments to improve the success of the thermal therapy. For example, the T1 temperature dependence may provide online information to the physician so that the desired target volume is exposed adequately. Further, use of thermal imaging and the T1 change threshold calculation might increase safety by providing warning before the surrounding normal tissue is overexposed. Since the hybrid PRF-T1 technique can produce simultaneously T1 and PRF temperature maps and therefore the thermal dose map, it appears to be well suited for tissue damage assessment.
Acknowledgments
The authors appreciate helpful contributions from Joshua de Bever, Dr. Robert B. Roemer and other collaborators at the University of Utah. This work was supported by The Ben B. and Iris M. Margolis Foundation, Siemens Medical Solutions, and NIH R01 CA134599.
References
- 1.Hill CR, Bamber JC, ter Haar GR. Physical Principles of Medical Untrasonics. 2. Chichester, U. K: Wiley; 2004. [Google Scholar]
- 2.Kremkau FW. Cancer therapy with ultrasound: a historical review. J Clin Ultrasound. 1979;7(4):287–300. doi: 10.1002/jcu.1870070410. [DOI] [PubMed] [Google Scholar]
- 3.Dickinson RJ, Hall AS, Hind AJ, Young IR. Measurement of changes in tissue temperature using MR imaging. J Comput Assist Tomogr. 1986;10(3):468–472. [PubMed] [Google Scholar]
- 4.Ishihara Y, Calderon A, Watanabe H, Okamoto K, Suzuki Y, Kuroda K, Suzuki Y. A precise and fast temperature mapping using water proton chemical shift. Magn Reson Med. 1995;34(6):814–823. doi: 10.1002/mrm.1910340606. [DOI] [PubMed] [Google Scholar]
- 5.Parker DL, Smith V, Sheldon P, Crooks LE, Fussell L. Temperature distribution measurements in two-dimensional NMR imaging. Med Phys. 1983;10(3):321–325. doi: 10.1118/1.595307. [DOI] [PubMed] [Google Scholar]
- 6.Hynynen K, Vykhodtseva NI, Chung AH, Sorrentino V, Colucci V, Jolesz FA. Thermal effects of focused ultrasound on the brain: determination with MR imaging. Radiology. 1997;204(1):247–253. doi: 10.1148/radiology.204.1.9205255. [DOI] [PubMed] [Google Scholar]
- 7.McDannold NJ, King RL, Jolesz FA, Hynynen KH. Usefulness of MR imaging-derived thermometry and dosimetry in determining the threshold for tissue damage induced by thermal surgery in rabbits. Radiology. 2000;216(2):517–523. doi: 10.1148/radiology.216.2.r00au42517. [DOI] [PubMed] [Google Scholar]
- 8.Anzai Y, Lufkin RB, Castro DJ, Farahani K, Jabour BA, Layfield LJ, Udkoff R, Hanafee WN. MR imaging-guided interstitial Nd:YAG laser phototherapy: dosimetry study of acute tissue damage in an in vivo model. J Magn Reson Imaging. 1991;1(5):553–559. doi: 10.1002/jmri.1880010508. [DOI] [PubMed] [Google Scholar]
- 9.Carstensen EL, Becroft SA, Law WK, Barbee DB. Finite amplitude effects on the thresholds for lesion production in tissues by unfocussed ultrasound. J Acoust Soc Am. 1981;70(2):302–309. [Google Scholar]
- 10.Dunn F, Fry FJ. Ultrasonic threshold dosages for the mammalian central nervous system. IEEE Trans Biomed Eng. 1971;18(4):253–256. doi: 10.1109/tbme.1971.4502847. [DOI] [PubMed] [Google Scholar]
- 11.Dunn F, Lohnes JE, Fry FJ. Frequency dependence of threshold ultrasonic dosages for irreversible structural changes in mammalian brain. J Acoust Soc Am. 1975;58(2):512–514. doi: 10.1121/1.380666. [DOI] [PubMed] [Google Scholar]
- 12.Fry FJ, Kossoff G, Eggleton RC, Dunn F. Threshold ultrasonic dosages for structural changes in the mammalian brain. J Acoust Soc Am. 1970;48(6) Suppl 2:1413. doi: 10.1121/1.1912301. [DOI] [PubMed] [Google Scholar]
- 13.Robinson TC, Lele PP. An analysis of lesion development in the brain and in plastics by high-intensity focused ultrasound at low-megahertz frequencies. J Acoust Soc Am. 1972;51(4):1333–1351. doi: 10.1121/1.1912979. [DOI] [PubMed] [Google Scholar]
- 14.Sapareto SA, Dewey WC. Thermal dose determination in cancer therapy. Int J Radiat Oncol Biol Phys. 1984;10(6):787–800. doi: 10.1016/0360-3016(84)90379-1. [DOI] [PubMed] [Google Scholar]
- 15.Cheng KH, Hernandez M. Magnetic resonance diffusion imaging detects structural damage in biological tissues upon hyperthermia. Cancer Res. 1992;52(21):6066–6073. [PubMed] [Google Scholar]
- 16.Damianou C, Hynynen K. The effect of various physical parameters on the size and shape of necrosed tissue volume during ultrasound surgery. J Acoust Soc Am. 1994;95(3):1641–1649. doi: 10.1121/1.408550. [DOI] [PubMed] [Google Scholar]
- 17.Hindman JC. Proton resonance shift of water in the gas and liquid states. J Chem Phys. 1966;44:4582–4592. [Google Scholar]
- 18.Kuroda K, Abe K, Tsutsumi S, Ishihara Y, Suzuki Y, Sato K. Advanced Techniques and Clinical Applications in Biomedical Thermology. Chur, Switzerland: Harwood Academic Publishers; 1993. Water proton magnetic resonance spectroscopic imaging. [Google Scholar]
- 19.Deoni SC, Rutt BK, Peters TM. Rapid combined T1 and T2 mapping using gradient recalled acquisition in the steady state. Magnetic resonance in medicine : official journal of the Society of Magnetic Resonance in Medicine/Society of Magnetic Resonance in Medicine. 2003;49(3):515–526. doi: 10.1002/mrm.10407. [DOI] [PubMed] [Google Scholar]
- 20.Morrell GR, Schabel MC. An analysis of the accuracy of magnetic resonance flip angle measurement methods. Phys Med Biol. 2010;55(20):6157–6174. doi: 10.1088/0031-9155/55/20/008. [DOI] [PubMed] [Google Scholar]
- 21.Schabel MC, Morrell GR. Uncertainty in T(1) mapping using the variable flip angle method with two flip angles. Phys Med Biol. 2009;54(1):N1–8. doi: 10.1088/0031-9155/54/1/N01. [DOI] [PubMed] [Google Scholar]
- 22.Quesson B, de Zwart JA, Moonen CT. Magnetic resonance temperature imaging for guidance of thermotherapy. J Magn Reson Imaging. 2000;12(4):525–533. doi: 10.1002/1522-2586(200010)12:4<525::aid-jmri3>3.0.co;2-v. [DOI] [PubMed] [Google Scholar]
- 23.Kamman RL, Go KG, Brouwer W, Berendsen HJ. Nuclear magnetic resonance relaxation in experimental brain edema: effects of water concentration, protein concentration, and temperature. Magnetic resonance in medicine : official journal of the Society of Magnetic Resonance in Medicine/Society of Magnetic Resonance in Medicine. 1988;6(3):265–274. doi: 10.1002/mrm.1910060304. [DOI] [PubMed] [Google Scholar]
- 24.Parker DL. Applications of NMR imaging in hyperthermia: an evaluation of the potential for localized tissue heating and noninvasive temperature monitoring. IEEE Trans Biomed Eng. 1984;31(1):161–167. doi: 10.1109/TBME.1984.325382. [DOI] [PubMed] [Google Scholar]
- 25.Chung AH, Hynynen K, Colucci V, Oshio K, Cline HE, Jolesz FA. Optimization of spoiled gradient-echo phase imaging for in vivo localization of a focused ultrasound beam. Magnetic resonance in medicine : official journal of the Society of Magnetic Resonance in Medicine/Society of Magnetic Resonance in Medicine. 1996;36(5):745–752. doi: 10.1002/mrm.1910360513. [DOI] [PubMed] [Google Scholar]
- 26.Meshorer A, Prionas SD, Fajardo LF, Meyer JL, Hahn GM, Martinez AA. The effects of hyperthermia on normal mesenchymal tissues. Application of a histologic grading system. Arch Pathol Lab Med. 1983;107(6):328–334. [PubMed] [Google Scholar]
- 27.Arora D, Skliar M, Roemer RB. Minimum-time thermal dose control of thermal therapies. IEEE Trans Biomed Eng. 2005;52(2):191–200. doi: 10.1109/TBME.2004.840471. [DOI] [PMC free article] [PubMed] [Google Scholar]
- 28.Damianou C, Hynynen K, Fan X. Evaluation of accuracy of a theoretical mode for predicting the necrosed tissue volume during focused ultrasound surgery. IEEE Transactions on Ultrasonics, Ferroelectrics, and Frequency Control. 1995;42(2):182–187. [Google Scholar]
- 29.Dewey WC. Arrhenius relationships from the molecule and cell to the clinic. Int J Hyperthermia. 1994;10(4):457–483. doi: 10.3109/02656739409009351. [DOI] [PubMed] [Google Scholar]
- 30.Bernstein MA, Grgic M, Brosnan TJ, Pelc NJ. Reconstructions of phase contrast, phased array multicoil data. Magn Reson Med. 1994;32(3):330–334. doi: 10.1002/mrm.1910320308. [DOI] [PubMed] [Google Scholar]
- 31.MacFall JR, Prescott DM, Charles HC, Samulski TV. 1H MRI phase thermometry in vivo in canine brain, muscle, and tumor tissue. Med Phys. 1996;23(10):1775–1782. doi: 10.1118/1.597760. [DOI] [PubMed] [Google Scholar]
- 32.Chung AH, Jolesz FA, Hynynen K. Thermal dosimetry of a focused ultrasound beam in vivo by magnetic resonance imaging. Med Phys. 1999;26(9):2017–2026. doi: 10.1118/1.598707. [DOI] [PubMed] [Google Scholar]
- 33.McDannold, Hynynen K, Wolf D, Wolf G, Jolesz F. MRI evaluation of thermal ablation of tumors with focused ultrasound. J Magn Reson Imaging. 1998;8(1):91–100. doi: 10.1002/jmri.1880080119. [DOI] [PubMed] [Google Scholar]
- 34.Cunningham CH, Pauly JM, Nayak KS. Saturated double-angle method for rapid B1+ mapping. Magnetic resonance in medicine : official journal of the Society of Magnetic Resonance in Medicine/Society of Magnetic Resonance in Medicine. 2006;55(6):1326–1333. doi: 10.1002/mrm.20896. [DOI] [PubMed] [Google Scholar]
- 35.Morrell GR. A phase-sensitive method of flip angle mapping. Magnetic resonance in medicine : official journal of the Society of Magnetic Resonance in Medicine/Society of Magnetic Resonance in Medicine. 2008;60(4):889–894. doi: 10.1002/mrm.21729. [DOI] [PubMed] [Google Scholar]
- 36.Mathur-De Vre R. Biomedical implications of the relaxation behaviour of water related to NMR imaging. Br J Radiol. 1984;57(683):955–976. doi: 10.1259/0007-1285-57-683-955. [DOI] [PubMed] [Google Scholar]


