

Abstract
MicrorRNA are small noncoding RNA molecules that regulate the posttranscriptional expression of target genes. In addition to being involved in many biologic processes, microRNAs are important regulators in innate and adaptive immune responses. Distinct sets of expressed microRNAs are found in different cell types and tissues and aberrant expression of microRNAs is associated with many disease states. MicroRNA expression was examined in a model of heterotopic heart transplantation by microarray analyses and a unique profile was detected in rejecting allogeneic transplants (BALB/c → C57BL/6) as compared to syngeneic transplants (C57BL/6 → C57BL/6). The microRNA miR-182 was significantly increased in rejecting cardiac allografts and in mononuclear cells that infiltrate the grafts. Forkhead box (FOX) proteins are a family of important transcription factors and FOXO1 is a target of miR-182. As miR-182 increases after transplant, there is a concomitant posttranscriptional decrease in FOXO1 expression in heart allografts that is localized to both the cardiomyocytes and CD3+ T cells. The microRNA miR-182 is significantly increased in both peripheral blood mononuclear cells and plasma during graft rejection suggesting potential as a biomarker of graft status. Our results identify microRNAs that may regulate alloimmune responses and graft outcomes.
Keywords: Allograft rejection, FOXO1, immune response, microRNA, microRNAs, miR-182
Introduction
MicroRNAs (miRNAs) are small noncoding RNA molecules of about 22 nucleotides that regulate the posttranscriptional expression of target genes (1). The biogenesis of miRNA is a multistep process occurring in the cell nucleus and cytoplasm. The mature miRNA is incorporated into the RNA-induced silencing complex to bind the 3′ untranslated region (UTR) of mRNA, leading to mRNA degradation or translational inhibition (2). To date over 1000 human miRNAs have been identified although the target genes of many remain unknown (3,4). MiRNAs have been shown to play crucial roles in cellular development, cell differentiation, tumorigenesis, apoptosis and proliferation (5–7). Further, miRNAs are involved in innate and adaptive immune responses (8,9). For example, miR-181a is an intrinsic modulator of T-cell sensitivity and selection that facilitates clonal deletion by modulating the T-cell receptor (TCR) signaling threshold of thymocytes (10,11). MiR-155 is important for cytokine production by T and B cells and antigen presentation by dendritic cells (12).
Thus miRNAs as immune regulators may govern expression of genes relevant to allograft rejection, tolerance induction and posttransplant infection in recipients of organ transplants (8). Recent studies have demonstrated differential expression of miRNAs after clinical renal transplantation. In one study, 20 miRNAs were differentially expressed in acute rejection (AR) biopsies after renal transplantation (13). Suthanthiran’s group profiled the expression pattern of miRNAs in renal allograft biopsies, and demonstrated that miR-142–5p, miR-155 and miR-223 were highly predictive of AR and expression levels were strongly linked to intragraft expression of CD3 mRNA (14).
Because miRNAs are highly conserved in both structure and function across species (1), we used a mouse model of heart transplantation to profile miRNA expression post-transplant. MiRNAs, due to their stability in blood and central role in regulation of mRNA translation, may lead to novel biomarkers of graft status and new therapeutic targets to improve graft outcomes.
Materials and Methods
Animals and transplantation model
Eight- to 10-week-old C57BL/6 and BALB/c mice were purchased from Charles River Laboratories (Hollister, CA, USA). All experimental procedures were performed in accordance with a Stanford Institutional Animal Care and Use Committee approved protocol. Syngeneic (C57BL/6 → C57BL/6) and allogeneic (BALB/c → C57BL/6) heterotopic heart transplants were performed as described previously (15). Graft function was assessed through abdominal palpation and confirmed by histopathological analyses using hematoxylin and eosin (H&E) and Masson Trichrome staining.
Tissues collection and lymphocyte isolation
Heart grafts were collected from groups (n = 3–9) of transplanted animals on posttransplant days 1–7 and placed in RNAlater (Ambion, Foster City, CA, USA). Graft infiltrating lymphocytes (GILs) were isolated from allogeneic (n = 3–5) and syngeneic (n = 3–5) heart grafts on day 5 posttransplant. Briefly, grafts were perfused with phosphate buffered saline (PBS) before recovery, then the cardiac tissue was minced and placed in Roswell Park Memorial Institute (RPMI) 1640 containing collagenase (2 mg/mL), incubated at 37°C for 2 h and strained through a 70-μm nylon cell strainer. GILs were purified using Lympholyte (Cedarlane, Ontario, Canada) before RNA extraction as described previously (16). Peripheral blood lymphocytes (PBLs) were isolated from graft recipients using Lympholyte.
Global miRNA expression profiling
Total RNA was isolated using the mirVana miRNA isolation kit (Applied Biosystems, Foster City, CA, USA). Total RNA isolated from hearts of normal BALB/c mice (donor) and PBLs of normal C57BL/6 (recipient) mice were used as controls and calibrators for microarray data analysis. Three individual RNA samples from groups (n = 3) of transplanted or normal animals were pooled together (100 ng of each, 300 ng in total) for cDNA preparation using TaqMan miRNA reverse transcription kit and the corresponding Megaplex primer pools (Applied Biosystems). Preamplification of cDNA samples was performed with TaqMan PreAmp master mix and corresponding Megaplex PreAmp primers (Applied Biosystems). TaqMan array rodent miRNA A Card v2.0 containing 335 mature mouse miRNAs (Applied Biosystems) were used. Complete profiles from nine mice in each group were analyzed.
MiRNA array data analysis
Data were analyzed using SDS and RQ software (Applied Biosystems). Fold changes for each miRNA were normalized to the endogenous control snoRNA202. The expression fold changes were calculated using the 2−ΔΔCt method and compared to the relevant normal tissue. Hierarchical clustering analysis and heat maps were generated with MeV software using Pearson correlation metric and average linkage clustering (17). Student’s t-tests were performed to determine differentially expressed miRNAs. TargetScan (http://www.targetscan.org/mmu_50/) and PicTar (http://pictar.mdc-berlin.de/) were used to predict potential targets of miRNAs.
Quantification of miRNA
Tissues from additional groups (n = 3–5) of transplant recipients were used for qPCR confirmation. Total RNA was isolated as described earlier. Six miR-NAs of interest, differentially expressed posttransplant, were further quantitated by TaqMan miRNA assays (Applied Biosystems) and snoRNA202 and snoRNA135 were used as controls to normalize data.
Real-time PCR
To determine the expression of mouse forkhead box O1 (FOXO1), glyceraldehyde 3-phosphate dehydrogenase (GAPDH) and β-Actin, cDNA from groups (n = 3) of transplanted animals was synthesized using SuperScript II reverse transcriptase with random hexamers (Invitrogen, Carlsbad, CA, USA). Real-time PCR was performed using iQ SYBR Green Supermix (Bio-Rad, Hercules, CA, USA). The primers were as follows (forward and reverse primers): mouse FOXO1: 5′ TACGCCGACCTCATCACC 3′ and 5′ CACGCTCTTCACCATCCACT 3′; mouse GAPDH: 5′ CTTGGGCTACACTGAGGACC 3′ and 5′ CATACCAGGAAATGAGCTTGAC 3′; mouse β-Actin: 5′ CAGCCTTCCTTCTTGGGTAT 3′ and 5′ GGTCTTTACGGATGTCAACG 3′.
Mixed-lymphocyte reaction and inhibition of miR-182
C57BL/6 responder T cells were isolated from spleens using the mouse T-cell enrichment kit (Stemcell, Vancouver, BC, Canada), and labeled with 2 μM CFSE (Invitrogen). Splenocytes from BALB/c mice were inactivated with mitomycin C (40 μg/mL) were used as stimulators in the mixed-lymphocyte reaction (MLR). Stimulators (2.5 × 10⁵) and responders (5 × 10⁵) were cocultured in RPMI 1640 medium supplemented with 100 mg/mL penicillin/streptomycin, 2 mM L-glutamine, 5 × 10⁻⁵ M 2-mercaptoethanol (2-ME) and 10% fetal calf serum (FCS). In some experiments, 100 ng/mL cyclosporine A (CsA) was added at the start of the MLR. Inhibition of miR-182 expression was accomplished by transfecting responder T cells with the specific miRNA hairpin inhibitor miRIDIAN-182 (Dharmacon, Chicago, IL, USA) 24 h before initiation of MLR using X-tremeGENE 9 transfection reagent (Roche, Indianapolis, IN, USA). Additional miRIDIAN-182 (400 nM) was added into the medium on day 0. The T cells treated with miRIDIAN-N (Dharmacon), which does not target any known mouse miRNA, were used as a negative control. Lymphocyte proliferation was measured by CFSE and flow cytometry on days 1–5. Cells were collected and labeled with R-Phycoerythrin (R-PE)-conjugated rat anti-mouse CD4 mAb (BD Pharmigen, San Diego, CA, USA) or rat IgG2a isotype mAb (Invitrogen). 7-AAD (eBioscience, San Diego, CA, USA) was used for the exclusion of nonviable cells, and then analyzed on a FACScan flow cytometer (BD Biosciences, San Jose, CA, USA) using FlowJo software.
Construction of plasmids
The primary miR-182 sequence was amplified from mouse genomic DNA using the following primers (forward and reverse primers, underlined bases encode restriction enzyme site): 5′ GCTGGATCCCAAGTCCTTTTCACCG 3′ and 5′ GCCTCGAGGGCTTGAGGAGGTTTTACAC 3′. The cloned DNA fragment was inserted into the pcDNA3.1 vector, sequenced and termed pcDNA3.1-miR-182. The 3′ UTR fragment of Foxo1 containing a potential miR-182 binding site was cloned from mouse genomic DNA. The primers were as follows: P1 5′ CGCTCGAGTGACAGCAGGAACTGAGGA 3′ and P2 5′ CCGGTACCGGGTTCTGTGGCAAATGA 3′. The PCR products were inserted into the luciferase reporter plasmid phRL-TK-lkF (A gift from Dr. C. Z. Chen, Stanford University) and the resulting plasmid was termed phRL-TK-Foxo1. To further analyze the combination of Foxo1 and miR-182, the sequence of the binding site 5′ TGCCAAA 3′ was mutated to 5′ CTATCGT 3′ by PCR. Primers for mutation were as follows: P3 5′ AGACGATAGCTTCATTGTAATGATTCCCAA 3′ and P4 5′ AGCTATCGTCTCACTACACCATGTAATTGC 3′ (details are in Supporting Information [Figure S1]). The resulting plasmid was termed phRL-TK-mutFoxo1.
Luciferase assays
CHO cells were seeded at 105 cells per well 24 h before transfection. Cells were transfected using X-tremeGENE 9 transfection reagent (Roche) with 495 ng of pcDNA3.1-miR-182 or pcDNA3.1, 1 ng of phRL-TK-FOXO1 or phRL-TK-mutFOXO1 and 5 ng of firefly luciferase reporter plasmid (pGL3-control) was to normalize transfection efficiency. Luciferase activity was measured 48 h after transfection by the Dual-Luciferase Reporter Assay System (Promega, Madison, WI, USA).
Western blot
Protein was extracted from heart grafts (n = 3 at each time point) using Cell Extraction Buffer (Invitrogen) containing 1 mM phenylmethylsulfonyl fluoride (PMSF) and a protease inhibitor cocktail (Sigma, St. Louis, MO, USA). The following antibodies were used: rabbit anti-mouse FOXO1 mAb (clone C29H4, Cell Signaling Technology, Beverly, MA, USA), anti-β-Actin mAb (clone AC-15, Sigma), donkey anti-rabbit and donkey anti-mouse IgG antibodies (Jackson ImmunoResearch Laboratories, West Grove, PA, USA). Blots were developed with SuperSignal West Pico Substrate (Thermo Scientific, Rockford, IL, USA) and quantification was performed using ImageJ software (NIH, Bethesda, MD, USA).
Immunohistochemistry
Immunohistochemistry was performed to detect FOXO1 and CD3 expression in heart grafts (n = 3) as described previously (18). In brief, heart grafts were perfused with cold PBS, embedded in O.C.T. tissue frozen medium, sectioned and fixed with cold acetone. The sections were incubated with rabbit anti-mouse FOXO1 mAb and rat anti-mouse CD3 mAb (Clone 17A2, eBioscience) overnight at 4°C. Sections were rinsed, incubated for 2 h at RT with Alexa 488-conjugated goat anti-rabbit and Alexa 594-conjugated goat anti-rat mAb (Invitrogen), washed and mounted on glass slides using Vectashield mounting medium with 4′,6-diamidino-2-phenylindole (DAPI; Vector Laboratories, Burlingame, CA, USA). Representative pictures were photographed using a digital camera attached to a Zeiss LSM 510 META inverted laser scanning confocal microscope (Zeiss, Germany).
Plasma miRNA expression detection
MiRNAs were isolated from plasma of mice (n = 5) using a previously described method with some modifications (19). Mouse blood was collected and centrifuged at 1300 × g for 10 min at 4°C. Plasma was transferred to a fresh RNase/DNase-free tube without disturbing the pellet and then stored at −80°C. The pellet was resuspended with RPMI 1640 medium in 4 mL and PBLs isolated using Lympholyte. RNA was isolated from PBLs using the method described earlier Plasma RNA was extracted using mirVana miRNA isolation kit (Applied Biosystems). For plasma RNA isolation, 100 μL plasma was thawed on ice, 600 μL of lysis/binding solution was added and then 50 fmol of each synthesized spike-in miRNAs cel-miR-39 and cel-miR-54–5p were added to normalize sample-to-sample variation during RNA extraction.
Group numbers
Microarrays
Heart grafts (day 7) and GILs (day 5) were obtained, respectively, from allogeneic and syngeneic groups (n = 9 mice; 3 pools of 3 mice each).
Quantitation of miRNAs
Heart grafts (day 7) and GILs (day 5) were obtained, respectively, from other allogeneic and syngeneic groups (n = 3–5).
Kinetics of expression
Heart grafts (days 1, 3 and 5) were collected from allogeneic and syngeneic groups (n = 3). Heart graft samples were also used for FOXO1 expression detection in both mRNA and protein levels.
miR-182 expression in plasma and PBLs
Plasma and PBLs (day 7) were obtained from previous allogeneic and syngeneic groups (n = 5).
Results
Allograft rejection is associated with a unique signature of miRNAs
Differential expression of miRNAs after transplantation was determined in a mouse model of heart transplantation on day 7 posttransplant (GEO accession #GSE32545). H&E and Masson Trichrome staining were used to confirm graft rejection (Figure S2). Of the 335 mature mouse miRNAs examined, 212 miRNAs with Ct < 35 in all graft samples were included for further analysis. Unsupervised hierarchical clustering of miRNA expression patterns classified the allogeneic heart grafts distinctly from the syngeneic heart grafts (Figure 1A). Forty-two miRNAs were significantly increased and 32 significantly decreased in allogeneic heart grafts as compared to syngeneic heart grafts at p < 0.05 (Figure 1B). Of these 74 miRNAs, 38 miRNAs showed highly significant differential expression (p < 0.01, Table S1) including increased expression of miR-182, miR-183, miR-467a/b/c/d, miR-147, miR-7a and miR-10a, and decreased expression of miR-30b/c/e, miR-224, miR-322, miR-126–5p/3p, miR-208, miR-139–5p and miR-145. Moreover, some clustered miRNAs showed similar expression patterns posttransplant. For instance, all members of the miR-183-miR-96-miR-182 cluster were increased more than fivefold in allogeneic heart grafts as compared to syngeneic heart grafts. MiR-18a, miR-20a and miR-92a, members of miR-17-miR-92 cluster; and miR-467a/b/c/d and miR-669a, members of miR-467-miR-669 cluster, were also increased. In contrast, the expression of the miR-30c-miR-30e cluster and miR-497-miR-195 cluster were decreased in allogeneic heart grafts.
Figure 1. Unsupervised hierarchical clustering of miRNA expression patterns classified allogeneic from syngeneic heart grafts.

Each column corresponds to the expression profile of three pooled syngeneic or allogeneic heart grafts on day 7 posttransplant. The color of each cell reflects the fold-change of expression level of the corresponding miRNA in the corresponding sample relative to the average expression level across all samples. Green represents a decrease in expression level, whereas red represents an increase. The scale (bottom right) reflects miRNA abundance ratio in a given sample relative to the mean level for all samples. (A) Unsupervised hierarchical clustering of overall miRNAs expression in heart grafts. (B) Unsupervised hierarchical clustering of the miRNAs with differential expression at p < 0.05 in heart grafts.
MiRNAs expression in graft infiltrating lymphocytes
To specifically examine the miRNAs expressed by cells of the immune system posttransplant, we profiled the miR-NAs from GILs isolated from allogeneic and syngeneic heart grafts on day 5 posttransplant. This time point was chosen for analysis because previous experiments demonstrated that heart grafts begin to lose function by day 7 posttransplant due to severe rejection. We obtained 0.5–2 × 10⁵ lymphocytes from each heart graft for RNA preparation and miRNA microarray analysis. Of the 335 mature mouse miRNAs examined a total of 152 miRNAs that had Ct < 35 in all samples were included for further analysis. Unsupervised hierarchical clustering of miRNA expression patterns appropriately classified allogeneic and syngeneic samples (Figure 2A). Forty-four miRNAs were significantly differentially expressed in allogeneic GILs (p < 0.05) as compared to syngeneic GILs (Figure 2B). Seventeen miR-NAs had increased expression (p < 0.01, Table S1), including miR-155, miR-182, miR-449a, 7a/b, miR-17, miR-130b and miR-20b. Of note, clustered miRNAs miR-182 and miR-183, and all members of miR-17-miR-92 cluster, were increased in allogeneic GILs. Overall, 16 miRNAs showed significant differential expression (p < 0.05) in both allogeneic heart grafts and GILs as compared to syngeneic groups (Figure 3) suggesting that these miRNAs are important in the alloimmune response after transplantation.
Figure 2. Unsupervised hierarchical clustering of miRNA expression patterns classified allogeneic GILs from syngeneic GILs.

Each column corresponds to the expression profile of three pooled allogeneic or syngeneic GILs on day 5 posttransplant. The color of each cell reflects fold-change of expression level of the corresponding miRNA in the corresponding sample relative to the average expression level across all samples. (A) Unsupervised hierarchical clustering of overall miRNAs expression in GILs. (B) Unsupervised hierarchical clustering of the miRNAs with differential expression at p < 0.05 in GILs.
Figure 3. Comparison of miRNA expression in heart allografts and GILs.
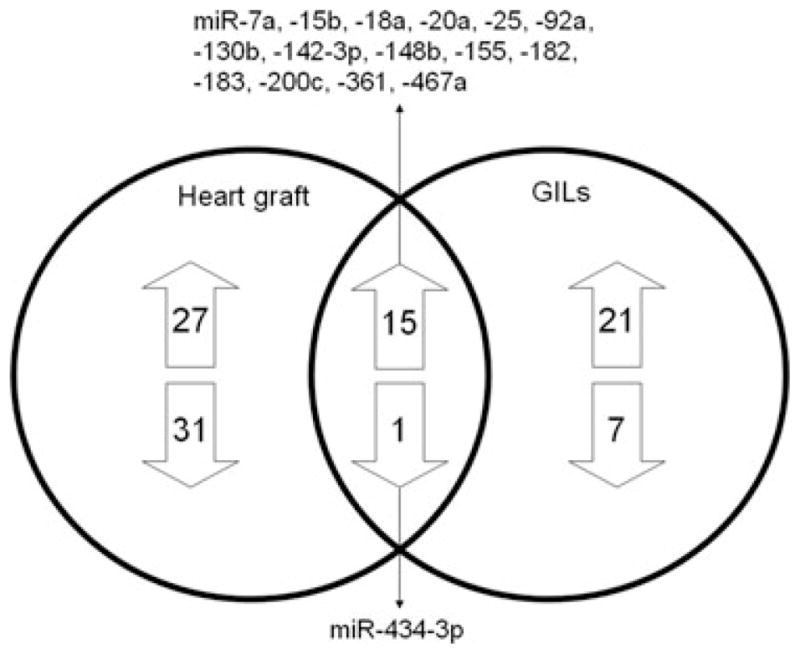
The Venn diagram shows the number and the specific miRNAs differentially expressed, and the 16 miRNAs shared, in heart allografts and GILs.
We selected 6 miRNAs from the 16 miRNAs that were expressed in both rejecting heart grafts and GILs for further validation using heart grafts (Figure 4A)and GILs (Figure 4B) from other groups of recipients. In agreement with the microarray data, miR-7a, miR-155, miR-182 and miR-183 were significantly increased (p < 0.05) and miR-434–3p was significantly decreased (p < 0.01) in both allogeneic heart grafts and GILs as compared to syngeneic groups posttransplant. However, miR-20a expression was significantly increased in the graft (Figure 4A) but not the GILs (Figure 4B). Taken together, our results define a profile of miRNAs in both the rejecting heart and infiltrating lymphocytes during allograft rejection and identify miRNAs that may have a functional role in the immune response during rejection.
Figure 4. Quantitation of miRNAs in heart grafts and GILs.

Six miRNAs found to be differentially expressed between the syngeneic and allogeneic groups in both heart grafts and GILs were quantitated by TaqMan miRNA assays using heart grafts and GILs from other groups of transplant recipients (n = 3–5). Expression fold changes of miRNAs were calculated by 2−ΔΔCt method, normalized to the expression of housekeeping gene snoRNA202 and compared to a normal heart of BALB/c mouse or normal PBLs of C57BL/6 mouse. Another housekeeping gene snoRNA135 showed stable expression. The p values were calculated by student t-test; error bars represent SEM. (A) Expression fold changes of miRNAs in syngeneic and allogeneic heart grafts on day 7 posttransplant. (B) Expression fold changes of miRNAs in syngeneic and allogeneic GILs on day 5 posttransplant.
MiR-182 and miR-183 expression is increased in response to alloantigen
Both miR-182 and miR-183 were significantly increased in allogeneic GILs. Thus, to further understand the importance of these miRNAs in the alloimmune response, a one-way MLR was used to determine their expression during T-cell proliferation. Expression of both miR-182 and miR-183 increased between day 2 and day 3 in the MLR and reached peak expression on day 5 (Figures 5A and B, solid lines). Maximal expression of miR-182 and miR-183 coincided with maximal proliferation on day 5 (Figure 5C, solid lines). Expression of the other member of the miR-183-miR-96-miR-182 cluster, miR-96, could not be detected in T cells. Treatment with the calcineurin inhibitor CsA (Figures 5A and B, dashed lines) markedly decreased the expression of miR-182 and miR-183 in T cells, whereas the expression of the housekeeping gene snoRNA135 remained stable (Figure 5D). These results indicate that miR-182 and miR-183 expression may be induced in response to alloimmune responses and correlate with T-cell proliferation.
Figure 5. Mir-182 and mir-183 expression correlate with T-cell proliferation.

Responders from C57BL/6 mice and stimulators from BALB/c mice were cocultured at a ratio of 2:1 in a one-way MLR. In the CsA treatment group, CsA (100 ng/mL) was added at the start of the MLR. Expression fold change of (A) miR-182 and (B) miR-183 were normalized to the expression of the housekeeping gene snoRNA202 and compared to the miRNAs expression on day 1 of MLR. Error bars represent SEM of triplicate wells. (C) Proliferation was measured by CFSE using flow cytometry. (D) Expression of the housekeeping gene snoRNA135. Data shown is representative of three independent experiments.
The miR-183-miR-96-miR-182 cluster is increased posttransplant
We further analyzed the kinetics of expression of miR-183-miR-96-miR-182 miRNA cluster in vivo in heart grafts. There were no significant differences in miR-183-miR-96-miR-182 expression between the allogeneic and syngeneic groups in the first 3 days posttransplant (Figure 6). Whereas miR-182 and miR-183 expression increased in both syngeneic and allogeneic heart grafts on day 5 post-transplant, their expression in allogeneic heart grafts was significantly higher than syngeneic grafts. MiR-96 expression was only moderately increased on day 5. The housekeeping gene snoRNA135 showed stable expression in both groups during rejection (Figure 6). Thus both miR-182 and miR-183 increased in grafts posttransplant, with significantly elevated expression in allografts.
Figure 6. Kinetics of expression of the miR-183-miR-96-miR-182 miRNA cluster in vivo.

Syngeneic and allogeneic heart grafts (n = 3) were collected on days 1, 3 and 5 posttransplant for the detection of miRNAs. Expression fold changes were normalized to the expression of the housekeeping gene snoRNA202 and compared to the miRNAs expression of a normal heart of the donor BALB/c mouse. Error bars represent SEM; asterisk (*) represents p < 0.05 between syngeneic and allogeneic groups calculated by Student’s t-test.
FOXO1 expression is decreased in heart grafts during rejection
In humans, Foxo1 has been identified as a target of hsa-miR-182 (20). To determine if Foxo1 is a target of miR-182 in the mouse, we constructed a plasmid that overexpresses mmu-miR-182 in CHO cells (Figure 7A) and we examined binding of mouse miR-182 to the 3′ UTR of mouse Foxo1 mRNA using a luciferase assay. As the 3′ UTR of FOXO1 is inserted downstream of the luciferase ORF, specific binding to miR-182 prevents luciferase reporter gene expression (Figure 7B, white bar); however, mutation of the Foxo1 binding site decreases specific binding to miR-182 and restores luciferase activity (Figure 7B, gray bar) indicating that mouse Foxo1 is a target of miR-182.
Figure 7. FOXO1 is a target of miR-182 in the mouse.

(A) CHO cells were transfected with the pcDNA3.1-miR-182 plasmid that overexpresses the mature mmu-miR-182. (B) The 3′ UTR of mouse Foxo1, including the putative miRNA target site, was inserted downstream of a luciferase ORF in the phRL-TK-Foxo1 plasmid. A construct containing a mutated sequence of the miRNA binding site, phRL-TK-mutFoxo1, was produced as a control. The different luciferase constructs were transfected into CHO cells with the construct pcDNA3.1-miR-182 that overexpresses the mature mmu-miR-182 or with the blank vector pcDNA-3.1. Luciferase activity was measured 48 h after transfection by the Dual-Luciferase Reporter Assay System. Data shown are representative of three independent experiments.
We next examined Foxo1 expression at both the mRNA and protein levels in heart grafts. Whereas there was no significant difference in Foxo1 mRNA levels at any time-point (Figure 8A), there was a dramatic decrease in the FOXO1 protein on day 5 posttransplant specifically in allogeneic heart grafts. The housekeeping gene, β-Actin demonstrated stable expression in both syngeneic and allogeneic groups at all timepoints (Figure 8B). These data indicate that during rejection there is a posttranscriptional decrease in FOXO1 expression.
Figure 8. FOXO1 protein levels, but not mRNA levels, decrease in heart grafts during rejection.

RNA and protein were extracted from syngeneic and allogeneic heart grafts on days 1, 3 and 5 posttransplant (n = 3). (A) Real-time PCR of Foxo1. Data were normalized to GAPDH expression and compared to a normal heart of BALB/c mouse. Data shown is representative of two independent experiments. (B) Western blot and densitometry results of FOXO1 in allogeneic and syngeneic groups. Data shown is representative of three independent experiments.
To determine specifically which cells in heart grafts were expressing FOXO1, sections of graft tissue were analyzed by immunofluorescence on day 5 posttransplant. FOXO1 is clearly detected in the cardiomyocytes in syngeneic grafts but is substantially decreased in the cardiomyocytes of allogeneic grafts (Figure 9). The numbers of CD3+ T cells in syngeneic heart graft is small, however expression of FOXO1 was detected in some CD3+ T cells. Although there is a marked infiltration of CD3+ T cells in allogeneic heart grafts, FOXO1 expression was absent. Thus, there is a concomitant increase in miR-182 expression and a post-transcriptional decrease in FOXO1 in both cardiomyocytes and CD3+ T cells posttransplant.
Figure 9. FOXO1 expression decreases in cardiomyocytes and GILs in rejecting allograft.

Heart grafts were collected on day 5 posttransplant, embedded in O.C.T. tissue medium, sectioned and fixed. The sections were stained with rabbit anti-mouse FOXO1 mAb (green), rat anti-mouse CD3 mAb (red) and DAPI (blue). Representative sections using the same settings for both syngeneic, n = 3 and allogeneic, n = 3 (original magnification is 63×; zoomed magnification is 189$*$ are shown.
MiR-182 is detected in the circulation during rejection
To determine whether miR-182 is expressed in the circulation posttransplant, PBLs and plasma were analyzed for miR-182 expression. MiR-182 was significantly increased in both the PBLs and plasma in the allogeneic group as compared to syngeneic and normal mouse groups (Figure 10 top) whereas there was no change in the housekeeping genes (Figure 10 bottom). These data indicate that miR-182 expression is specifically expressed in the circulation of graft recipients and suggest that because miRNAs are incredibly stable in blood, they will be important as biomarkers of graft status.
Figure 10. Mir-182 is increased in the circulation during rejection.

MiR-182 expression was increased in (A) PBLs and (B) plasma of recipients of allograft during rejection. PBLs and plasma were collected from syngeneic (n = 5) and allogeneic (n = 5) graft recipients on day 7 posttransplant and normal C57BL/6 mice (n = 5). For miRNA expression in PBLs, data were normalized to snoRNA202 expression, and compared to normal PBLs of C57BL/6 mouse. For miRNA expression in plasma, data were normalized to the expression of spike-in miRNA, cel-miR-39 expression and compared to a normal plasma of C57BL/6 mouse.
Discussion
In this study, we established the profile of miRNAs expression in graft rejection using a murine model of heart transplantation. MiRNAs are differentially expressed between allogeneic and syngeneic heart grafts suggesting potentially important regulatory functions in graft rejection. Importantly, a dominantly expressed member of the miR-183-miR-182-miR-96 cluster, miR-182, was dramatically increased during rejection and specifically detected in the circulation of allograft recipients. Further, our results suggest that miR-182 posttranscriptionally inhibits FOXO1 expression in allogeneic heart grafts during rejection.
The miR-183-miR-96-miR-182 cluster is located on mouse chromosome 6 and human chromosome 7. Genomic organization of this miRNA cluster is highly conserved in all vertebrates indicating similar biological functions of this miRNA cluster across species (21,22).
FOXO1 acts as a master cellular regulator of a variety of cellular processes including cell survival, apoptosis, proliferation and metabolism. It also plays a critical role in the homeostasis of cells of the immune system including T cells, B cells and neutrophils (23). Although it has been shown that miR-9, miR-27, miR-96, miR-153, miR-182, miR-183 can all bind to FOXO1 mRNA in human endometrial cancer cell lines (24), our data demonstrated that the expression of miR-9, miR-27 and miR-153 were not different between allogeneic and syngeneic groups during rejection. Herein, we showed that miR-182 specifically binds to the 3′ UTR of Foxo1 mRNA in the mouse and although we detected no difference in the Foxo1 mRNA level between allogeneic and syngeneic heart grafts posttransplant, a significant decrease in FOXO1 protein levels was seen in allogeneic heart grafts posttransplant. This suggests a translational inhibition of FOXO1 protein by miR-182. Our results may indicate a novel method of FOXO1 function regulation via miR-182-mediated translational inhibition in addition to the other posttranslational modifications of FOXO1 that include phosphorylation, acetylation and ubiquitylation (23). We show that miR-182 expression was increased in both heart grafts and GILs, suggesting that regulation of miR-182 and targeting of FOXO1 may lead to different biological functions in different cell types posttransplant.
As it has been shown that the absence of FOXO1 severely curtailed the development of FOXP3+ regulatory T (Treg) cells and those Tregs that developed were nonfunctional in vivo (25), our findings may have important implications in the induction of transplant tolerance. Moreover, downregulation of FOXO1 in T cells results in lymphocyte infiltration (25). In addition, numerous reports implicate FOXO1 function in cardiomyoctes, including attenuating calcineurin phosphatase activity and inhibiting agonist-induced hypertrophic growth (26). Further, downregulation of FOXO1 leads to cardiac hypertrophy, a ubiquitous complication after heart transplantation (27). Clearly, further research is needed to determine the biological implication of miR-182 targeting of FOXO1 posttransplant.
Our profile data suggests other interesting miRNAs that may be important in transplantation. However, we examined just 335 mature miRNAs, less than half of all the known miRNAs. The direct sequencing of tissues may elucidate other miRNAs important in graft rejection. We compared the miRNAs profile in mouse heart grafts during unmodified rejection in the absence of immunosuppression with the miRNAs detected in the published study of rejecting human renal allografts (Ref. 14; Table S2). Eighteen miRNAs were either increased or decreased in both studies including miR-155 and miR-21 supporting that these miRNAs may also be important in immune responses post-transplant.
Previous studies suggest that miR-182 can be induced by IL-2 to promote clonal expansion of activated helper T lymphocytes (28). Our data indicates that miR-182 expression is increased significantly in GILs and PBLs during rejection and in response to alloantigen in MLR. Indeed we show that CsA inhibits both miR-182 and miR-183 expression supporting a correlation with IL-2 production. However, when miR-182 expression was specifically inhibited during MLR, no obvious changes were observed in proliferation of T cells or CD4+ T cells from day 1 to 5 (Figure S3). Thus at least in MLR, partial inhibition (>60%) of miR-182 is not sufficient to inhibit T-cell proliferation.
It has been reported that the miR-183-miR-96-miR-182 cluster is increased early after ischemic preconditioning in brain, and miR-182 expression correlates with hypoxia inducible factor-1alpha (HIF-1alpha) expression (29). Ischemia/reperfusion (I/R) injury, which inevitably occurs during solid organ transplantation, is an important nonimmune factor influencing long-term graft survival (30). As expression of HIF-1alpha in grafts is an important mechanism in response to I/R injury (31), suggesting that miR-182 expression may be important in graft function following ischemia. Thus, both immune and nonimmune factors may contribute to increased miR-182 expression posttransplant.
Noninvasive biomarkers for early detection of graft rejection would clearly improve graft outcomes. Because miR-NAs are present in plasma in a stable form that is protected from endogenous RNAse activity (19), detection of miR-NAs, specifically miR-182, holds promise as a biomarker to reflect graft status. The ability to quickly isolate miRNA from plasma could lead to new diagnostic approaches to detect graft rejection and supports the examination of patient materials. Additional studies focused on establishing the functional importance on miR-182 and other miRNAs will provide new insights into alloreactivity and result in novel therapeutics for transplant recipients.
Supplementary Material
The original binding site for miR-182 (5′ TGCCAAA 3′) was mutated to 5′ CTATCGT 3′. Primers P3 and P4 have an overlapped region which containing the mutation sequence. DNA fragments amplified by P1 and P3, or P2 and P4 were used as template for second round PCR amplified by P1 and P2. The resulting PCR product contained the mutated binding site.
Differential expression of microRNAs in heart grafts and GILs.
Comparison of the miRNAs profile in mouse heart grafts during rejection with the miRNAs detected in rejecting human renal allografts. The miRNAs expression data of human renal allografts were obtained from a published study (Ref. 14).
Sections of syngeneic (top) and allogeneic (bottom) heart grafts on day 7 posttransplant were stained by H&E (left) and Masson Trichrome (right). H&E staining shows that lymphocytes infiltrated into allogeneic heart grafts. Masson Trichrome staining shows a necrotic cardiomyocytes. The signs of acute rejection were clearly exhibited in these hearts.
Cells were collected on days 1–5 during MLR, the results of day 1–4 were not shown. (A) MiR-182 expression was specifically inhibited (62% inhibition) by miRIDIAN-182 on day 5. (B) MiR-182 inhibition has no effect on proliferation of T cells or CD4+ T cells on day 5 in MLR.
Acknowledgments
The authors thank Dr. C. Z. Chen and Chris Arnold for providing the phRL-TK-lkF and pGL3-control plasmids and for helpful discussions. We would like to thank Betty Pham and Karine Piard-Ruster for their technical expertise.
Abbreviations
- AR
acute rejection
- CsA
cyclosporine A
- FOXO1
forkhead box O1
- GILs
graft infiltrating lymphocytes
- H&E staining
hematoxylin and eosin staining
- I/R
ischemia/reperfusion
- miRNA
microRNA
- MLR
mixed-lymphocyte reaction
- PBLs
peripheral blood lymphocytes
- UTR
untranslated region
Footnotes
Disclosure
The authors of this manuscript have no conflicts of interest to disclose as described by the American Journal of Transplantation.
References
- 1.Bartel DP. MicroRNAs: Genomics, biogenesis, mechanism, and function. Cell. 2004;116:281–297. doi: 10.1016/s0092-8674(04)00045-5. [DOI] [PubMed] [Google Scholar]
- 2.Kim VN, Nam JW. Genomics of microRNA. Trends Genet. 2006;22:165–173. doi: 10.1016/j.tig.2006.01.003. [DOI] [PubMed] [Google Scholar]
- 3.Bentwich I, Avniel A, Karov Y, et al. Identification of hundreds of conserved and nonconserved human microRNAs. Nat Genet. 2005;37:766–770. doi: 10.1038/ng1590. [DOI] [PubMed] [Google Scholar]
- 4.Friedman RC, Farh KK, Burge CB, Bartel DP. Most mammalian mRNAs are conserved targets of microRNAs. Genome Res. 2009;19:92–105. doi: 10.1101/gr.082701.108. [DOI] [PMC free article] [PubMed] [Google Scholar]
- 5.He L, Hannon GJ. MicroRNAs: Small RNAs with a big role in gene regulation. Nat Rev Genet. 2004;5:522–531. doi: 10.1038/nrg1379. [DOI] [PubMed] [Google Scholar]
- 6.Meltzer PS. Cancer genomics: Small RNAs with big impacts. Nature. 2005;435:745–746. doi: 10.1038/435745a. [DOI] [PubMed] [Google Scholar]
- 7.Chen CZ, Li L, Lodish HF, Bartel DP. MicroRNAs modulate hematopoietic lineage differentiation. Science. 2004;303:83–86. doi: 10.1126/science.1091903. [DOI] [PubMed] [Google Scholar]
- 8.Harris A, Krams SM, Martinez OM. MicroRNAs as immune regulators: Implications for transplantation. Am J Transplant. 2010;10:713–719. doi: 10.1111/j.1600-6143.2010.03032.x. [DOI] [PMC free article] [PubMed] [Google Scholar]
- 9.Lindsay MA. microRNAs and the immune response. Trends Immunol. 2008;29:343–351. doi: 10.1016/j.it.2008.04.004. [DOI] [PubMed] [Google Scholar]
- 10.Li QJ, Chau J, Ebert PJ, et al. mir-181a is an intrinsic modulator of T cell sensitivity and selection. Cell. 2007;129:147–161. doi: 10.1016/j.cell.2007.03.008. [DOI] [PubMed] [Google Scholar]
- 11.Ebert PJ, Jiang S, Xie J, Li QJ, Davis MM. An endogenous positively selecting peptide enhances mature T cell responses and becomes an autoantigen in the absence of microRNA miR-181a. Nat Immunol. 2009;10:1162–1169. doi: 10.1038/ni.1797. [DOI] [PMC free article] [PubMed] [Google Scholar]
- 12.Rodriguez A, Vigorito E, Clare S, et al. Requirement of bic/microRNA-155 for normal immune function. Science. 2007;316:608–611. doi: 10.1126/science.1139253. [DOI] [PMC free article] [PubMed] [Google Scholar]
- 13.Sui W, Dai Y, Huang Y, Lan H, Yan Q, Huang H. Microarray analysis of MicroRNA expression in acute rejection after renal transplantation. Transpl Immunol. 2008;19:81–85. doi: 10.1016/j.trim.2008.01.007. [DOI] [PubMed] [Google Scholar]
- 14.Anglicheau D, Sharma VK, Ding R, et al. MicroRNA expression profiles predictive of human renal allograft status. Proc Natl Acad Sci U S A. 2009;106:5330–5. doi: 10.1073/pnas.0813121106. [DOI] [PMC free article] [PubMed] [Google Scholar]
- 15.Corry RJ, Winn HJ, Russell P. Primarily vascularized allografts of hearts in mice: The role of H-2D, H-2K, and non-H-2 antigens in rejection. Transplantation. 1973;16:343–350. doi: 10.1097/00007890-197310000-00010. [DOI] [PubMed] [Google Scholar]
- 16.Stinn JL, Taylor MK, Becker G, et al. Interferon-gamma-secreting T-cell populations in rejecting murine cardiac allografts: Assessment by flow cytometry. Am J Pathol. 1998;153:1383–1392. doi: 10.1016/s0002-9440(10)65725-2. [DOI] [PMC free article] [PubMed] [Google Scholar]
- 17.Saeed AI, Sharov V, White J, et al. TM4: A free, open-source system for microarray data management and analysis. Biotechniques. 2003;34:374–378. doi: 10.2144/03342mt01. [DOI] [PubMed] [Google Scholar]
- 18.Xiong X, Barreto GE, Xu L, Ouyang YB, Xie X, Giffard RG. Increased brain injury and worsened neurological outcome in interleukin-4 knockout mice after transient focal cerebral ischemia. Stroke. 2011;42:2026–2032. doi: 10.1161/STROKEAHA.110.593772. [DOI] [PMC free article] [PubMed] [Google Scholar]
- 19.Mitchell PS, Parkin RK, Kroh EM, et al. Circulating microRNAs as stable blood-based markers for cancer detection. Proc Natl Acad Sci U S A. 2008;105:10513–10518. doi: 10.1073/pnas.0804549105. [DOI] [PMC free article] [PubMed] [Google Scholar]
- 20.Guttilla IK, White BA. Coordinate regulation of FOXO1 by miR-27a, miR-96, and miR-182 in breast cancer cells. J Biol Chem. 2009;284:23204–23216. doi: 10.1074/jbc.M109.031427. [DOI] [PMC free article] [PubMed] [Google Scholar]
- 21.Tanzer A, Stadler PF. Molecular evolution of a microRNA cluster. J Mol Biol. 2004;339:327–335. doi: 10.1016/j.jmb.2004.03.065. [DOI] [PubMed] [Google Scholar]
- 22.Yao E, Ventura A. A new role for miR-182 in DNA repair. Mol Cell. 2011;41:135–137. doi: 10.1016/j.molcel.2011.01.005. [DOI] [PubMed] [Google Scholar]
- 23.Peng SL. Foxo in the immune system. Oncogene. 2008;27:2337–2344. doi: 10.1038/onc.2008.26. [DOI] [PubMed] [Google Scholar]
- 24.Myatt SS, Wang J, Monteiro LJ, et al. Definition of microRNAs that repress expression of the tumor suppressor gene FOXO1 in endometrial cancer. Cancer Res. 2010;70:367–377. doi: 10.1158/0008-5472.CAN-09-1891. [DOI] [PMC free article] [PubMed] [Google Scholar]
- 25.Kerdiles YM, Stone EL, Beisner DR, et al. Foxo transcription factors control regulatory T cell development and function. Immunity. 2010;33:890–904. doi: 10.1016/j.immuni.2010.12.002. [DOI] [PMC free article] [PubMed] [Google Scholar]
- 26.Ni YG, Berenji K, Wang N, et al. Foxo transcription factors blunt cardiac hypertrophy by inhibiting calcineurin signaling. Circulation. 2006;114:1159–1168. doi: 10.1161/CIRCULATIONAHA.106.637124. [DOI] [PMC free article] [PubMed] [Google Scholar]
- 27.Ho YL, Chen CL, Hsu RB, et al. Assessment of the myocardial changes in heart transplant recipients without evident acute myocardial rejection by integrated backscatter: Comparison with simultaneous dobutamine stress echocardiography and (201)thallium spect. Ultrasound Med Biol. 2001;27:171–179. doi: 10.1016/s0301-5629(00)00320-3. [DOI] [PubMed] [Google Scholar]
- 28.Stittrich AB, Haftmann C, Sgouroudis E, et al. The microRNA miR-182 is induced by IL-2 and promotes clonal expansion of activated helper T lymphocytes. Nat Immunol. 2010;11:1057–1062. doi: 10.1038/ni.1945. [DOI] [PubMed] [Google Scholar]
- 29.Lee ST, Chu K, Jung KH, et al. MicroRNAs induced during ischemic preconditioning. Stroke. 2010;41:1646–1651. doi: 10.1161/STROKEAHA.110.579649. [DOI] [PubMed] [Google Scholar]
- 30.Feng L, Zhao N, Yao X, et al. Histidine-tryptophan-ketoglutarate solution vs. University of Wisconsin solution for liver transplantation: A systematic review. Liver Transpl. 2007;13:1125–1136. doi: 10.1002/lt.21208. [DOI] [PubMed] [Google Scholar]
- 31.Wei L, Lu J, Feng L, et al. HIF-1alpha accumulation upregulates MICA and MICB expression on human cardiomyocytes and enhances NK cell cytotoxicity during hypoxia-reoxygenation. Life Sci. 2010;87:111–119. doi: 10.1016/j.lfs.2010.05.012. [DOI] [PubMed] [Google Scholar]
Associated Data
This section collects any data citations, data availability statements, or supplementary materials included in this article.
Supplementary Materials
The original binding site for miR-182 (5′ TGCCAAA 3′) was mutated to 5′ CTATCGT 3′. Primers P3 and P4 have an overlapped region which containing the mutation sequence. DNA fragments amplified by P1 and P3, or P2 and P4 were used as template for second round PCR amplified by P1 and P2. The resulting PCR product contained the mutated binding site.
Differential expression of microRNAs in heart grafts and GILs.
Comparison of the miRNAs profile in mouse heart grafts during rejection with the miRNAs detected in rejecting human renal allografts. The miRNAs expression data of human renal allografts were obtained from a published study (Ref. 14).
Sections of syngeneic (top) and allogeneic (bottom) heart grafts on day 7 posttransplant were stained by H&E (left) and Masson Trichrome (right). H&E staining shows that lymphocytes infiltrated into allogeneic heart grafts. Masson Trichrome staining shows a necrotic cardiomyocytes. The signs of acute rejection were clearly exhibited in these hearts.
Cells were collected on days 1–5 during MLR, the results of day 1–4 were not shown. (A) MiR-182 expression was specifically inhibited (62% inhibition) by miRIDIAN-182 on day 5. (B) MiR-182 inhibition has no effect on proliferation of T cells or CD4+ T cells on day 5 in MLR.