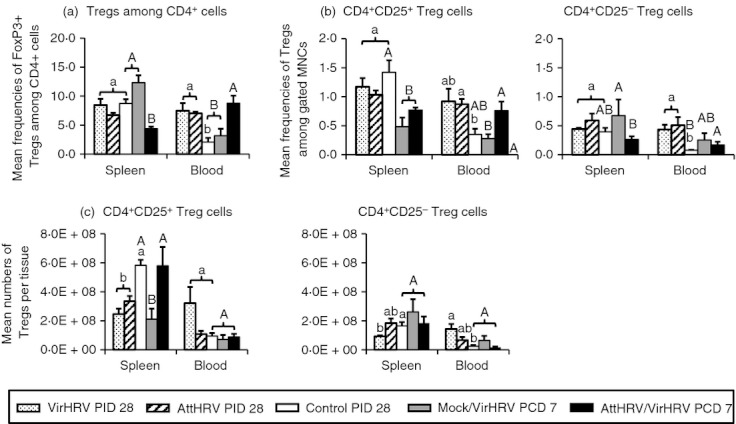
Figure 3.

Frequencies of FoxP3+ regulatory T (Treg) cells among CD4+ cells (a), CD4+ CD25+ and CD4+ CD25− Treg cells among mononuclear cells (MNC) (b), and numbers of CD4+ CD25+ and CD4+ CD25− Treg cells per tissue (c) in spleen and blood of gnotobiotic (Gn) pigs. See Fig. 2 legend for panel description and statistical analysis.
