

The structure of the complex of CCM1/KRIT1 and HEG1 defines a new mode of membrane protein anchorage important for cell–cell junctions and cardiovascular development.
Abstract
The products of genes that cause cerebral cavernous malformations (CCM1/KRIT1, CCM2, and CCM3) physically interact. CCM1/KRIT1 links this complex to endothelial cell (EC) junctions and maintains junctional integrity in part by inhibiting RhoA. Heart of glass (HEG1), a transmembrane protein, associates with KRIT1. In this paper, we show that the KRIT1 band 4.1, ezrin, radixin, and moesin (FERM) domain bound the HEG1 C terminus (Kd = 1.2 µM) and solved the structure of this assembly. The KRIT1 F1 and F3 subdomain interface formed a hydrophobic groove that binds HEG1(Tyr1,380-Phe1,381), thus defining a new mode of FERM domain–membrane protein interaction. This structure enabled design of KRIT1(L717,721A), which exhibited a >100-fold reduction in HEG1 affinity. Although well folded and expressed, KRIT1(L717,721A) failed to target to EC junctions or complement the effects of KRIT1 depletion on zebrafish cardiovascular development or Rho kinase activation in EC. These data establish that this novel FERM–membrane protein interaction anchors CCM1/KRIT1 at EC junctions to support cardiovascular development.
Introduction
Cerebral cavernous malformation (CCM) is a common cerebrovascular anomaly, affecting ∼1 in 200 individuals and predisposing patients to a lifetime risk of seizures, hemorrhagic stoke, and other neurological deficits (Leblanc et al., 2009; Faurobert and Albiges-Rizo, 2010). Heterozygous loss of KRIT1 (also known as CCM1) causes a familial form of CCM (Laberge-le Couteulx et al., 1999; Sahoo et al., 1999), characterized by the development of multiple vascular dysplasias within the brain but also in the spinal cord, retina, and skin (Leblanc et al., 2009; Faurobert and Albiges-Rizo, 2010). A similar disease is associated with heterozygosity for loss of function of CCM2 or CCM3, and these three proteins interact with each other (Leblanc et al., 2009; Faurobert and Albiges-Rizo, 2010). CCM lesions typically arise in adulthood and consist of beds of dilated capillary vessels with little intervening brain tissue. There is a reduction in endothelial cell (EC)–cell adhesion within lesions but not in the surrounding normal brain tissue (Leblanc et al., 2009; Faurobert and Albiges-Rizo, 2010). Loss of KRIT1 leads to defects in EC junctional integrity (Glading et al., 2007) associated with increased RhoA activity (Stockton et al., 2010) and apicobasal polarity (Lampugnani et al., 2010), and loss of CCM1 similarly disrupts EC–cell junctions (Glading and Ginsberg, 2010). Inhibiting the Rho effector, Rho kinase, reverses the effect of KRIT1 silencing on EC junctions (Stockton et al., 2010) and slows the development and progression of CCMs in a murine model of the human disease (McDonald et al., 2012).
In mice, deletion of Krit1 leads to early embryonic lethality (approximately embryonic day 10 [E10]) caused by gross defects in multiple vascular beds (Whitehead et al., 2004). Endothelial-specific deletion of Krit1 early in life produces hemorrhagic vascular lesions in the cerebellum and retina that resemble CCMs (Boulday et al., 2011). Combined with the more global effect of the constitutive deletion, these data suggest that KRIT1 functions in multiple endothelial beds but at only specific developmental times. Constitutive global or endothelial-specific deletion of CCM2 produces virtually identical phenotypes to those of KRIT1 (Kleaveland et al., 2009; Whitehead et al., 2009). Similarly, in zebrafish, loss of krit1, ccm2, or heg (heart of glass) function leads to aberrant vascular morphogenesis (Hogan et al., 2008) and cardiac dilatation (Mably et al., 2003, 2006), and the vascular phenotypes in HEG1- and KRIT1-deficient mice are similar (Kleaveland et al., 2009). Therefore, KRIT1, CCM2, and HEG1 interact physically and genetically and play major roles in regulating vascular development and integrity.
KRIT1 contains a C-terminal band 4.1, ezrin, radixin, and moesin (FERM) domain and a series of N-terminal ankyrin repeats (Sahoo et al., 2001). FERM domains are comprised of F1, F2, and F3 subdomains (Fehon et al., 2010). KRIT1 FERM domain localizes KRIT1 to EC–cell junctions (Glading et al., 2007), and KRIT1 is required for the junctional localization of its binding partner, CCM2 (Stockton et al., 2010). KRIT1 F1 subdomain binds Rap1 in a GTP-dependent manner, and KRIT1–Rap1 interaction is important for KRIT1 localization in EC junctions and KRIT1 function (Liu et al., 2011). KRIT1 FERM F3 subdomain is predicted to comprise a phosphotyrosine-binding (PTB) domain. Many proteins bind to membrane proteins via their FERM domains. In cases in which structural data are available, the membrane protein cytoplasmic domain interacts with the F3 subdomain (Calderwood, 2004; Fehon et al., 2010). Here, we use protein crystallography to determine the structural basis of the KRIT1–HEG1 interaction. Surprisingly, the interaction differed from well-characterized FERM domain–membrane protein interactions (Calderwood, 2004; Anthis et al., 2009; Fehon et al., 2010) in which the F3 subdomain alone provides a binding site. Instead, the HEG1 binding interface was localized in a hydrophobic groove between the F1 and F3 subdomains of KRIT1. The biochemical relevance of this structure was validated by structure-based mutants of HEG1 or KRIT1 that disrupted their interaction; the biological relevance of the interaction was established by showing that KRIT1 mutants with reduced binding to HEG1, failed to localize to EC–cell junctions, and did not support cardiovascular development in zebrafish. These data reveal the structural basis of anchoring of KRIT1, the central scaffold of the CCM complex, to cell–cell junctions via HEG1, and establish the biological importance of this new form of FERM domain–membrane protein interaction.
Results and discussion
Defining the KRIT1–HEG1 interaction
The HEG1 cytoplasmic tail interacts with KRIT1 protein in the complex milieu of mammalian cell lysates (Kleaveland et al., 2009). To test whether HEG1–KRIT1 is a direct protein–protein interaction, we purified recombinant GST-fused KRIT1 FERM domain and HEG1 cytoplasmic tail (residues 1,274–1,381) proteins and found that HEG1 tail bound directly to the KRIT1 FERM (F123) protein (Fig. 1 A). Homology models of the KRIT1 FERM domain (Francalanci et al., 2009; Liu et al., 2011) predicted that the F3 subdomain of the FERM domain has a PTB domain fold. HEG1 C terminus contains a highly conserved NPxY/F sequence, which in many cases is able to interact with PTB-containing proteins (Smith et al., 2006); however, we found that although the C-terminal 26 residues of HEG1 (HEG1 C26) were sufficient for KRIT1 binding, the NPxY/F motif was dispensable. Mutating the N1,367PSF1,370 sequence to A1,367PSA1,370 (HEG1 NAFA and HEG1 C26 NAFA mutants) had no effect on KRIT1 binding (Fig. 1 B). In contrast, removal of 19 residues 1,363–1,381 at the C terminus of HEG1 (HEG1 Δ1,363) drastically reduced KRIT1 binding, suggesting that the key determinant is the C-terminal 19 residues of HEG. Isothermal titration calorimetry (ITC; Fig. 1 C and Table 1) revealed that the KRIT1 FERM domain bound to HEG1 C26 with Kd = 1.2 ± 0.14 µM. Thus, the HEG1 C-terminal 19 residues are the principal binding site for the KRIT1 FERM domain, and the N1,367PSF1,370 motif is dispensable for this interaction.
Figure 1.
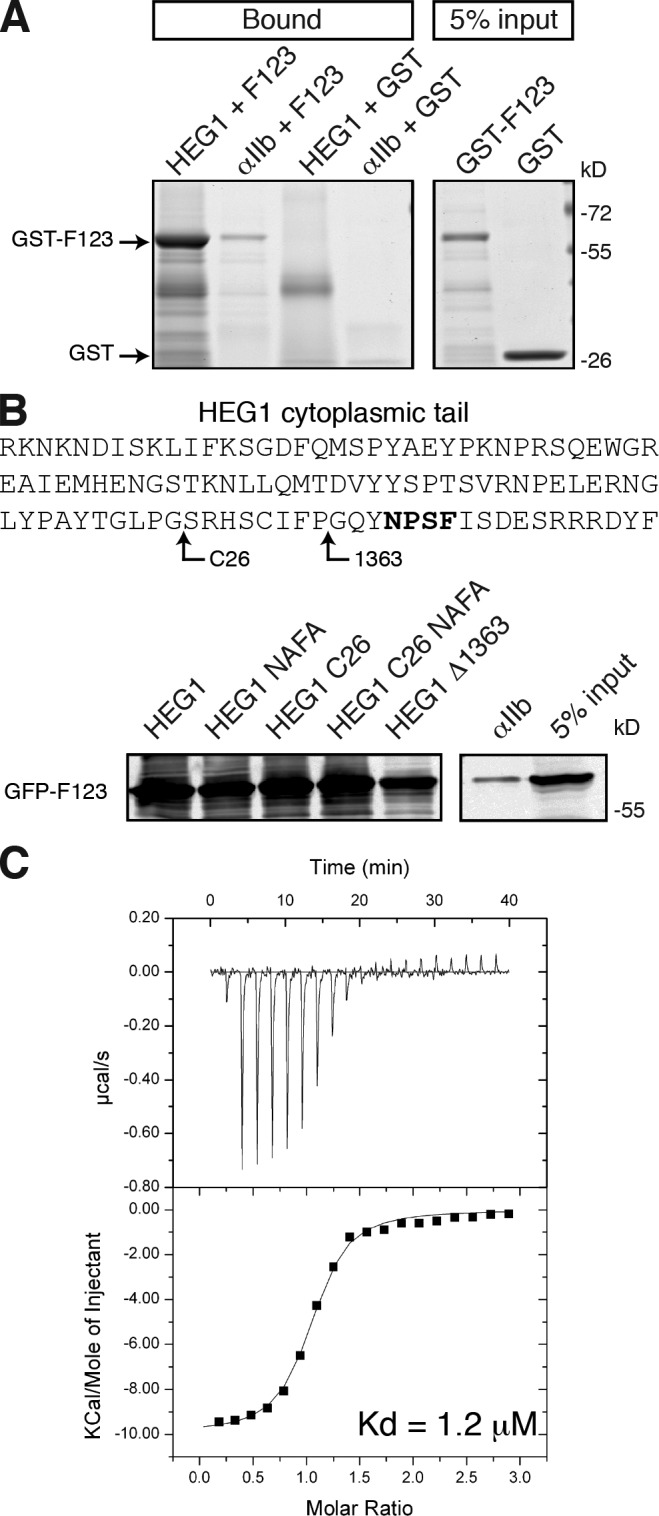
The direct interaction of KRIT1–HEG1. (A) HEG1 cytoplasmic tail model protein (residues 1,274–1,381) binds to recombinant GST-KRIT1 FERM but not GST alone. Integrin αIIb model protein does not bind to KRIT1 F123. Coomassie blue–stained SDS-PAGE gels are representative of three experiments. All lanes were from the same gel. (B) HEG1, HEG1 (N1367A/F1370A), HEG1 C26, and HEG1 C26 (N1367A/F1370A) tail model proteins bind to recombinant GFP-KRIT1 F123 from HEK293 cell lysates. HEG1 Δ1,363 truncated tail model protein binds to KRIT1 F123 to a much lesser extent. Top section shows the sequence of HEG1 cytoplasmic tail and indicates the mutated residues. All lanes were from the same membrane. Bold letters refer to the mutated sequence. (C) Calorimetric titration of 600 µM HEG1 peptide, out of the syringe, into 40 µM KRIT1 FERM domain in the sample cell (Kd = 1.2 µM). The top line defines the background. The bottom line defines the data fitting.
Table 1.
Thermodynamic parameters for binding of KRIT1 FERM domain to HEG1 cytoplasmic tail
| Clone | n | Kd | ΔH° | ΔG° | TΔS° |
| µM | Kcal/mol | Kcal/mol | Kcal/mol | ||
| Wild-type | 1.01 | 1.2 ± 0.14 | −10.0 | −8.1 | −1.9 |
Kd = 1 / Ka . ΔG° = −RTlnKa. ΔG = ΔH − TΔS. Ka, association constant; ΔH, enthalpy changes; ΔG, Gibbs energy changes; R, gas constant; T, absolute temperature; ΔS, entropy changes.
Structure of the KRIT1–HEG1 complex
The human KRIT1 FERM domain, KRIT1(417–736), was purified and crystallized with a recombinant human HEG1 peptide containing the 26 C-terminal residues. The structure (Protein Data Bank accession no. 3U7D) was solved and refined to a 2.5-Å resolution with an Rwork of 23.4% and Rfree of 30.9% (Table 2). The current KRIT1 model excludes residues 647–652 in the β1C–β2C loop, which are poorly defined in the electron density map (Fig. 2, A and B). Each asymmetric unit contained two KRIT1–HEG1 complexes that are almost identical, root-mean-square deviation = 0.6 Å, with distinct electron density visible for the C-terminal seven residues of the HEG1 tail. The last three residues (D1,379YF1,381) showed the best electron density (Fig. 3 A), whereas the first 19 residues were not observed, suggesting that they remained unstructured.
Table 2.
Data collection and refinement statistics for the KRIT1 FERM domain in complex with the HEG1 cytoplasmic tail
| Crystallographic statistic | Complex (3U7D) |
| Data collection | |
| Space group | P21 |
| Cell dimensions: | |
| a, b, c (Å) | 73.1, 76.8, 79.2 |
| α, β, γ (°) | 90.0, 113.6, 90.0 |
| Resolution (Å) | 52.7-2.49 (2.62-2.49) |
| Rmerge | 5.8 (31.2) |
| I/σI | 5.3 (2.3) |
| Completeness (%) | 98.7 (97.9) |
| Redundancy | 2.2 (2.2) |
| Refinement | |
| Resolution (Å) | 72.6-2.49 |
| No. of reflections | 26,420 |
| Rwork/Rfree | 23.4/30.9 |
| No. of atoms | 5,136 |
| Protein | 5,126 |
| Water | 10 |
| B factors | 50.3 |
| Protein | 50.3 |
| Water | 35.0 |
| R.m.s. deviations: | |
| Bond lengths (Å) | 0.017 |
| Bond angles (°) | 1.746 |
R.m.s., root-mean-square. Highest resolution shell is shown in parentheses.
Figure 2.

Crystal structure of the KRIT1 FERM domain bound to the HEG1 cytoplasmic tail peptide reveals a new mode of binding. (A) Sequence of human KRIT1 (UniProt O00522) FERM domain with secondary structure elements shown below the sequence. (B) View of the KRIT1 FERM domain bound to the HEG1 peptide. The HEG1 peptide is shown in yellow. The KRIT1 FERM domain consists of three subdomains: F1 (green and blue), F2, and F3. The linkers F1–F2 (residues 511–515) and F2–F3 (residues 631–637) are colored in gray, and the new features of the F1 domain that are not present in ubiquitin and radixin are shown in blue, i.e., helix α2A (residues 480–494). (C) The HEG1 binding pocket at the KRIT1 F1 and F3 interface. The interaction is mainly formed by hydrogen bonds from residues in loop β4A–α2A and hydrophobic residues from helix α2A and α1C. (D) Surface electrostatic potentials of the KRIT1 FERM domain with the HEG1 peptide shown as a stick model. The HEG1 residues buried in the hydrophobic pocket are shown in yellow, whereas the charged residues exiting the pocket are shown in white.
Figure 3.
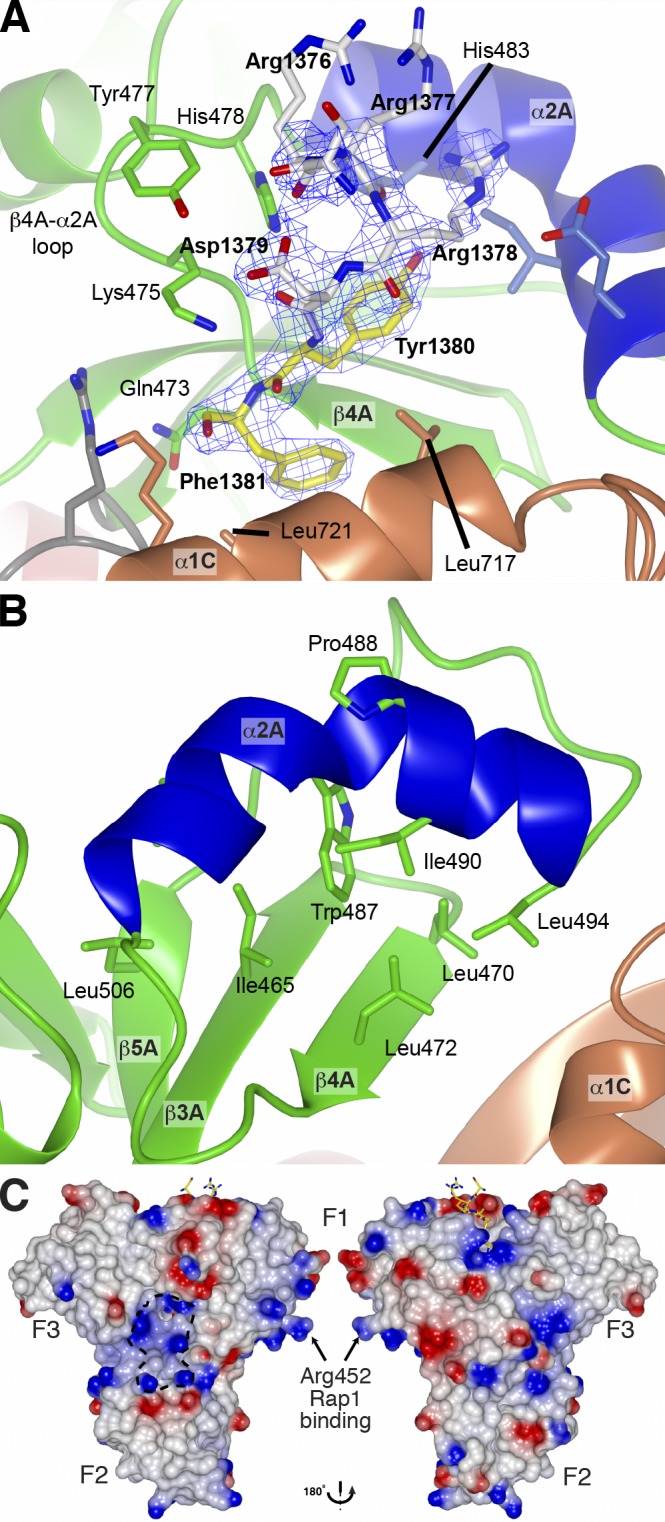
Structural details of the HEG1 binding pocket in KRIT1. (A) Electron density of the HEG1 peptide in complex with the KRIT1 FERM domain. Electron density (2 Fo-Fc map contoured at 1.2 σ) of the HEG1 peptide. The HEG1 peptide is colored as in Fig. 2 C, and the KRIT1 FERM domain is as in Fig. 2 B. Some of the key KRIT1 residues are highlighted. (B) Close view of the novel helix α2A in the KRIT1 F1 domain. The helix is kinked by ∼70° in the middle because of the presence of Pro488. The helix position is stabilized by hydrophobic contacts with residues from the β sheet. (C) The surface charge map of the KRIT1 FERM domain shows a basic surface at the F1–F2–F3 subdomain interface. The position of Arg452 is highlighted as mutation of this residue to Glu reduces KRIT1 binding to Rap1.
The KRIT1 FERM domain is similar to that found in ERM proteins and contains three subdomains arranged as a cloverleaf (Fig. 2 B): F1 (residues 420–510; Fig. 2 B, green and blue), F2 (residues 516–630; Fig. 2 B, red), and F3 (residues 638–730; Fig. 2 B, orange). The F1 domain has an ubiquitin-like fold (DALI server Z score = 7.1, root-mean-square deviation = 2.1 Å, Protein Data Bank no. 3NOB), although it has a novel helix α2A inserted in the β4A–β5A loop (residues 480–494; Fig. 2, A and B, blue helix). This helix, which is not observed in other ubiquitin-like folds, is kinked by ∼70° in the middle because of the presence of Pro488 breaking the hydrogen bond network (Fig. 3 B). It is, however, kept into position by extensive hydrophobic contacts between Trp487 and residues from the β3A to β5A strands. The F2 domain contains a core four-helix equivalent to that found in acyl-CoA–binding protein, and the F3 domain shares a fold of an adaptable ligand module seen for PTB, pleckstrin homology, and EHV1 (Enabled/ Vasodilator-stimulated phosphoprotein homology) domains.
HEG1–KRIT1 binding interface
The HEG1–KRIT1 interaction buried 640 Å2 of the HEG1 (residues 1,356–1,381) surface; the HEG1 binding pocket completely buried the C-terminal aromatic residues of HEG1, i.e., Tyr1,380 and Phe1,381 (Fig. 2, C and D, yellow), which accounts for 64% of the HEG1 buried area. The N-terminal region of the peptide comes out of the pocket making relatively few contacts with KRIT1 (Fig. 2 B). The HEG1 Asp1,379 side chain does not make direct hydrogen bonds with any of the three surrounding basic residues Lys475, Lys720, and Lys724 from KRIT1 (Fig. 2 C). However, those three lysine residues with Arg513 form a distinct cave with a positively charged entrance (Fig. 2 D, bottom section). In contrast, the surface of KRIT1 helix α2A is negatively charged because of the presence of Asp486, Glu489, and Glu493 and shows a good charge complementarity with HEG1 Arg1,378 (Fig. 2 D, top region). The N-terminal HEG1 residues, S1,375RR1,377, make little contact with KRIT1 and account for ∼10% of the buried surface, whereas no electron density is observed for the 19 N-terminal residues. Thus the structure of the HEG1–KRIT1 complex indicates that the C-terminal Tyr-Phe dipeptide of HEG1 is the dominant determinant of this high affinity interaction.
Binding of the HEG1 sequence occurs at the KRIT1 F1 and F3 interface mainly through three contacted regions: (1) polar contacts in the β4A–α2A loop, (2) a hydrophobic area on helix α1C, and (3) the novel helix α2A closing the binding pocket (Fig. 2 B). The KRIT1 β4A–α2A loop mainly interacts by hydrogen bonding with the HEG1 sequence (Fig. 3 A, left section), in which the backbone carbonyl group of KRIT1 Gln473 bonds to the backbone amide of HEG1 Phe1,381, and KRIT1 Lys475 side chain hydrogen bond to the backbone carbonyl of HEG1 Asp1,379. KRIT1 helix α2A forms a hydrophobic pocket (Fig. 3 B), composed of Ile490 and Leu494, with Leu472 from the β4A strand to accommodate the aromatic ring of HEG1 Tyr1,380. The HEG1 Tyr1,380 hydroxyl group is stabilized by hydrogen bonding with one of the indole nitrogens of KRIT1 His483 (Fig. 3 A). The F3 domain contributes to the interaction mainly from KRIT1 residues Leu717 and Leu721 of helix α1C completing the hydrophobic pocket surrounding the HEG1 C-terminal Tyr1,380 and Phe1,381 residues (Fig. 3 A). This structure represents a new mode of interaction of a FERM domain with a transmembrane protein and reveals the basis of the high affinity interaction of HEG1 with KRIT1. Furthermore, it differs from the classical PTB domain–peptide interaction (Smith et al., 2006) and explains the lack of dependence of the interaction on the HEG1 NPSF motif.
To test whether the HEG1 C-terminal aromatic dipeptide is required for binding to KRIT1, we formed an affinity matrix with an immobilized synthetic HEG1 C-terminal 19-residue peptide (HEG1-C19) or a truncated HEG1 peptide lacking the two C-terminal residues (HEG1-C19delYF). HEG1-C19 bound to KRIT1 FERM domain whereas, HEG1-C19delYF exhibited a >20-fold reduction in binding (Fig. 4 A). Thus, the C-terminal Tyr-Phe dipeptide is critical for HEG1–KRIT1 interaction.
Figure 4.

Reduced binding of KRIT1 (L717,721A) to HEG1. (A) HEG1 C19 cytoplasmic tail model protein binds to recombinant GFP-KRIT1 FERM from HEK293 cell lysates. HEG1 C19delYF, which lacks the last two residues, does not bind to GFP-KRIT1 FERM. (bottom) The equal loading of tail proteins as judged by SDS-PAGE and Coomassie blue staining. Blots are representative of three experiments. (B) HEG1 C19 tail model protein binds to recombinant GFP-KRIT1 FERM from HEK293 cell lysates but not GFP-KRIT1 FERM(L717,L721A). Both WT and mutant proteins are expressed at similar levels. All lanes were from the same gel. (C) Both GFP-fused KRIT1 WT and GFP-fused KRIT1(L717,721A) are associated with CCM2 at equivalent levels as assessed by coimmunoprecipitation and immunoblotting. All lanes were from the same gel. (D) Both GST-KRIT1 F123 and GST-KRIT1 F123(L717,721A) bind to HA-Rap1V12 from HEK293 cell lysates. GST-KRIT1 F123(R452E) mutant serves as a negative control as it does not bind to Rap1. (E) HA-tagged KRIT1 WT colocalizes with VE-cadherin at HUVEC cell–cell junctions. In contrast, HA-KRIT1(L717,L721A) does not . HA-KRIT1, green. VE-cadherin, red. IP, immunoprecipitation; LALA, KRIT1(L717A,L721A). Bar, 50 µm.
The biological role of the KRIT1–HEG1 interaction
The structure described in this study created the opportunity to examine the functional importance of the KRIT1–HEG1 interaction. Specifically, KRIT1 Leu717 and Leu721 help establish the hydrophobic pocket that buries the C terminus of HEG1. In consequence, a KRIT1(L717,721A) mutant exhibited markedly reduced binding to the HEG1-C19 peptide as judged by affinity chromatography (Fig. 4 B). Furthermore, injection of 2.2 mM HEG1 peptide into a solution of 40 µM KRIT1(L717,721A) FERM protein did not generate significant heat in an ITC experiment, indicating a >100-fold reduction in affinity (unpublished data). KRIT1(L717,721A) FERM protein was well folded as judged by its sharp melting temperature of 49.5°C in differential scanning calorimetry (Fig. S1 A). Furthermore, we made the corresponding mutant in the full-length human and zebrafish KRIT1 (krit1(L714,718A)), and both proteins were well-expressed in HEK293 cells (Fig. S1, B and C). KRIT1 has other important binding partners, including CCM2 (Zawistowski et al., 2005) and Rap1 (Serebriiskii et al., 1997). KRIT1(L717,721A) mutant interacted with both CCM2 (Fig. 4 C) and Rap 1 (Fig. 4 D) to the same extent as the wild-type (WT) protein. Thus, the KRIT1(L717,721A) is well folded and expressed, exhibits markedly reduced affinity for HEG1, but maintains interactions with other known binding partners of KRIT1.
HEG1 is a transmembrane receptor that localizes at EC–cell junctions (Kleaveland et al., 2009) and may therefore interact with KRIT1 to localize KRIT1 to junctions. In human umbilical vein ECs (HUVECs), KRIT1 localized at EC–cell junctions (Fig. 4 E, top), whereas KRIT1(L717,721A) did not (Fig. 4 E, bottom). KRIT1(L717,721A) junctional localization was not restored by stabilization of junctions by inhibition of Rho kinase (Fig. S2). Both WT and mutant KRIT1 also exhibited nuclear and cytoplasmic localizations as previously reported (Glading et al., 2007).
The KRIT1–HEG1 interaction is important for cardiovascular development and Rho signaling in ECs
Zebrafish embryos lacking heg or krit1 (also known as santa [San]) exhibit a similar dilated heart phenotype (Mably et al., 2003, 2006). To test whether the HEG1–KRIT1 interaction is important in zebrafish heart development, we coinjected krit1 WT or krit1(L714,718A) (the orthologue of human KRIT1(L717,721A)) cRNAs and San morpholino (MO) into zebrafish embryos at the one-cell stage and assessed cardiac dilation at 48 h postfertilization (hpf) as previously described (Liu et al., 2011). Injecting San MO alone resulted in heart dilation in 95% of zebrafish embryos. Authentic dilation was verified by identifying the endocardium in the fluorescence images of flk1:EGFP zebrafish (Fig. 5 A). Coinjection of WT krti1 cRNA together with San MO resulted in 80% reversal of the dilated heart phenotype (Fig. 5 B). In sharp contrast, coinjection of krit1(L714,718A) cRNA resulted in 20% reversal of the dilated heart phenotype. Both WT and krit1(L714,718A) zebrafish krit1 cRNAs contained an N-terminal HA tag, and similar protein expression levels were confirmed by immunoprecipitation blot from zebrafish embryo lysates (Fig. 5 C). Silencing KRIT1 in HUVECs increased RhoA/Rho kinase signaling in HUVECs as judged by increased myosin light chain phosphorylation, and coexpressing an siRNA-resistant KRIT1 reversed this effect. In contrast, expressing siRNA-resistant KRIT1(L717,721A) did not reduce myosin light chain phosphorylation (Fig. 5, D and E; and Fig. S3). KRIT1(L717,721A) expression in the absence of KRIT1 silencing did not impair zebrafish heart development (not depicted) or increase RhoA/Rho kinase signaling in HUVECs (Fig. S4). Thus, the direct interaction between HEG1 and KRIT1 is important for zebrafish cardiovascular development and suppression of RhoA signaling in EC.
Figure 5.

KRIT1–HEG1 interaction is required for normal zebrafish cardiovascular development and inhibition of RhoA/Rho kinase in EC. (A) Flk1:EGFP transgenic krit1-morphant (San MO) embryo showed enlarged heart phenotype. Coinjecting the cRNA encoding HA-tagged wild-type (WT) zebrafish krit1 protein reduced the heart size of injected fish, whereas fish coinjected with cRNA encoding HA-tagged Krit1 (L714,L718A), orthologous to human KRIT1(L717,L721A) mutant still exhibited a dilated heart phenotype. Dilated heart phenotype was scored by cardiac dilation in living fish. Authentic dilation was verified by indentifying the endocardium in the fluorescence images, which is indicated by the dotted lines. All microscopic images were taken at 48 hpf. Bars, 500 µm. (B) Bar graphs showing effects of Krit1 (L714,718A) mutant on zebrafish cardiovascular development. Data are expressed as number of embryos without dilated heart phenotype divided by total number of embryos used per experiment × 100; means ± SD. *, P < 0.05 compared with San MO + HA-WT cRNA group. Data are from three independent experiments. Total number of animals used: 94 in San MO + HA-WT group and 71 in San MO + HA-Krit1(L714,718A) group. (C) Both HA-tagged zebrafish Krit1 WT and Krit1(L714,718A) proteins were expressed at similar levels in injected embryos as revealed by immunoprecipitation with a rabbit anti-HA antibody from zebrafish embryo lysates and immunoblotting with a mouse anti-HA antibody. (D) Effect of disruption of the HEG1–KRIT1 interaction on RhoA/Rho kinase signaling in EC. Silencing of KRIT1 caused a marked increase in myosin light chain phosphorylation that was not reversed by expression of KRIT1 (L717,721A). (E) Extent of KRIT1 depletion and reconstitution in the experiment depicted in D. IP, immunoprecipitation; LALA, KRIT1(L717A,L721A); MLC myosin light chain.
Additional implications of the KRIT1–HEG1 mode of interaction
Our data show that KRIT1 interacts with the HEG1 cytoplasmic tail in an unusual manner and establish a structural mechanism for HEG1 to recruit KRIT1, and potentially CCM2, to cell–cell junctions. The HEG1 cytoplasmic tail is 111 amino acids long and has little predicted secondary structure, and we show here that KRIT1 binds strongly at the C terminus. If fully extended, the HEG1 tail could reach distances of ∼30 nm, which could permit it to recruit KRIT1 from afar after KRIT1 release from intracellular sites such as microtubules by Rap1 (Béraud-Dufour et al., 2007). A common structural feature shared by PTB domains, such as KRIT1 F3, is the presence of a peptide binding pocket at the β5–α1 interface, which often engages peptides containing NPxY/F motifs, and we note that when HEG1 is bound, this F3 peptide binding pocket remains accessible (Fig. 2 B). Because KRIT1 is autoinhibited by the binding of KRIT1 N terminus NPXY/F motifs to F3 via this binding pocket (Béraud-Dufour et al., 2007; Francalanci et al., 2009), our results explain how HEG1 can efficiently bind to full-length, presumably autoinhibited, KRIT1 (Liu et al., 2011). Alternatively, it is possible that the F3 subdomain of HEG1-bound KRIT1 can simultaneously engage other membrane proteins to create membrane microdomains at cell–cell junctions.
Materials and methods
Cell culture and transfection
HEK293 cells were maintained in Dulbecco’s modified Eagle’s medium (Cellgro) supplemented with 10% FBS (Sigma-Aldrich), 1% nonessential amino acids, 1% l-glutamine, and 1% penicillin and streptomycin (all obtained from Invitrogen). HEK293 cells were transfected using Lipofectamine Plus (Invitrogen) according to the manufacturer’s protocol. HUVECs (ScienCell) were maintained in EC medium with the manufacturer’s supplements (ScienCell). HUVECs were transfected using Nucleofector II and HUVEC Nucleofector kit (both obtained from Lonza) according to the manufacturer’s protocol.
Antibodies, cDNAs, siRNA, and reagents
Monoclonal anti-HA and monoclonal anti-FLAG M2 antibodies (both obtained from Sigma-Aldrich) were used for immunoblotting at 1:4,000. Rabbit polyclonal anti-HA antibody (Takara Bio Inc.) was used for immunoprecipitation. Mouse monoclonal anti-KRIT1 (15B2) and rabbit polyclonal anti-KRIT1 (6832) antibodies were developed using recombinant KRIT1 FERM domain as the antigen as previously described (Liu et al., 2011). Anti-KRIT1 15B2 antibody was used for immunoprecipitation. Anti-KRIT1 6832 antibody was used for immunoblotting at 1:1,000. Polyclonal anti-GFP antibody (Takara Bio Inc.) was used for immunoprecipitation. Monoclonal anti-GFP antibody (Takara Bio Inc.) was used for immunoblotting at 1:5,000.
Human KRIT1 cDNAs encoding HA-, GFP-, and GST-tagged full-length KRIT1 and KRIT1 FERM domain were previously described (Liu et al., 2011). In brief, HA-, GFP-, and GST-tagged constructs were cloned in pcDNA3.1(−) (Invitrogen), pEGFP-C1 (Takara Bio Inc.), and pGEX2TK vectors, respectively. Human KRIT1(L717,721A) mutant was generated by site-directed mutagenesis using the site-directed mutagenesis kit (QuikChange; Agilent Technologies). The mutant was then subcloned into pGEX2TK (GE Healthcare), pcDNA3.1 (Invitrogen), and pEGFP-C1 (Takara Bio Inc.) vectors for expressing GST-, HA-, and GFP-tagged proteins, respectively. Zebrafish krit1 cDNA was a gift from B. Weinstein (National Institutes of Health, Bethesda, MD) and subcloned into pcDNA3.1 vector with an N-terminal HA tag as previously described (Liu et al., 2011). Zebrafish krit1 (L714,718A) mutant was generated using the QuikChange site-directed mutagenesis kit. pRK5-CCM2 encoding FLAG-tagged human CCM2 has been previously described and was the gift of D. Marchuk (Duke University, Durham, NC; Zawistowski et al., 2005). pMT2-HA-Rap1A(G12V) was a gift from J. Bos (University Medical Center Utrecht, Utrecht, Netherlands) as previously described (Liu et al., 2011). The recombinant human HEG1 cytoplasmic tail model protein affinity matrix was previously described (Liu et al., 2011). HEG1 tail truncation mutants, C-26 and C-19, were generated by PCR from the HEG1 full-length tail construct and subcloned into the same pHisAvi vector. HEG1 tail (N1367A,F1370A) mutant was generated using the QuikChange site-directed mutagenesis kit.
In vitro protein interaction assay
Bacterial expression plasmids encoding GST-KRIT1 FERM or GST vector were expressed in BL21 (DE3) (EMD Millipore), and recombinant proteins were purified using glutathione–Sepharose beads according to manufacturer’s instructions (GE Healthcare). HEG1 and αIIb intracellular tail model proteins were prepared as previously described (Pfaff et al., 1998). In brief, His6-tagged HEG1 and αIIb intracellular tails containing an in vivo biotinylation peptide tag at the N terminus were cloned into pET15b. Tail proteins were expressed and purified from Escherichia coli. Pull-down assay using cell lysates were previously described (Liu et al., 2011). In brief, HEK293 cells were transfected with the indicated cDNAs. 24 h after transfection, cells were lysed in cold lysis buffer (50 mM Tris-HCl, pH 7.4, 150 mM NaCl, 0.5% NP-40, and 5 mM MgCl2) plus protease inhibitor cocktail (Roche). A total of 10 µg of immobilized bead-bound proteins was added to 350 µg of clarified cell lysates. Reactions were kept at 4°C overnight. After washing the beads with lysis buffer, samples were fractioned on 4–20% SDS-PAGE gel (Invitrogen). Bound proteins were analyzed by immunoblotting or Coomassie blue staining.
Immunoprecipitation
HEK293 cells were transfected with indicated cDNAs and incubated for 24 h. Cells were scraped on ice in lysis buffer plus protease inhibitor cocktails (Roche). A total of 2 µg monoclonal anti-GFP antibody was added to 350 µg cell lysates and incubated at 4°C overnight. Protein G–Sepharose (Invitrogen) was added to the reaction mixture and further incubated for 4 h at 4°C. After three washes with lysis buffer, beads were mixed with sample buffer and subjected to SDS-PAGE. Immunoprecipitated proteins were detected by immunoblotting.
ITC
Proteins were dialyzed into the ITC buffer (20 mM sodium phosphate, pH 6.5, and 150 mM NaCl). The thermodynamic parameters are determined using an isothermal titration calorimeter (iTC 200; MicroCal) at 25°C in 20 mM sodium phosphate, pH 6.5, and 150 mM NaCl. For binding, 0.6 or 2.2 mM recombinant human HEG1 C26 peptide (residues 1,356–1,381) was titrated from the syringe into the sample cell containing 40 µM KRIT1 FERM domain WT or KRIT1 FERM (L717,721A) mutant protein, respectively. Titration was performed by injecting volumes of 2.5 µl into the sample cell, during which the time between injections was 2 min. Further data evaluation was performed using the Origin program (MicroCal).
Protein crystallization
Human KRIT1 residues 417–736 were expressed and purified as described previously (Liu et al., 2011). In brief, KRIT1 was cloned into the expression vector pLEICS-07 (Protex) and expressed in E. coli BL21 Star (DE3) (Invitrogen). Recombinant His-tagged KRIT1 was purified by nickel-affinity chromatography, the His tag was removed by cleavage with tobacco etch virus protease overnight, and the protein was further purified by cation-exchange chromatography. The protein concentration was assessed using the A280 extinction coefficient of 45,090 M−1 before dialysis into buffers. Crystals were grown at RT using the sitting-drop method by mixing equal volumes of protein complex and reservoir solution (2 + 2 µl). KRIT1 at a concentration of 11 mg/ml in 20 mM Tris, pH 8.0, 50 mM NaCl, and 2 mM DTT was mixed with an equimolar concentration of HEG1 C26 peptide (3 mM stock in water). The reservoir solution contained 10% PEG 4000 and 100 mM citrate buffer, pH 4.0. The crystals were briefly transferred to reservoir solution containing 20% glycerol before freezing in liquid nitrogen.
Structure determination
Diffraction data for the KRIT1–HEG1 peptide complex were collected at European Synchrotron Radiation Facility microfocus beamline id23-2 (λ = 0.873) and recorded on MAR 225 detectors (Marresearch). The data were processed and scaled using Mosflm and scala, respectively. Initial phases were determined with Phaser, and the model was optimized using cycles of manual refinement with Coot and maximum likelihood refinement in Refmac5—all part of the CCP4 software suite (Collaborative Computational Project, Number 4, 1994). The final Ramachandran plot shows 93.1% of residues in favored regions, 8.1% in allowed regions, and 1.3% in outlier region, as defined by PROCHECK (CCP4 suite). The crystal structure has been submitted to the Protein Data Bank with the accession no. 3U7D.
Zebrafish experiments
Tg(flk1:EGFP) Danio rerio (zebrafish) embryos were raised at 28.5°C. Embryos from natural matings were kept in 1-phenyl-2-thiourea (0.003%) to inhibit pigmentation and staged according to Kimmel et al. (1995). Zebrafish were housed in the University of California, San Diego animal facility, and experiments were performed in accordance with the guidelines of University of California, San Diego Institutional Animal Care and Use Committee.
Antisense MO oligonucleotides (San MO) targeting splice junctions of krit1 (Liu et al., 2011), 5′-TTGAAGTCTCACTTTTGTCTCCATG-3′, or standard nontargeting control MO oligonucleotides (both obtained from Gene Tools) were injected into the yolks of one-cell-stage embryos at a dose of 1 ng. To rescue the enlarged heart phenotype caused by the krit1 MO, 1 ng krit1 MO and 400 pg cRNA encoding HA-tagged krit1 or krit1 (L714,718A) were coinjected into the one-cell-stage embryos. Transcription system (mMessage mMachine T7 ultra kit; Ambion) was used to prepare cRNAs. 48-hpf live embryos were mounted laterally in 1.2% agarose, and images were acquired using a fluorescence imaging system (4×/0.13 NA objective; BX40; Olympus). Images were acquired for each experiment using the same γ setting for all examples, and images from each experiment were equally enhanced for display with brightness/contrast adjustment using ImageJ software (National Institutes of Health).
Total zebrafish embryonic lysates from 20 injected embryos were used for immunoprecipitation. Rabbit anti-HA tag antibody was used for immunoprecipitation, and mouse anti-HA tag antibody was used for immunoblotting.
Immunofluorescence
For KRIT1 subcellular localization, HUVECs were transfected with the indicated HA-tagged KRIT1 WT or KRIT1(L717,721A) mutant and plated on fibronectin-coated glass coverslips at ∼90% confluence. HA-KRIT1–transfected cells were grown for 24 h before fixation. In some experiments, HUVECs were transfected with anti-KRIT1 siRNA in the presence or absence of cDNAs encoding either WT or mutant KRIT1, and phosphorylation of myosin light chain was assessed by immunoblotting as previously described (Stockton et al., 2010). Cells were fixed with 3.7% paraformaldehyde for 30 min at RT, permeabilized for 5 min with 0.2% Triton X-100, and blocked for 1 h with 10% normal goat serum (Sigma-Aldrich) in PBS, pH 7.4. Cells were probed with mouse anti-HA antibody (Covance) in PBS with 10% normal goat serum together with rabbit anti–VE-cadherin XP antibody (Cell Signaling Technology) for 3 h at RT in a humidified chamber. Coverslips were washed with PBS with 0.01% Triton X-100 (PBST) and then incubated with the indicated Alexa Fluor 488–labeled anti–mouse IgG and Alexa Fluor 568–labeled anti–rabbit IgG (both purchased from Invitrogen) at 1:1,000 for 1 h at RT. Coverslips were washed in PBST and PBS and then mounted in ProLong gold (Invitrogen). Cells were imaged at RT using a confocal microscopy system (spinning-disk confocal [UltraVIEW VoX; PerkinElmer] with an inverted microscope [IX81], a 40×/1.30 NA oil objective, and EM charge-coupled device 14-bit 1K × 1K camera [ImagEM-1K C9100-14; Hamamatsu Photonics]). Both 488- and 560-nm lasers were used for imaging. All images were acquired for each experiment using the same camera sensor setting for all samples, and z-sliced images were exported as TIFF files using Volocity 6.0.1 software (PerkinElmer). All images were equally enhanced for display with contrast enhancement in Volocity 6.0.1. Images shown are representative of results from at least three independent experiments.
Differential scanning calorimetry
Differential scanning calorimetry experiments were performed at a scanning rate of 1 K/min under 3.0 atm of pressure using a differential scanning calorimeter (N-DSC II; Calorimetry Sciences Corp.). Differential scanning calorimetry samples contained PBS, pH 7.4, and 1.0 mg/ml KRIT1 F123 or KRIT1 F123(L717,721A).
Online supplemental material
Fig. S1 shows that KRIT1(L717,L721A) mutant protein is well folded and its expression in HEK293 cells is similar to WT. Fig. S2 shows that KRIT1(L717,721A) junctional localization was not restored by stabilization of junctions by inhibition of Rho kinase. Fig. S3 quantifies the phospho–myosin light chain increase caused by KRIT1 depletion in HUVECs. Fig. S4 shows that KRIT1(L717,721A) did not increase RhoA/Rho kinase signaling in HUVECs. Online supplemental material is available at http://www.jcb.org/cgi/content/full/jcb.201205109/DC1.
Acknowledgments
The authors thank Wilma McLaughlin for assistance in molecular biology and Dr. I.L. Barsukov for help with ITC.
This work was supported by the American Heart Association 09POST2150098 (J.J. Liu), 12SDG11610043 (A.R. Gingras), the Wellcome Trust 087848 (A.R. Gingras), and National Institutes of Health HL106489 and GM094663 (M.H. Ginsberg). Facilities supported by P30 NS047101 and the UK Midlands Block Allocation mx1218 for European Synchrotron Radiation Facility were used in this work.
Footnotes
Abbreviations used in this paper:
- CCM
- cerebral cavernous malformation
- EC
- endothelial cell
- FERM
- band 4.1, ezrin, radixin, and moesin
- hpf
- hours postfertilization
- HUVEC
- human umbilical vein EC
- ITC
- isothermal titration calorimetry
- MO
- morpholino
- PTB
- phosphotyrosine binding
- WT
- wild type
References
- Anthis N.J., Wegener K.L., Ye F., Kim C., Goult B.T., Lowe E.D., Vakonakis I., Bate N., Critchley D.R., Ginsberg M.H., Campbell I.D. 2009. The structure of an integrin/talin complex reveals the basis of inside-out signal transduction. EMBO J. 28:3623–3632 10.1038/emboj.2009.287 [DOI] [PMC free article] [PubMed] [Google Scholar]
- Béraud-Dufour S., Gautier R., Albiges-Rizo C., Chardin P., Faurobert E. 2007. Krit 1 interactions with microtubules and membranes are regulated by Rap1 and integrin cytoplasmic domain associated protein-1. FEBS J. 274:5518–5532 10.1111/j.1742-4658.2007.06068.x [DOI] [PMC free article] [PubMed] [Google Scholar]
- Boulday G., Rudini N., Maddaluno L., Blécon A., Arnould M., Gaudric A., Chapon F., Adams R.H., Dejana E., Tournier-Lasserve E. 2011. Developmental timing of CCM2 loss influences cerebral cavernous malformations in mice. J. Exp. Med. 208:1835–1847 10.1084/jem.20110571 [DOI] [PMC free article] [PubMed] [Google Scholar]
- Calderwood D.A. 2004. Integrin activation. J. Cell Sci. 117:657–666 10.1242/jcs.01014 [DOI] [PubMed] [Google Scholar]
- Collaborative Computational Project, Number 4 1994. The CCP4 suite: programs for protein crystallography. Acta Crystallogr. D Biol. Crystallogr. 50:760–763 10.1107/S0907444994003112 [DOI] [PubMed] [Google Scholar]
- Faurobert E., Albiges-Rizo C. 2010. Recent insights into cerebral cavernous malformations: a complex jigsaw puzzle under construction. FEBS J. 277:1084–1096 10.1111/j.1742-4658.2009.07537.x [DOI] [PMC free article] [PubMed] [Google Scholar]
- Fehon R.G., McClatchey A.I., Bretscher A. 2010. Organizing the cell cortex: the role of ERM proteins. Nat. Rev. Mol. Cell Biol. 11:276–287 10.1038/nrm2866 [DOI] [PMC free article] [PubMed] [Google Scholar]
- Francalanci F., Avolio M., De Luca E., Longo D., Menchise V., Guazzi P., Sgrò F., Marino M., Goitre L., Balzac F., et al. 2009. Structural and functional differences between KRIT1A and KRIT1B isoforms: a framework for understanding CCM pathogenesis. Exp. Cell Res. 315:285–303 10.1016/j.yexcr.2008.10.006 [DOI] [PubMed] [Google Scholar]
- Glading A.J., Ginsberg M.H. 2010. Rap1 and its effector KRIT1/CCM1 regulate β-catenin signaling. Dis Model Mech. 3:73–83 10.1242/dmm.003293 [DOI] [PMC free article] [PubMed] [Google Scholar]
- Glading A., Han J., Stockton R.A., Ginsberg M.H. 2007. KRIT-1/CCM1 is a Rap1 effector that regulates endothelial cell–cell junctions. J. Cell Biol. 179:247–254 10.1083/jcb.200705175 [DOI] [PMC free article] [PubMed] [Google Scholar]
- Hogan B.M., Bussmann J., Wolburg H., Schulte-Merker S. 2008. ccm1 cell autonomously regulates endothelial cellular morphogenesis and vascular tubulogenesis in zebrafish. Hum. Mol. Genet. 17:2424–2432 10.1093/hmg/ddn142 [DOI] [PubMed] [Google Scholar]
- Kimmel C.B., Ballard W.W., Kimmel S.R., Ullmann B., Schilling T.F. 1995. Stages of embryonic development of the zebrafish. Dev. Dyn. 203:253–310 10.1002/aja.1002030302 [DOI] [PubMed] [Google Scholar]
- Kleaveland B., Zheng X., Liu J.J., Blum Y., Tung J.J., Zou Z., Sweeney S.M., Chen M., Guo L., Lu M.M., et al. 2009. Regulation of cardiovascular development and integrity by the heart of glass-cerebral cavernous malformation protein pathway. Nat. Med. 15:169–176 10.1038/nm.1918 [DOI] [PMC free article] [PubMed] [Google Scholar]
- Laberge-le Couteulx S., Jung H.H., Labauge P., Houtteville J.P., Lescoat C., Cecillon M., Marechal E., Joutel A., Bach J.F., Tournier-Lasserve E. 1999. Truncating mutations in CCM1, encoding KRIT1, cause hereditary cavernous angiomas. Nat. Genet. 23:189–193 10.1038/13815 [DOI] [PubMed] [Google Scholar]
- Lampugnani M.G., Orsenigo F., Rudini N., Maddaluno L., Boulday G., Chapon F., Dejana E. 2010. CCM1 regulates vascular-lumen organization by inducing endothelial polarity. J. Cell Sci. 123:1073–1080 10.1242/jcs.059329 [DOI] [PubMed] [Google Scholar]
- Leblanc G.G., Golanov E., Awad I.A., Young W.L.; Biology of Vascular Malformations of the Brain NINDS Workshop Collaborators 2009. Biology of vascular malformations of the brain. Stroke. 40:e694–e702 10.1161/STROKEAHA.109.563692 [DOI] [PMC free article] [PubMed] [Google Scholar]
- Liu J.J., Stockton R.A., Gingras A.R., Ablooglu A.J., Han J., Bobkov A.A., Ginsberg M.H. 2011. A mechanism of Rap1-induced stabilization of endothelial cell—cell junctions. Mol. Biol. Cell. 22:2509–2519 10.1091/mbc.E11-02-0157 [DOI] [PMC free article] [PubMed] [Google Scholar]
- Mably J.D., Mohideen M.A., Burns C.G., Chen J.N., Fishman M.C. 2003. heart of glass regulates the concentric growth of the heart in zebrafish. Curr. Biol. 13:2138–2147 10.1016/j.cub.2003.11.055 [DOI] [PubMed] [Google Scholar]
- Mably J.D., Chuang L.P., Serluca F.C., Mohideen M.A., Chen J.N., Fishman M.C. 2006. santa and valentine pattern concentric growth of cardiac myocardium in the zebrafish. Development. 133:3139–3146 10.1242/dev.02469 [DOI] [PubMed] [Google Scholar]
- McDonald D.A., Shi C., Shenkar R., Stockton R.A., Liu F., Ginsberg M.H., Marchuk D.A., Awad I.A. 2012. Fasudil decreases lesion burden in a murine model of cerebral cavernous malformation disease. Stroke. 43:571–574 10.1161/STROKEAHA.111.625467 [DOI] [PMC free article] [PubMed] [Google Scholar]
- Pfaff M., Liu S., Erle D.J., Ginsberg M.H. 1998. Integrin beta cytoplasmic domains differentially bind to cytoskeletal proteins. J. Biol. Chem. 273:6104–6109 10.1074/jbc.273.11.6104 [DOI] [PubMed] [Google Scholar]
- Sahoo T., Johnson E.W., Thomas J.W., Kuehl P.M., Jones T.L., Dokken C.G., Touchman J.W., Gallione C.J., Lee-Lin S.Q., Kosofsky B., et al. 1999. Mutations in the gene encoding KRIT1, a Krev-1/rap1a binding protein, cause cerebral cavernous malformations (CCM1). Hum. Mol. Genet. 8:2325–2333 10.1093/hmg/8.12.2325 [DOI] [PubMed] [Google Scholar]
- Sahoo T., Goenaga-Diaz E., Serebriiskii I.G., Thomas J.W., Kotova E., Cuellar J.G., Peloquin J.M., Golemis E., Beitinjaneh F., Green E.D., et al. 2001. Computational and experimental analyses reveal previously undetected coding exons of the KRIT1 (CCM1) gene. Genomics. 71:123–126 10.1006/geno.2000.6426 [DOI] [PubMed] [Google Scholar]
- Serebriiskii I., Estojak J., Sonoda G., Testa J.R., Golemis E.A. 1997. Association of Krev-1/rap1a with Krit1, a novel ankyrin repeat-containing protein encoded by a gene mapping to 7q21-22. Oncogene. 15:1043–1049 10.1038/sj.onc.1201268 [DOI] [PubMed] [Google Scholar]
- Smith M.J., Hardy W.R., Murphy J.M., Jones N., Pawson T. 2006. Screening for PTB domain binding partners and ligand specificity using proteome-derived NPXY peptide arrays. Mol. Cell. Biol. 26:8461–8474 10.1128/MCB.01491-06 [DOI] [PMC free article] [PubMed] [Google Scholar]
- Stockton R.A., Shenkar R., Awad I.A., Ginsberg M.H. 2010. Cerebral cavernous malformations proteins inhibit Rho kinase to stabilize vascular integrity. J. Exp. Med. 207:881–896 10.1084/jem.20091258 [DOI] [PMC free article] [PubMed] [Google Scholar]
- Whitehead K.J., Plummer N.W., Adams J.A., Marchuk D.A., Li D.Y. 2004. Ccm1 is required for arterial morphogenesis: implications for the etiology of human cavernous malformations. Development. 131:1437–1448 10.1242/dev.01036 [DOI] [PubMed] [Google Scholar]
- Whitehead K.J., Chan A.C., Navankasattusas S., Koh W., London N.R., Ling J., Mayo A.H., Drakos S.G., Jones C.A., Zhu W., et al. 2009. The cerebral cavernous malformation signaling pathway promotes vascular integrity via Rho GTPases. Nat. Med. 15:177–184 10.1038/nm.1911 [DOI] [PMC free article] [PubMed] [Google Scholar]
- Zawistowski J.S., Stalheim L., Uhlik M.T., Abell A.N., Ancrile B.B., Johnson G.L., Marchuk D.A. 2005. CCM1 and CCM2 protein interactions in cell signaling: implications for cerebral cavernous malformations pathogenesis. Hum. Mol. Genet. 14:2521–2531 10.1093/hmg/ddi256 [DOI] [PubMed] [Google Scholar]