

Abstract
Haploinsufficiency for GATA2 causes human immunodeficiency syndromes characterized by mycobacterial infection, myelodysplasia, lymphedema, or aplastic anemia that progress to myeloid leukemia. GATA2 encodes a master regulator of hematopoiesis that is also linked to endothelial biology. Though the disease-causing mutations commonly occur in the GATA-2 DNA binding domain, we identified a patient with mycobacterial infection and myelodysplasia who had an uncharacterized heterozygous deletion in a GATA2 cis-element consisting of an E-box and a GATA motif. Targeted deletion of the equivalent murine element to yield homozygous mutant mice revealed embryonic lethality later than occurred with global Gata2 knockout, hematopoietic stem/progenitor cell depletion, and impaired vascular integrity. Heterozygous mutant mice were viable, but embryos exhibited deficits in definitive, but not primitive, hematopoietic stem/progenitor activity and reduced expression of Gata2 and its target genes. Mechanistic analysis revealed disruption of the endothelial cell transcriptome and loss of vascular integrity. Thus, the composite element disrupted in a human immunodeficiency is essential for establishment of the murine hematopoietic stem/progenitor cell compartment in the fetal liver and for essential vascular processes.
Introduction
The discovery of MyoD as a master regulator of muscle development (1) ushered in intense efforts to identify similar proteins that function in distinct developmental contexts. Master regulators can resemble MyoD in being committed to a specific developmental process or can exert broader activities to control the development/function of multiple cell lineages. GATA-2, which exemplifies the latter group, mediates the genesis and function of hematopoietic stem/progenitor cells (HSPCs) and therefore all blood cell lineages (2, 3), but also functions cell autonomously to control neurogenesis (4–6) and adipogenesis (7, 8). In endothelial cells (9, 10), GATA-2 mediates mechanosignaling-dependent angiogenesis (11).
Dysregulated GATA-2 activity underlies human hematologic and vascular pathologies (12). Both heterozygous missense mutations and intragenic deletions in GATA2 cause the monocytopenia and mycobacterial infection syndrome (MonoMAC) or dendritic, monocyte, B, and NK lymphoid deficiency, characterized by susceptibility to mycobacterial, fungal, and viral infections as well as human papillomavirus–associated cancers (13, 14). Patients with MonoMAC syndrome exhibit increased susceptibility to infection and often develop myelodysplasia and acute myeloid leukemia (AML) (15). Human genetic analyses indicate that GATA2 is a myelodysplastic syndrome and AML predisposition gene (16). GATA2 haploinsufficiency causes Emberger syndrome, which involves lymphedema and predisposition to myelodysplasia and AML (17). GATA2 overexpression in AML patients predicts significantly reduced survival (18). Finally, somatic GATA2 mutations occur in chronic myelogenous leukemia (19, 20), and GATA2 polymorphisms correlate with early-onset coronary artery disease (21).
It is instructive to consider how the precise expression patterns of master regulators that control multiple developmental programs are established and maintained in stem and progenitor cells. As decreased GATA2 expression causes hematologic disorders and increased GATA2 expression correlates with disease severity, elucidating the mechanisms underlying the control of GATA2 expression/activity is of high significance. Though GATA-2 regulates developmental fate in diverse contexts and, as noted above, is linked to human pathologies, mechanisms that establish and maintain its contextually distinct expression patterns are largely unknown. Bone morphogenetic protein–4 signaling induces GATA-2 expression early in hematopoiesis (22–24). GATA-2 occupies dispersed sites at GATA2 (Figure 1), suggesting potential positive autoregulation (25–27), although it is not possible to infer precise functional consequences from ChIP data. As GATA-1 levels rise during erythropoiesis, GATA-1 displaces GATA-2 from Gata2, instigating repression (28). “GATA switches” occur at 5 Gata2 sites (–77, –3.9, –2.8, –1.8, and +9.5 kb) (26). In principle, the individual sites may confer qualitatively distinct expression patterns or may function similarly to maximize transcription in all contexts.
Figure 1. Disruption of the GATA2 E-box–GATA composite cis-element in the MonoMAC patient.

(A) ChIP-seq analysis of GATA-2 occupancy at GATA2 in human erythroid, endothelial, and neural cells. Datasets for K562 erythroleukemia and HUVECs were described (27, 43). The ChIP-seq data set from SH-SY5Y neuroblastomas (from R. Kumar, P.J. Farnham, and E.H. Bresnick, unpublished observations) was performed identically to the other analyses. (B) +9.5 kb site deletion in MonoMAC. Sequencing identified a 28-bp deletion from 1 allele of the MonoMAC patient (c.572+512del28 allele) versus control. Human and mouse sequence comparison illustrating conserved composite element. Red text: GATA motifs and E-box (CATCTG). Human transcript variant 1 (NM_001145661.1) includes two upstream noncoding exons. The murine intron 4 +9.5 region corresponds to human intron 5. (C) Co-inheritance of SNP-containing G allele and +9.5 kb site deletion (intron 5 del28) by one son of the MonoMAC patient determined by sequencing, demonstrating linkage of GATA2 +9.5 kb site deletion and exon 4 SNP rs34799090 (c.481C>G). (D) Differential allele expression in the +9.5 kb site deletion MonoMAC patient. SNP probes distinguished between GATA2 alleles in monocyte and T cell cDNAs (mean ± SD, 2 RT reactions per sample analyzed in quadruplicate; *P < 0.0001). (E) Bone marrow megakaryocytic dysplasia from the +9.5 kb site deletion MonoMAC patient versus normal human marrow megakaryocytes. Normal human megakaryocytes from H&E-stained core marrow biopsy and Wright-Giemsa–stained aspirate smear demonstrating normal maturation with multiple connected nuclear lobes. Dysplastic megakaryocytes from +9.5 kb site deletion patient with thrombocytopenia showing atypical separated or detached nuclear lobes (core biopsy, H&E; aspirate smear, Wright-Giemsa) and atypical mononuclear megakaryocyte; dysplastic megakaryocyte detected by Factor VIIIvw immunohistochemistry. Original magnification, ×1000.
Studies in mouse strains lacking the endogenous –2.8 kb GATA motif cluster (29) or the –1.8 kb GATA palindromic motif (30) revealed that neither is essential for Gata2 expression in HSPCs, although both contribute to maximal Gata2 expression. The –1.8 kb site has a qualitatively unique activity: maintaining Gata2 repression in late-stage erythroblasts. Presumably, another cis-element is essential for conferring Gata2 expression in HSPCs, or multiple cis-elements function additively to maximize expression, analogous to sites conferring β-globin expression (31). Despite the cis-element–knockout strains described above, and additional transgenesis efforts in mouse and zebrafish (32, 33), mechanisms underlying endogenous GATA-2 expression in vivo have remained elusive.
To investigate whether different GATA switch sites exert qualitatively or quantitatively distinct activities, we analyzed the function of a conserved composite element, consisting of an E-box, a spacer, and a GATA motif (CATCTGCAGCCGGTAGATAA), at the +9.5 kb site, which is occupied by GATA-2 and Scl/TAL1, also a master regulator of hematopoiesis and implicated in leukemogenesis (34–37). Such composite elements nucleate complexes containing GATA-1 or GATA-2 and Scl/TAL1 (38–40), although many questions remain regarding how these elements function at endogenous sites. Strikingly, we discovered a heterozygous deletion that disrupts this composite element in a MonoMAC patient with phenotypes indistinguishable from those of patients harboring heterozygous coding region mutations. Our studies employing targeted deletion of the murine composite element indicate its essential role in conferring Gata2 expression in HSPCs and embryonic endothelium and establishing the fetal liver definitive HSPC compartment, and provide mechanistic insights into a novel GATA-2 function: to confer vascular integrity.
Results
Disruption of a conserved E-box–GATA composite element in a patient with mycobacterial infection and myelodysplasia.
A previously healthy woman of European descent had group C streptococcus bacteremia and osteomyelitis at 22 years of age. Subsequently, she had Mycobacterium tuberculosis bacteremia, granulomatous mediastinitis, and vulvar and cervical intraepithelial neoplasia. Peripheral blood counts revealed variable degrees of neutropenia and anemia, but a consistent major reduction in monocytes, B cells, and NK cells. Bone marrow at age 27 was myelodysplastic, with atypical hypolobulated megakaryocytes with separate nuclear lobes, non-necrotizing granulomata, but no clonality. The patient has received long-term therapy with GM-CSF and erythropoietin. The constellation of mycobacterial infection, HPV-related neoplasia, monocytopenia, B and NK cell cytopenia, and myelodysplasia is characteristic of MonoMAC syndrome (14).
Unlike in prior MonoMAC patients (13, 14), we failed to detect mutations in the GATA2 cDNA in this patient. We considered the possibility that mutations may have disrupted cis-elements that regulate GATA2 transcription. Conserved GATA switch sites residing upstream of the GATA2 promoter (–1.8, –2.8, and –3.9 kb) and in an intron (+9.5 kb) have been proposed to be determinants of GATA2 expression (26, 28, 41). ChIP-sequencing (ChIP-seq) analysis indicated that endogenous GATA-2 occupies these sites differentially in 3 human cell lines: K562 erythroleukemia cells, HUVECs, and SH-SY5Y neuronal cells (Figure 1A). Thus, the capacity of GATA-2 to occupy these sites differs in distinct cellular contexts. We sequenced these sites in the MonoMAC patient, and while sequences of the –3.9, –2.8, and –1.8 kb sites were identical to the wild-type sequence, the +9.5 site contained a heterozygous 28-bp deletion at c.572+512del28 (Figure 1B). This 28-bp deletion excised an imperfect GATA motif (GATAG), the E-box of the conserved composite element (CATCTG), and 5 bp of the 8-bp spacer between the E-box and the AGATAA motif (Figure 1B).
While it was not possible to obtain HSPCs from the patient, peripheral blood was used to analyze allelic expression in small numbers of monocytes and T cells. The two alleles were differentiated by the presence of a known SNP, rs34799090 (c.481C>G), in exon 4, which causes the amino acid change P161A. Co-inheritance of SNP rs34799090 with the +9.5 deletion in one of the patient’s children confirmed that the SNP mapped to the same allele as the deletion (Figure 1C). cDNA quantitation revealed differential expression of the two alleles, with the G allele expressed at 54.3% and 58.3% of the C allele in monocytes and T cells, respectively (Figure 1D). By contrast, PCR analysis of the heterozygous genomic DNA revealed an equivalent amplification of the two alleles (Figure 1D). Although GATA-2 function in monocytes and T cells is not well established, the significantly reduced expression of the G allele (P < 0.0001) indicates that disruption of the +9.5 composite element reduces GATA2 expression. Analysis of bone marrow from a normal patient and the MonoMAC patient with the +9.5 kb site deletion by H&E and Wright-Giemsa staining revealed profound megakaryocytic dysplasia, in which megakaryocytes exhibited separated or detached nuclear lobes or were mononuclear (Figure 1E). Immunohistochemical analysis with anti–Factor VIIIvw highlighted the dysplastic megakaryocytic morphology (Figure 1E). The large dysplastic (osteoclast-like) megakaryocytes were commonly detected in the bone marrow of MonoMAC patients harboring GATA2 coding region mutations described previously (42).
Prior studies indicated that alterations of the CA or TG bases of the E-box or truncations of the spacer severely impaired composite element enhancer activity in transfection assays (35). The phenotype of the patient harboring the composite element disruption was indistinguishable from that of patients with heterozygous GATA2 coding region mutations (13, 14). Importantly, sequencing over 400 alleles from normal patients did not reveal variation in the +9.5 kb region. We also identified 4 unrelated families with +9.5 site mutations that are transmitted with Mendelian genetics and are not SNPs or common variants (data not shown). These results suggest that the heterozygous mutation of the +9.5 kb site in MonoMAC reduces GATA2 expression in vivo.
The E-box–GATA composite element at the murine Gata2 locus is required for embryogenesis and vascular integrity.
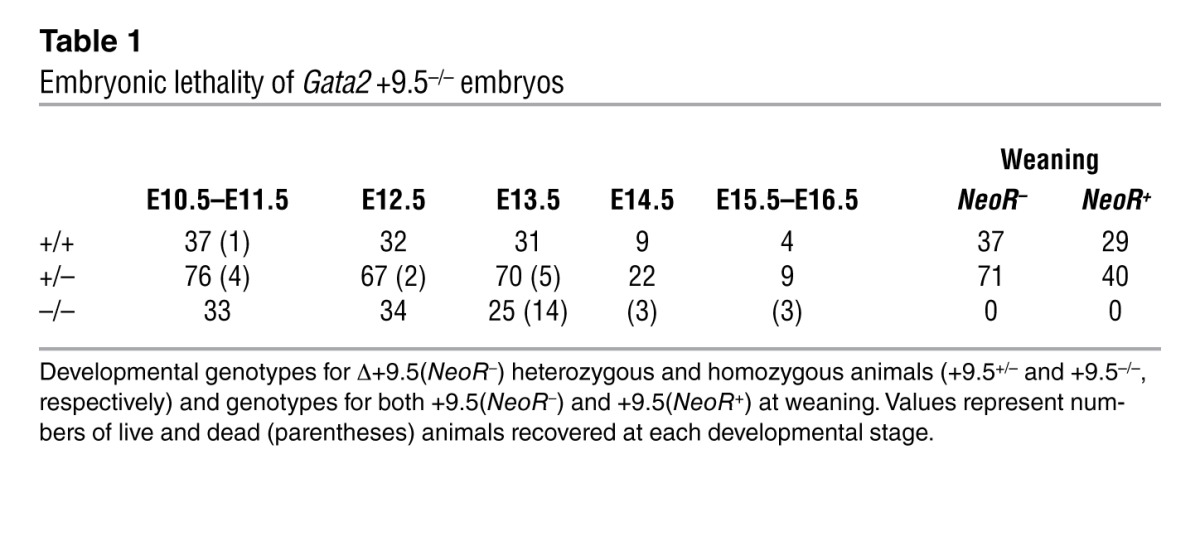
We used homologous recombination to delete the composite element from the ES cell genome and generated +9.5+/– and +9.5–/– mice (Figure 2, A–C). The NeoR cassette was excised in adults by breeding mutants to mice expressing Cre driven by cytomegalovirus regulatory elements. In the presence and absence of NeoR, no homozygous mutants were born (Table 1), though heterozygous animals were present at the expected Mendelian ratio. Timed matings indicated that +9.5–/– embryos lacking NeoR die between E13.5 and E14.5. The critical requirement for embryogenesis distinguishes this GATA switch site from the previously studied –1.8 and –2.8 kb sites.
Figure 2. Targeted deletion of the +9.5 kb site yields embryonic lethality and severe hemorrhaging.

(A) Strategy for targeted disruption of the composite E-box–GATA element within the +9.5 kb site in murine CJ9 ES cells. GATA motifs and E-box are indicated in red. (B) PCR validation of Δ+9.5 (NeoR+) targeted allele. (C) PCR genotyping assay for Δ+9.5(NeoR)–excised allele. (D) Representative E13.5 littermates. (E) Subcutaneous hemorrhage in the trunk (left) and in the brain ventricular space (right) in +9.5–/– embryos detected by H&E staining of transverse sections. Scale bars: 50 μM.
Table 1.
Embryonic lethality of Gata2 +9.5–/– embryos
By E13.5, +9.5–/– embryos exhibited severe hemorrhaging (100% penetrance) with variable edema (Figure 2D). In contrast to Gata2–/– mice, which die at E10.5 (2), +9.5–/– mutants were not anemic, and their size was similar to that of wild-type embryos. Hemorrhages occurred at various sites, including subcutaneous sites in the trunk and the brain (Figure 2E).
To evaluate the mechanism of the vascular integrity defect, we conducted immunohistochemical analysis with anti–PECAM-1 antibody in transverse sections from multiple +9.5+/+ and +9.5–/– E13.5 embryos. This analysis revealed compromised venous endothelial cell barriers. The representative example of Figure 3 illustrates a discontinuous endothelial cell barrier, with blood cells residing both inside and outside of the vein. Serial analysis of transverse sections commonly revealed dilated veins (data not shown). By contrast, the organization of PECAM-1–positive endothelial cells in arteries and gross arterial architecture did not differ in +9.5+/+ and +9.5–/– mutant embryos. Though knocking down GATA-2 impairs the capacity of human endothelial cells to organize into tubes in vitro and to develop retinal microvasculature (11), the Gata2 composite element was not required for vasculogenesis in the yolk sac and embryo proper. Gata2–/– mice were reported to exhibit normal yolk sac vasculogenesis (2). Large GATA-2 target gene ensembles in human umbilical vein (43) and microvascular (44) endothelial cells indicate roles in vascular and inflammatory processes. Our results provide the first evidence to our knowledge for GATA-2 control of vascular integrity in vivo and definitive evidence for qualitative mechanistic differences in GATA switch site activities; the –2.8 and –1.8 kb site knockouts analyzed previously (29, 30) did not reveal vascular abnormalities.
Figure 3. Vascular integrity defect in +9.5–/– E13.5 mouse embryos revealed by PECAM-1 immunohistochemistry.

Representative venous malformation (arrows, ×40 and ×100) and blood cell leakage (arrowheads, ×100) in a transverse section from a +9.5–/– mutant embryo. Blood cells reside both inside and outside the discontinuous endothelial cell layer.
Severe depletion of fetal liver HSPCs in +9.5 kb site mutant mice.
Although +9.5–/– embryos are not overtly anemic and possess an abundance of nucleated primitive erythroblasts, we quantitated the erythroid differentiation potential of hematopoietic precursors in E8.0 yolk sacs by colony assay. After 5 days of culture in a methylcellulose-containing medium that supports the formation of primitive erythroid (EryP) colonies (45), hematopoietic precursors from dissociated +9.5–/– yolk sacs generated EryP colonies indistinguishable in appearance (Figure 4A) and number (Figure 4B) from those of +9.5+/+ or +9.5+/– littermates. Thus, primitive hematopoietic potential was not compromised by the +9.5 site mutation. However, examination of fetal liver hematopoiesis in E12.5 (Figure 4D) and 13.5 (Figure 4C) embryos revealed defects in morphology, cellularity, and function. The +9.5–/– fetal livers were considerably smaller (Figure 4C) (100% penetrance) and consisted of fewer cells than livers from wild-type littermates. The mutation strongly reduced (P < 0.002, +9.5+/+ vs. +9.5–/–) erythroid and myeloid colony-forming activity of fetal liver hematopoietic precursors (Figure 4E), as assayed in methylcellulose-containing growth factors that support multilineage hematopoietic differentiation. FACS analysis of E12.5–E13.5 fetal liver cells revealed strong depletion of Lin–Sca+Kit+ and Lin–Kit+ HSPC populations (Figure 5, A and D). These populations exhibited a significantly greater percentage of propidium iodide–positive (PI-positive) cells (12% vs. 24.8% for +9.5+/+ and +9.5–/–, respectively), indicating decreased cell viability (Figure 5B). The HSC population (Lin–Mac1+CD41–CD48–CD150+Sca+Kit+) was undetectable in all but one outlier mutant, which had considerably lower levels than the wild-type samples (Figure 5, C and D). Given the reduced liver size, TER-119+ cells per liver decreased, but as a percentage of total fetal liver cells, TER-119+ cells were unaffected (Figure 5, A and D).
Figure 4. Reduced colony-forming potential of +9.5–/– and +9.5+/– fetal liver but not yolk sac hematopoietic progenitors.

(A) Representative EryP colonies derived from E8.0 yolk sac hematopoietic progenitors cultured in methylcellulose medium for 5 days. Scale bar: 50 μM. (B) Quantitative analysis of EryP colonies obtained from a single litter (+9.5+/+, 3 embryos; +9.5+/–, 3 embryos; +9.5–/–, 3 embryos; mean ± SEM). Differences in the number of colonies from each embryo were not statistically significant. (C) Representative E13.5 fetal livers from +9.5+/+ and +9.5–/– mutant embryos. (D) Quantitative analysis of cell number in E12.5 fetal livers (mean ± SEM; *P < 0.0001). (E) Quantitative analysis of erythroid and myeloid colony-forming potential of fetal liver hematopoietic precursors (3 litters: +9.5+/+, 8 embryos; +9.5+/–, 12 embryos; +9.5–/–, 5 embryos; mean ± SEM). The reduction in erythroid and myeloid colony-forming activity in the +9.5–/– and +9.5+/– samples was significant (P < 0.05). BFU-E, erythroid burst-forming units; GM, granulocyte, monocyte; GEMM, granulocyte, erythrocyte, monocyte, megakaryocyte.
Figure 5. Severe depletion of immunodetectable HSPCs in +9.5–/– embryos.

(A) Flow cytometry analysis of E12.5 fetal livers for HSPC (Lin–Kit+Sca+ and Lin–Kit+) and erythroid cell (TER-119+) content. (B) Cell viability as measured by PI permeability (*P < 0.008). (C) Flow cytometry analysis of E12.5 fetal liver HSCs (Lin–Mac1+CD41–CD48–CD150+Sca+Kit+). (D) Quantitative analysis of flow cytometry data expressed as percentage of total fetal liver cells. *P < 0.005. The analyses conducted in A and B used 4 litters (+9.5+/+, 7 embryos; +9.5+/–, 14 embryos; +9.5–/–, 6 embryos), and analyses in C used 2 litters (+9.5+/+, 5 embryos; +9.5+/–, 5 embryos; +9.5–/–, 6 embryos). Quantitative data are presented as mean ± SEM.
To test whether the large reduction in immunodetectable HSCs reflects the absence of functional HSCs in the mutant fetal livers, +9.5+/+, +9.5+/–, and +9.5–/– E12.5 fetal liver cells (CD45.2+) were competitively transplanted into lethally irradiated CD45.1 recipients at a 1:1 ratio with CD45.1+ wild-type competitor bone marrow cells. At 6 and 10 weeks after transplantation, CD45.2+ cells were not detected in peripheral blood of recipients transplanted with +9.5–/– livers, whereas the average contribution from +9.5+/+ and +9.5+/– littermates at 6 weeks was 28.4% and 8.6%, respectively, and at 10 weeks it was 33.8% and 13.0%, respectively (Figure 6A). Though long-term repopulating activity was significantly reduced in the +9.5+/– versus +9.5+/+ donors, HSCs from +9.5+/+ and +9.5+/– donors contributed similarly to myeloid and lymphoid lineages in the peripheral blood at 6 weeks (Figure 6B). At 10 weeks, significant increases in CD45.2+ T cells (P = 0.042) and B cells (P = 0.012) were observed in recipients of fetal liver cell transplants from +9.5+/– donors versus +9.5+/+ littermate controls.
Figure 6. Severe depletion of functional hematopoietic stem cells in +9.5–/– embryos.

E12.5 fetal liver cells (CD45.2) from +9.5+/+, +9.5+/–, and +9.5–/– littermates were transplanted into irradiated CD45.1 recipient mice at a 1:1 ratio with CD45.2+ bone marrow cells. Peripheral blood was analyzed by flow cytometry 6 and 10 weeks after transplantation. (A) CD45.2+ cells in recipient mice expressed as percentage of total live nucleated cells. Data are presented as mean ± SEM. The contribution from +9.5+/– and +9.5–/– donors was significantly reduced compared with +9.5+/+ littermates as indicated (*P < 0.05). (B) The contribution of +9.5+/+ and +9.5+/– donor-derived CD45.2 cells to peripheral blood monocytes (Mac1+Gr-1–), granulocytes (Mac1+Gr-1+), T cells (Thy1.2+), and B cells (CD19+). At 10 weeks, significant increases in CD45.2+ T cells (P = 0.042) and B cells (P = 0.012) were observed in recipients of fetal liver cell transplants from +9.5+/– donors compared with +9.5+/+ littermate controls. Similar results were obtained in an additional transplantation experiment using 150,000 live nucleated fetal liver cells and 300,000 bone marrow cells (data not shown)
The results in Figures 5 and 6 define the transcriptional mechanism responsible for establishment of functional erythroid and myeloid precursors in the fetal liver HSPC compartment. As the +9.5–/– embryos harbored abundant primitive erythroblasts, primitive hematopoietic precursor activity was normal, and EryP colonies generated in vitro were morphologically indistinguishable from wild-type colonies, the cis-element deletion uniquely impairs definitive, but not primitive, hematopoiesis.
GATA-2–dependent genetic network consisting of pivotal regulators of vascular remodeling and integrity.
The profound phenotypes described above suggested that the +9.5 kb element regulates Gata2 transcription in vivo. Analyses of factor occupancy at GATA switch sites revealed correlations consistent with GATA-2–mediated positive autoregulation and GATA-1–mediated repression. Thus, the consequences of deleting the composite element were not predictable. Furthermore, ectopic GATA-2 upregulation may enhance or oppose a particular developmental process. GATA-2 overexpression can block both mouse (46) and human (47) hematopoiesis. Reduced GATA-2 expression may result in insufficient GATA-2 levels to support processes or may relieve a GATA-2–dependent inhibitory mechanism.
Since GATA-2 is expressed in multiple cell types, we asked whether the +9.5 kb element deletion altered Gata2 expression in all or select cell types and whether the mutation yielded qualitatively similar or distinct consequences in different target cells. We quantitated Gata2 expression in E12.5–E13.5 fetal liver, endothelial cells enriched with anti–PECAM-1 antibody–bound beads, and fetal brain (Figure 7A). Analysis of multiple embryos from identical and different litters revealed significantly reduced Gata2 expression in +9.5+/– versus +9.5+/+ fetal liver (P = 0.006) and PECAM-1+ cells (P = 0.033) and a greater reduction (fetal liver, P = 0.0001; PECAM-1+, P = 0.0001) in +9.5–/– vs. +9.5+/+ embryos. Gata2 expression was significantly reduced in +9.5–/– embryos at multiple stages of fetal liver development (E11.5, E12.5, and E13.5) (Figure 7B). The molecular defects in the +9.5+/– embryos suggests that the human GATA2 haploinsufficiency dysregulates the GATA-2–dependent genetic network in definitive hematopoietic precursors. These results highlight how a cis-element confers expression of a cell type–specific gene in a subset of its target cell types in vivo.
Figure 7. Context-dependent mechanism underlying Gata2 transcription in vivo.

(A) Total RNA was isolated from E12.5–E13.5 liver, endothelial cells, and brain. Gata2 mRNA was quantitated by real-time RT-PCR and normalized by 18S rRNA levels. Each symbol represents the expression level in a particular embryo, and multiple litters: for liver, 2 litters (7 WT, 8 +9.5+/–, 5 mutant); for brain, 3 litters (6 WT, 10 +9.5+/–, 4 mutant) were analyzed. Mean and SEM are represented by long and short horizontal bars, respectively. For all cases except brain, Gata2 expression was significantly lower in mutant versus wild-type samples (+9.5+/+ vs. +9.5–/–, P < 0.0001; +9.5+/+ vs. +9.5+/–, P < 0.04; +9.5+/– vs. +9.5–/–, P < 0.03). (B) Analysis of Gata2 expression in +9.5+/+ vs. +9.5–/– fetal livers from embryos at the indicated developmental stages (+9.5+/+ vs. +9.5–/–, *P < 0.008).
Given the strongly reduced Gata2 expression in PECAM-1–positive cells (Figure 7A), transcriptional profiling was conducted to gain insights into mechanisms underlying the vascular phenotype. This analysis revealed a restricted cohort of genes that were significantly downregulated in the mutant cells, and a smaller group of upregulated genes (Figure 8A). Gene ontology analysis indicated significant enrichments of genes involved in hemostasis/thrombosis and crucial aspects of endothelial cell function, including cell adhesion and motility (Figure 8B). Itgb3 and Fermt3 encode integrin β3 and the positive regulator of its activity kindlin-3. Targeted deletions of these proteins in the mouse demonstrate that they confer vascular integrity in vivo (48, 49), and therefore we used real-time RT-PCR to verify the expression changes. Both Itgb3 and Fermt3 were significantly downregulated in the mutant PECAM-1+ cells (Figure 8C) (Itgb3: +9.5+/+ vs. +9.5+/–, P = 0.0005; +9.5+/+ vs. +9.5–/–, P = 1.5 × 10⁻⁷; Fermt3: +9.5+/+ vs. +9.5+/–, P = 7.2 × 10⁻⁵; +9.5+/+ vs. +9.5–/–, P = 4.0 × 10⁻⁸). RT-PCR analysis confirmed similarly significant reductions in additional targets revealed by the microarray analysis, including Stfa1 and Ear2 expression (data not shown). ChIP-seq analysis in HUVECs revealed GATA-2 occupancy of the endogenous ITGB3 and FERMT3 loci (Figure 8D), as well as at additional loci (Supplemental Figure 1; supplemental material available online with this article; doi: 10.1172/JCI61623DS1). siRNA-mediated knockdown of GATA-2 in mouse aortic endothelial (MAE) cells significantly (P < 0.0001) reduced Itgb3 mRNA levels (Figure 8E). In aggregate, the data indicate that GATA-2 directly regulates Itgb3/ITGB3 transcription. Though Fermt3 expression was dysregulated in +9.5–/– PECAM-1+ cells (Figure 8C), and endogenous GATA-2 occupied FERMT3 in HUVECs (Figure 8D), knocking down GATA-2 in MAE cells did not influence Fermt3 expression (data not shown). The global gene expression analysis indicated that the cis-element deletion dysregulates multiple components of a GATA-2–dependent genetic network, including established regulators of vascular integrity and remodeling.
Figure 8. Mechanisms underlying the vascular integrity defect of +9.5–/– embryos.

(A) Microarray-based comparison of gene expression in PECAM-1–positive cells purified from E12.5 +9.5+/+ and +9.5–/– embryos. A single-cell suspension was generated from the embryo proper lacking the fetal liver, and PECAM-1–positive cells were isolated by adsorption to magnetic beads loaded with anti–PECAM-1 antibody. Microarray analysis was conducted with four +9.5+/+ and four +9.5–/– embryos, and statistically significant downregulated and upregulated genes are shown in the heat map. (B) Gene ontology analysis of genes downregulated in +9.5–/– embryos using the DAVID Bioinformatics Program ( http://david.abcc.ncifcrf.gov/). A P value of 0.05 was used as the standard cutoff level. org., organization. (C) Quantitative RT-PCR validation of gene expression changes in PECAM-1+ cells. (D) ChIP-seq profiles of endogenous GATA-2 occupancy of ITGB3 and FERMT3 loci in HUVECs. (E) Itgb3 downregulation in MAE cells upon siRNA-mediated knockdown of GATA-2. Left: Representative Western blot showing the extent of GATA-2 knockdown. Right: Dot plot of Itgb3 mRNA levels in MAE cells treated with control or Gata2 siRNA, respectively. Each dot represents data from a single experiment, and data from 13 independent experiments are shown. Mean and SEM are indicated by long and short horizontal bars, respectively (P < 0.0001).
Discussion
Herein, we demonstrate that a Gata2 cis-element disrupted in an immunodeficiency patient with impaired hematopoiesis is crucial for conferring Gata2 expression in HSPCs and endothelium. These results establish the mechanism underlying GATA-2 expression in definitive HSPCs and embryonic endothelium and reveal a novel GATA-2 function to control vascular integrity (Figure 9). Importantly, mechanistic studies with our murine model revealed that the +9.5 kb site is absolutely required for establishment of the definitive fetal liver HSPC compartment, but not for the functionality of primitive hematopoietic precursors.
Figure 9. Master regulatory activity of the +9.5 kb cis-element to establish the fetal liver HSPC compartment and vascular integrity.

Genetic ablation of the E-box–GATA composite element, which is disrupted as a heterozygous mutation in a MonoMAC patient, severely impaired hematopoiesis and mechanisms that confer vascular integrity. This element is therefore a critical mechanistic determinant of endogenous Gata2 expression in vivo in important target tissues, and its integrity is essential for opposing hematologic disorders.
Genome-wide expression analyses provided evidence for a GATA-2/integrin β3 regulatory axis (Figure 9). As knockout of Itgb3 and Fermt3 in the mouse revealed their important functions in controlling vascular integrity (48, 49), and FERMT3 knockdown in human endothelial cells disrupted integrin-dependent adhesion and tube formation (50), one would predict that the simultaneous downregulation of both components would severely disrupt vascular integrity. The consequences of downregulating both components simultaneously have not been described, and importantly, integrin β3 and kindlin-3 have not been linked previously to GATA-2 function.
Given the crucial GATA-2 function of generating the definitive HSPC compartment in the fetal liver and conferring vascular integrity, we deemed this sequence a “master regulatory cis-element” that orchestrates essential biological processes (Figure 9). We are unaware of other cis-element knockouts that prevent the genesis of stem and/or progenitor cells and disrupt multiple developmental processes. Targeted deletion of a high-affinity GATA motif on the Gata1 promoter ablated eosinophils without disrupting embryogenesis (51), while deletion of a GATA motif–containing upstream region at Gata1 (8-kb deletion) selectively reduced megakaryocyte gene expression and platelet counts (52).
In conjunction with our prior genetic analyses (29, 30), results obtained with the +9.5–/– mouse model provide strong evidence that different GATA factor binding regions at endogenous loci differ both quantitatively and qualitatively in their activities to control target gene transcription. Relative to the –2.8 and –1.8 kb sites (29, 30), the +9.5 kb site exerts unique and exceptionally important functions. An obvious question is whether the +9.5 kb site is required for factor occupancy at other GATA switch sites, but given that deletion of these other sites does not yield devastating phenotypes, they are not required for critical +9.5 kb site functions.
What attributes endow the +9.5 kb site with its critical functions? Its unique features include intronic localization and the composite element. The precise sequence of the element occurs only once in the genome. Permitting sequence flexibility in the spacer revealed 797 composite elements, with the majority in introns (304 elements), 10–100 kb from genes (178 elements), and in deserts greater than 100 kb from genes (237 elements), with only 8 at promoters (Supplemental Table 1). Given this complex cohort of composite element–containing genes, the robust GATA-2 target gene ensemble in human erythroid (27) and endothelial (43, 44) cells, and the cohort of GATA-2 target genes described herein, it seems unlikely that the phenotypes of the +9.5–/– embryos reflect disruption of a simple epistatic relationship between GATA-2 and a single key target gene.
Strikingly, the +9.5 kb cis-element that we targeted in the mouse genome emerged as a heterozygous deletion in a MonoMAC patient (Figure 1B). Given the autosomal dominant heterozygous MonoMAC mutation, it is particularly instructive to consider the functional consequences of heterozygous +9.5 kb site mutations. +9.5+/– embryos were viable (Figure 2D) but had significantly reduced definitive hematopoietic stem/progenitor activity in the fetal liver (Figure 4E and Figure 5) and significant molecular defects in the expression of Gata2 and its target genes in the fetal liver and in embryonic PECAM-1+ cells (Figure 7A). Prior studies indicated that Gata2+/– hematopoietic stem cells exhibit reduced long-term repopulating activity, although the heterozygous mutant mice are viable, and the adult animals are not overtly anemic (53, 54). Given the molecular and cellular deficits in the +9.5+/– mice and the composite element disruption in a MonoMAC patient, it is attractive to consider the utility of our mutant mouse strain for testing whether pathogens detected in MonoMAC patients trigger the exhaustion of hematopoietic stem and/or progenitor cells, which would thus yield a novel model of myelodysplasia and/or leukemia.
In summary, despite a plethora of GATA motifs at the GATA2 locus and prior knockouts of Gata2 GATA motifs without associated lethality or devastating phenotypes, our analysis pinpointed a single cis-element required for Gata2 expression in the fetal liver and embryonic endothelial cells. The cis-element was essential for establishment of the definitive HSPC compartment in the fetal liver and for conferring vascular integrity. A heterozygous disruption of this element in a MonoMAC patient lacking GATA2 coding region mutations provides additional evidence for the crucial functions of the +9.5 composite element. In contrast to the Gata2 knockouts (2) — which die at E10.5 of severe anemia but do not exhibit vascular phenotypes — our model permits several days of subsequent embryonic development, which revealed novel GATA-2 functions. The dual hematopoietic and vascular phenotypes offer a particularly attractive system for future studies to establish principles of how master regulatory cis-elements function at endogenous loci and to further model the functional consequences of changes in GATA2 expression/activity that characterize specific human pathologies.
Methods
Human genetic analysis.
The patient was diagnosed previously with the clinical and laboratory syndrome of MonoMAC. Genomic DNA was extracted from an EBV-transformed lymphoblastoid cell line (Gentra Puregene DNA isolation kit, QIAGEN). Primers for exons and flanking splice sites of human GATA2 were designed using Primer Select (DNAstar Lasergene) and are listed below. Genomic amplification was performed with Platinum PCR Supermix High Fidelity (Invitrogen) using 5% DMSO, and 35 rounds of 96°C for 20 seconds, then 68°C extension for 3 minutes. Samples were treated with ExoSAP (USB), and 1 μl of the resulting product was used in sequencing reactions. Sequencing was performed using BigDye Terminators v3.1 (Applied Biosystems), purified with a Performa DTR short well plate kit (Edge Biosystems), analyzed on an Applied Biosystems 3730XL sequencer, and aligned to the consensus sequence NM_001145661.1 plus 6 kb upstream using Sequencher software (Gene Codes Corp.).
PBMCs were isolated using a Ficoll gradient. The granulocyte-containing pellet was used to isolate RNA. PBMCs were washed in Dulbecco’s PBS and resuspended in Hank’s calcium- and magnesium-free balanced salt solution, supplemented with 0.2% bovine serum albumin. PBMCs were stained at 4°C with CD3-FITC, CD19-allophycocyanin (CD19-APC), CD56-phycoerythrin (CD56-PE) (BD Biosciences — Pharmingen), and CD14–PE-Cy7 (eBiosciences) for 20 minutes, washed in ice-cold azide-free FACS buffer, resuspended at approximately 20 million cells/ml, and filtered. Populations were sorted on a BD Influx cell sorter (BD Biosciences) at 40 psi using a 70-μm nozzle to isolate monocytes (SSChi, CD14+) and CD3+ T cells (SSClo, CD3+). RNA was isolated from CD14+ and CD3+ samples using RNeasy Mini columns (QIAGEN). RNA was not isolated from CD19+ (B cells) and CD3–CD56+ (NK cell) samples because there was insufficient material. Monocyte and T cell RNA was reverse transcribed using Superscript III First Strand synthesis system (Invitrogen). Half of the CD3+ cells were lysed, and DNA was isolated using a Gentra Puregene DNA isolation kit. cDNA was amplified by PCR in an ABI 7500 Real-Time PCR System using Taqman SNP genotyping assay for exonic SNP rs34799090 (Applied Biosystems). Genomic DNA from the patient was used as the heterozygous normalization control. Data were analyzed using the 2–ΔΔCT method and results expressed as mean relative expression of the minor (G) versus the major (C) allele.
Generation of Gata2 Δ+9.5 mutant mice.
A 46-bp region containing the Gata2 intronic E-box WGATAR composite element was replaced with a LoxP-PGKneo-LoxP cassette via homologous recombination. The targeting vector consisted of 4.2-kb and 4.1-kb homology arms flanking the +9.5 element, which were cloned into the targeting vector pfloxA2 (Figure 2). Gene-targeted CJ9 ES cell clones were screened by PCR using primers flanking the homology arms in combination with primers annealing within the NeoR cassette to identify appropriately recombined alleles. Targeting was confirmed by Southern blotting. Chimeric mice were generated by blastocyst injection, and F1 pups were screened for germline transmission by PCR. NeoR was excised by mating animals to mice of the CMV-Cre–expressing strain B6.C-Tg(CMV-cre)1Cgn/J (Jackson Laboratory). Cre-mediated excision of NeoR in the progeny was confirmed by PCR using primers flanking the targeted sequence.
Preparation of mouse embryos and tissues.
Staged embryos were obtained from timed matings of Gata2 Δ+9.5 heterozygotes. Pregnant females were euthanized with CO2, and the uterus was removed into IMDM containing 10% FBS. Embryo viability was scored by the presence of a beating heart. Fresh embryos were photographed prior to fixation or dissection. Fresh tissues and organs were harvested in cold PBS for RNA extraction or in IMDM containing 10% FBS for flow cytometry. Fixed (4% paraformaldehyde for 24–48 hours), paraffin-embedded embryos were sectioned to a thickness of 5 μm and H&E stained.
Immunohistochemical analysis.
For PECAM-1 staining, embryos were fixed 48 hours at 4°C in zinc fixative (100 mM Tris; 36.8 mM zinc chloride; 22.8 mM zinc acetate dihydrate; 2.8 mM calcium acetate monohydrate; pH 6.8). Paraffin-embedded 0.6-μM sections were cleared in Citrisolv (Fisher Scientific) and rehydrated, and endogenous peroxidase activity was blocked in 3% hydrogen peroxide for 20 minutes. Sections were blocked with 10% goat serum in PBS, 0.5% Tween-20 for 1 hour at 25°C. Detection of PECAM-1 was performed with 1 μg/ml rat anti-CD31 (553370, BD Biosciences — Pharmingen) in PBS, 0.1% Tween-20 (PBST) for 1 hour at 37°C, followed by 2.5 μg/ml biotinylated goat anti-rat IgG (BA-9401, Vector Laboratories) in PBST for 1 hour at 25°C and Vectastain Elite ABC-HRP (PK-6100, Vector Laboratories) for 45 minutes at 25°C. Visualization was performed with the ImmPACT DAB substrate kit (SK-4105, Vector Laboratories). Sections were counterstained with Harris hematoxylin (Fisher Scientific) prior to mounting. Human bone marrow samples were analyzed by H&E staining, Wright-Giemsa staining, and immunohistochemistry as described previously (42).
Colony assays.
For EryP colony assays, individual E8.0 embryos/yolk sacs were digested in 0.02% trypsin at 37°C for 5 minutes, followed by mechanical disruption by passage through a 25-g needle. 15% of each sample was reserved for genotype analysis, and the remaining cells were cultured in IMDM-based plating medium containing 1% methylcellulose (M3134, Stemcell Technologies), 10% plasma-derived serum (Animal Technologies), 5% protein-free hybridoma medium (PFHM-II, Invitrogen), 1% penicillin/streptomycin (Mediatech), 2 mM glutamine (Mediatech), 12.5 μg/ml ascorbic acid (Sigma-Aldrich), 600 μM 1-thioglycerol (Sigma-Aldrich), and 2 U/ml human erythropoietin (Amgen) as previously described (45). Cultures were maintained humidified at 37°C, 5% CO2 for 5 days prior to counting of EryP colonies. For fetal liver colony assays, dissociated cells from E12.5 embryos were plated in duplicate in Methocult M03434 complete medium (Stemcell Technologies) at a density of 2 × 10⁴ cells per 35-mm plate. Plates were incubated for 12 days according to the manufacturer’s recommendation, and colonies were identified and counted using an Olympus SZX16 stereomicroscope.
Flow cytometry.
Fetal liver cells from E12.5 individual embryos were resuspended in PBS with 2% FBS and passed through 25-μm cell strainers to obtain single-cell suspensions prior to antibody staining. Surface proteins were detected with FITC-conjugated antibodies B220 (RA3-6B2), CD3 (no. 145-2C11), CD4 (no. 11-0041), CD5 (no. 53-7.3), CD8 (no. 11-0081-86), CD41 (no. 11-0411), CD48 (no. 11-0481), Gr-1 (RB6-8C5), and TER-119 (no. 11-5921-85); PE-conjugated antibodies CD71 (R17217), CD150 (115904, Biolegend), and Sca-1 (E13-161.7); PE-Cy7–conjugated Mac1 (no. 25-0112); PerCP-Cy5.5–conjugated Sca-1 (no. 45-5981); and allophycocyanin-conjugated (APC-conjugated) c-Kit (2B8) antibodies. Lineage markers were stained with FITC-conjugated B220, CD3, CD4, CD5, CD8, Gr-1, and TER-119 antibodies. All antibodies were purchased from eBiosciences unless otherwise stated. The stained cells were collected on a FACSCalibur flow cytometer (BD Biosciences), except fetal liver HSCs (Lin[CD3,CD4,CD5,CD8,B220,TER-119,Gr-1]–CD41–CD48–Mac1+CD150+Kit+Sca+) (55, 56), which were analyzed on a LSR II flow cytometer (BD Biosciences). The data were analyzed using FlowJo v9.0.2 software (TreeStar).
Transplantation of fetal liver cells.
Adult C57BL/6 recipient mice (CD45.1+, 6–8 weeks old; NCI) were lethally irradiated with a cesium source for a single dose of 10 Gy. Fetal liver cells were harvested from individual E12.5 embryos (CD45.2+) and combined based on their genotypes. A total of 150,000 live nucleated fetal liver cells were mixed with same number of CD45.1+ bone marrow cells and injected into individual irradiated CD45.1+ recipients. The transplant recipient mice were maintained on trimethoprim/sulfamethoxazole-treated water for 2 weeks. Blood was obtained from the retro-orbital venous sinus regularly after transplantation and analyzed using flow cytometry for donor-derived hematopoiesis as described previously (57).
Gene expression analysis.
Gene expression was measured by quantitative RT-PCR of RNA extracted from hematopoietic (fetal liver), neuronal (brain), and endothelial (PECAM-1–positive) tissues and converted to cDNA. Brains were isolated with surrounding tissue by microdissection of the head above the eyes. For endothelial cells, individual embryos lacking livers and hearts were subjected to 1-hour collagenase (2 mg/ml) digestion at 37°C to obtain single-cell suspensions. PECAM-1–expressing cells were isolated by positive selection using Dynabeads sheep anti-rat IgG (Invitrogen) coated with rat anti-CD31 (clone MEC 13.3, BD Biosciences — Pharmingen) according to manufacturer’s recommendation. Isolated tissues were dissociated by passing through 16-g or 21-g needles, and RNA was extracted using TRIzol reagent (Invitrogen).
Expression profiling of PECAM-1–enriched endothelial cell RNA was performed by the McArdle Laboratory Microarray Facility (Madison, WI) using Agilent SurePrint G3 Mouse GE 8 × 60K Microarrays following the Agilent one-color microarray-based gene expression analysis protocol. We median-centered the arrays of 4 independent +9.5+/+ and +9.5–/– embryos and filtered out the bottom 10% of the probes with the lowest SD across combined wild-type and mutant samples. The differential expression analysis between the mutant and the wild-type samples was conducted with the R package Limma (58). The reported results are based on controlling the false discovery rate at 5% with the Benjamini-Hochberg method (59). The data reported in this article have been deposited in the Gene Expression Omnibus database (GEO accession number GSE39300).
Cell culture.
MAE cells (60) were cultured in Medium 200 containing Low Serum Growth Supplement and penicillin/streptomycin as recommended by the manufacturer (Gibco). Control or Gata2 siRNA SMARTpools (Dharmacon) were introduced into MAE cells using the Amaxa Nucleofector II, program T27 and the Amaxa Basic Nucleofector Kit for primary endothelial cells (VPI-1001, Lonza). For each transfection 1 × 10⁶ MAE cells and 450–600 pmol siRNA were used. Cells were cultured 30–48 hours prior to RNA isolation.
Primers.
The primers used for genotyping NeoR-integrated mice were as follows: 5′ homology arm, 5′-GCTTGTGGACATTCCTAGGTTGGAGGGAT-3′ and 5′-GCTCTATGGCTTCTGAGGCGGAAAG-3′; 3′ homology arm, 5′-CTCGACCTGCAGCCCAAGCTGAT-3′ and 5′-CATGAGAAACCTCCTTGATGAGAGACAGACT-3′.
The primers used for genotyping NeoR-excised mice were as follows: +9.5 flanking, 5′-ATGTCCTTTCGGATCTCCTGCC-3′ and 5′-GGTAAACAGAGCGCTACTCCTGTGTGTT-3′.
The primers used to quantitate mRNA levels were as follows: Gata2 mRNA, 5′-GCAGAGAAGCAAGGCTCGC-3′ and 5′-CAGTTGACACACTCCCGGC-3′; Itgb3 mRNA, 5′-ACGTCCTCCAGCTCATTGTTG-3′ and 5′-TGAGGCAGGTGGCATTGAA-3′; and Fermt3 mRNA, 5′-TGACCTGACAAAGGTTGTCTTAGCT-3′ and 5′-GCATGTGGTAACAAGCCTCAGTC-3′.
The primers used for human sequencing were as follows: Ex 5F amp 5′-AAGACGGGGTGGGGCAGACACAGTTGGGTAGAAAG-3′; Ex 5R amp/seq 5′-GGCCCCCAAAGCAGGGAACGATTTAAGCCTCATA-3′; Ex5F seq 5′-TGCTTTCCTGCCCTGGACTCCCTCCCGAGAACTTG-3′; C1amp 5′-TGTGTTGCGGTGGGTGTTTGTGTCTGCGTATC-3′; C1amp 5′-GGGCCTCCCATCTCTTTCCCCACTCCTTGTCTC-3′; C2amp 5′-GGCCCTCAGGGTGGGGTGGATGAAGAGAAATGGA-3′; C2amp 5′-CGGGCACACCGGGGCGCACACTCAGT-3′; C3amp 5′-CACGGGAGACTTTCTTGACCAAAACGGAATGTGC-3′; C3amp 5′-GTTAGTCTGGCCCTGGGGAACAGCAGTGACAAA-3′.
Statistics.
For quantitative measurement of cells, cell colonies, or mRNA, the results are presented as mean ± SEM except where indicated. Determination of significance was conducted using the 2-tailed unpaired Student’s t test, except for the analysis of GATA-2 knockdown in MAE cells (Figure 8E), in which a paired Student’s t test was applied. For the primary human samples, differences between groups were assessed by 1-way ANOVA Dunnett test comparing columns to the genomic sample. A P value less than 0.05 was considered significant.
Study approval.
All animal experiments were conducted with the ethical approval of the International Association for Assessment and Accreditation of Laboratory Animal Care at the University of Wisconsin–Madison. All patient samples were collected with written informed consent under a protocol approved by the NIH.
Supplementary Material
Acknowledgments
This research was supported by NIH grants DK68634 and DK50107 to E.H. Bresnick; HG006716 to S. Keles; CA152108, Howard Temin Award, Shaw Scientist Award, ASH Scholar Award, and V Foundation Scholar Award to J. Zhang; and American Heart Association postdoctoral fellowship to M.J. Ryu; and by the NIH/NCI P30 CA014520 — UW Comprehensive Cancer Center. This work was supported in part by the Division of Intramural Research, NIAID NIH. The content does not necessarily reflect the views or policies of the Department of Health and Human Services, nor does mention of trade names, commercial products, and organizations imply endorsement by the United States government. We appreciate advice and discussion with the NIDDK Center of Excellence in Hematology at Children’s Hospital, Harvard Medical School. GATA-2 ChIP-seq data were produced by Peggy Farnham (University of Southern California). Data generation/analysis was supported by National Human Genome Research Institute (NHGRI) funds as part of the ENCODE Project. We thank Peggy Farnham and the Data Coordination Center at UCSC for providing access to this data. We acknowledge the technical assistance of Amelia Linnemann in facilitating initial ChIP-seq data analysis and Margaret Baron for sharing the protocol to quantitate primitive hematopoietic precursor colony-forming activity.
Footnotes
Conflict of interest: The authors have declared that no conflict of interest exists.
Citation for this article: J Clin Invest. 2012;122(10):3692–3704. doi:10.1172/JCI61623.
References
- 1.Lassar AB, Paterson BM, Weintraub H. Transfection of a DNA locus that mediates the conversion of 10T1/2 fibroblasts to myoblasts. Cell. 1986;47(5):649–656. doi: 10.1016/0092-8674(86)90507-6. [DOI] [PubMed] [Google Scholar]
- 2.Tsai FY, et al. An early haematopoietic defect in mice lacking the transcription factor GATA-2. Nature. 1994;371(6494):221–226. doi: 10.1038/371221a0. [DOI] [PubMed] [Google Scholar]
- 3.Tsai F-Y, Orkin SH. Transcription factor GATA-2 is required for proliferation/survival of early hematopoietic cells and mast cell formation, but not for erythroid and myeloid terminal differentiation. Blood. 1997;89(10):3636–3643. [PubMed] [Google Scholar]
- 4.Nardelli J, Thiesson D, Fujiwara Y, Tsai F-Y, Orkin SH. Expression and genetic interaction of transcription factors GATA-2 and GATA-3 during development of the mouse central nervous system. Dev Biol. 1999;210(2):305–321. doi: 10.1006/dbio.1999.9278. [DOI] [PubMed] [Google Scholar]
- 5.Zhou Y, Yamamoto M, Engel JD. GATA2 is required for the generation of V2 interneurons. Development. 2000;127(17):3829–3838. doi: 10.1242/dev.127.17.3829. [DOI] [PubMed] [Google Scholar]
- 6.Craven SE, Lim KC, Ye W, Engel JD, de Sauvage F, Rosenthal A. Gata2 specifies serotonergic neurons downstream of sonic hedgehog. Development. 2004;131(5):1165–1173. doi: 10.1242/dev.01024. [DOI] [PubMed] [Google Scholar]
- 7.Tong Q, Dalgin G, Xu H, Ting CN, Leiden JM, Hotamisligil GS. Function of GATA transcription factors in preadipocyte-adipocyte transition. Science. 2000;290(5489):134–138. doi: 10.1126/science.290.5489.134. [DOI] [PubMed] [Google Scholar]
- 8.Tsai J, Tong Q, Tan G, Chang AN, Orkin SH, Hotamisligil GS. The transcription factor GATA2 regulates differentiation of brown adipocytes. EMBO Rep. 2005;6(9):879–884. doi: 10.1038/sj.embor.7400490. [DOI] [PMC free article] [PubMed] [Google Scholar]
- 9.Wilson DB, Dorfman DM, Orkin SH. A nonerythroid GATA-binding protein is required for function of the human preproendothelin-1 promoter in endothelial cells. Mol Cell Biol. 1990;10(9):4854–4862. doi: 10.1128/mcb.10.9.4854. [DOI] [PMC free article] [PubMed] [Google Scholar]
- 10.Lee ME, Temizer DH, Clifford JA, Quertermous T. Cloning of the GATA binding protein that regulates endothelin-1 gene expression in endothelial cells. J Biol Chem. 1991;266(24):16188–16192. [PubMed] [Google Scholar]
- 11.Mammoto C, et al. A mechanosensitive transcriptional mechanism that controls angiogenesis. Nature. 2009;457(7233):1103–1108. doi: 10.1038/nature07765. [DOI] [PMC free article] [PubMed] [Google Scholar]
- 12.Bresnick EH, Katsumura KR, Lee HY, Johnson KD, Perkins AS. Master regulatory GATA transcription factors: mechanistic principles and emerging links to hematologic malignancies. Nucleic Acids Res. 2012;40(13):5819–5831. doi: 10.1093/nar/gks281. [DOI] [PMC free article] [PubMed] [Google Scholar]
- 13.Hsu AP, et al. Mutations in GATA2 are associated with the autosomal dominant and sporadic monocytopenia and mycobacterial infection (MonoMAC) syndrome. Blood. 2011;118(10):2653–2655. doi: 10.1182/blood-2011-05-356352. [DOI] [PMC free article] [PubMed] [Google Scholar]
- 14.Vinh DC, et al. Autosomal dominant and sporadic monocytopenia with susceptibility to mycobacteria, fungi, papillomaviruses, and myelodysplasia. Blood. 2010;115(8):1519–1529. doi: 10.1182/blood-2009-03-208629. [DOI] [PMC free article] [PubMed] [Google Scholar]
- 15.Dickinson RE, et al. Exome sequencing identifies GATA-2 mutation as the cause of dendritic cell, monocyte, B and NK lymphoid deficiency. Blood. 2011;118(10):2656–2658. doi: 10.1182/blood-2011-06-360313. [DOI] [PMC free article] [PubMed] [Google Scholar]
- 16.Hahn CH, et al. Heritable GATA2 mutations associated with familial myelodysplastic syndrome and acute myeloid leukemia. Nat Genet. 2011;43(10):1012–1017. doi: 10.1038/ng.913. [DOI] [PMC free article] [PubMed] [Google Scholar]
- 17.Ostergaard P, et al. Mutations in GATA2 cause primary lymphedema associated with a predisposition to acute myeloid leukemia (Emberger syndrome). Nat Genet. 2011;43(10):929–931. doi: 10.1038/ng.923. [DOI] [PubMed] [Google Scholar]
- 18.Vicente C, et al. Overexpression of GATA2 predicts an adverse prognosis for patients with acute myeloid leukemia and it is associated with distinct molecular abnormalities. Leukemia Sept. 2011;9(3):1–5. doi: 10.1038/leu.2011.235. [DOI] [PubMed] [Google Scholar]
- 19.Zhang SJ, Shi JY, Li JY. GATA-2 L359V mutation is exclusively associated with CML progression but not other hematological malignancies and GATA-2 P250A is a novel single nucleotide polymorphism. Leuk Res. 2009;33(8):1141–1143. doi: 10.1016/j.leukres.2009.02.025. [DOI] [PubMed] [Google Scholar]
- 20.Zhang SJ, et al. Gain-of-function mutation of GATA-2 in acute myeloid transformation of chronic myeloid leukemia. Proc Natl Acad Sci U S A. 2008;105(6):2076–2081. doi: 10.1073/pnas.0711824105. [DOI] [PMC free article] [PubMed] [Google Scholar]
- 21.Connelly JJ, et al. GATA2 is associated with familial early-onset coronary artery disease. PLoS Genet. 2006;2(8):1265–1273. doi: 10.1371/journal.pgen.0020139. [DOI] [PMC free article] [PubMed] [Google Scholar]
- 22.Maeno M, et al. The role of BMP-4 and GATA-2 in the induction and differentiation of hematopoietic mesoderm in Xenopus laevis. Blood. 1996;88(6):1966–1972. [PubMed] [Google Scholar]
- 23.Friedle H, Knochel W. Cooperative interaction of Xvent-2 and GATA-2 in the activation of the ventral homeobox gene Xvent-1B. J Biol Chem. 2002;277(26):23871–23881. doi: 10.1074/jbc.M201831200. [DOI] [PubMed] [Google Scholar]
- 24.Ghatpande S, Ghatpande A, Sher J, Zile MH, Evans T. Retinoid signaling regulates primitive (yolk sac) hematopoiesis. Blood. 2002;99(7):2379–2386. doi: 10.1182/blood.V99.7.2379. [DOI] [PubMed] [Google Scholar]
- 25.Grass JA, Boyer ME, Pal S, Wu J, Weiss MJ, Bresnick EH. GATA-1-dependent transcriptional repression of GATA-2 via disruption of positive autoregulation and domain-wide chromatin remodeling. Proc Natl Acad Sci U S A. 2003;100(15):8811–8816. doi: 10.1073/pnas.1432147100. [DOI] [PMC free article] [PubMed] [Google Scholar]
- 26.Grass JA, et al. Distinct functions of dispersed GATA factor complexes at an endogenous gene locus. Mol Cell Biol. 2006;26(19):7056–7067. doi: 10.1128/MCB.01033-06. [DOI] [PMC free article] [PubMed] [Google Scholar]
- 27.Fujiwara T, et al. Discovering hematopoietic mechanisms through genome-wide analysis of GATA factor chromatin occupancy. Mol Cell. 2009;36(4):667–681. doi: 10.1016/j.molcel.2009.11.001. [DOI] [PMC free article] [PubMed] [Google Scholar]
- 28.Bresnick EH, Lee HY, Fujiwara T, Johnson KD, Keles S. GATA switches as developmental drivers. J Biol Chem. 2010;285(41):31087–31093. doi: 10.1074/jbc.R110.159079. [DOI] [PMC free article] [PubMed] [Google Scholar]
- 29.Snow JW, et al. Context-dependent function of “GATA switch” sites in vivo. Blood. 2011;117(18):4769–4772. doi: 10.1182/blood-2010-10-313031. [DOI] [PMC free article] [PubMed] [Google Scholar]
- 30.Snow JW, et al. A single cis-element maintains repression of the key developmental regulator Gata2. PLOS Genet. 2010;6(9):e1001103. doi: 10.1371/journal.pgen.1001103. [DOI] [PMC free article] [PubMed] [Google Scholar]
- 31.Bender MA, et al. Targeted deletion of 5′HS1 and 5′HS4 of the beta-globin locus control region reveals additive activity of the DNaseI hypersensitive sites. Blood. 2001;98(7):2022–2027. doi: 10.1182/blood.V98.7.2022. [DOI] [PubMed] [Google Scholar]
- 32.Brandt W, Khandekar M, Suzuki N, Yamamoto M, Lim KC, Engel JD. Defining the functional boundaries of the Gata2 locus by rescue with a linked bacterial artificial chromosome transgene. J Biol Chem. 2008;283(14):8976–8983. doi: 10.1074/jbc.M709364200. [DOI] [PMC free article] [PubMed] [Google Scholar]
- 33.Jessen JR, et al. Modification of bacterial artificial chromosomes through chi-stimulated homologous and its application in zebrafish transgenesis. Proc Natl Acad Sci U S A. 1998;95(9):5121–5126. doi: 10.1073/pnas.95.9.5121. [DOI] [PMC free article] [PubMed] [Google Scholar]
- 34.Wozniak RJ, Boyer ME, Grass JA, Lee Y-S, Bresnick EH. Context-dependent GATA factor function: combinatorial requirements for transcriptional control in hematopoietic and endothelial cells. J Biol Chem. 2007;282(19):14665–14674. doi: 10.1074/jbc.M700792200. [DOI] [PubMed] [Google Scholar]
- 35.Wozniak RJ, et al. Molecular hallmarks of endogenous chromatin complexes containing master regulators of hematopoiesis. Mol Cell Biol. 2008;28(21):6681–6694. doi: 10.1128/MCB.01061-08. [DOI] [PMC free article] [PubMed] [Google Scholar]
- 36.Khandekar M, et al. A Gata2 intronic enhancer confers its pan-endothelia-specific regulation. Development. 2007;134(9):1703–1712. doi: 10.1242/dev.001297. [DOI] [PubMed] [Google Scholar]
- 37.O’Neil J, Look AT. Mechanisms of transcription factor deregulation in lymphoid cell transformation. Oncogene. 2007;26(47):6838–6849. doi: 10.1038/sj.onc.1210766. [DOI] [PubMed] [Google Scholar]
- 38.Wadman IA, et al. The LIM-only protein Lmo2 is a bridging molecule assembling an erythroid, DNA-binding complex which includes the TAL1, E47, GATA-1 and Ldb1/NLI proteins. EMBO J. 1997;16(11):3145–3157. doi: 10.1093/emboj/16.11.3145. [DOI] [PMC free article] [PubMed] [Google Scholar]
- 39.Lecuyer E, et al. The SCL complex regulates c-kit expression in hematopoietic cells through functional interaction with Sp1. Blood. 2002;100(7):2430–2440. doi: 10.1182/blood-2002-02-0568. [DOI] [PubMed] [Google Scholar]
- 40.Xu Z, Meng X, Cai Y, Liang H, Nagarajan L, Brandt SJ. Single-stranded DNA-binding proteins regulate the abundance of LIM domain and LIM domain-binding proteins. Genes Dev. 2007;21(8):942–955. doi: 10.1101/gad.1528507. [DOI] [PMC free article] [PubMed] [Google Scholar]
- 41.Grass JA, Boyer ME, Paul S, Wu J, Weiss MJ, Bresnick EH. GATA-1-dependent transcriptional repression of GATA-2 via disruption of positive autoregulation and domain-wide chromatin remodeling. Proc Natl Acad Sci U S A. 2003;100(15):8811–8816. doi: 10.1073/pnas.1432147100. [DOI] [PMC free article] [PubMed] [Google Scholar]
- 42.Calvo KR, et al. Myelodysplasia in autosomal dominant and sporadic monocytopenia immunodeficiency syndrome: diagnostic features and clinical implications. Haematologica. 2011;96(8):1221–1225. doi: 10.3324/haematol.2011.041152. [DOI] [PMC free article] [PubMed] [Google Scholar]
- 43.Linnemann AK, O’Geen H, Keles S, Farnham PJ, Bresnick EH. Genetic framework for GATA factor function in vascular biology. Proc Natl Acad Sci U S A. 2011;108(33):13641–13646. doi: 10.1073/pnas.1108440108. [DOI] [PMC free article] [PubMed] [Google Scholar]
- 44.Kanki Y, et al. Epigenetically coordinated GATA2 binding is necessary for endothelium-specific endomucin expression. EMBO J. 2011;30(13):2582–2595. doi: 10.1038/emboj.2011.173. [DOI] [PMC free article] [PubMed] [Google Scholar]
- 45.Isern J, et al. Single-lineage transcriptome analysis reveals key regulatory pathways in primitive erythroid progenitors in the mouse embryo. Blood. 2011;117(18):4924–4934. doi: 10.1182/blood-2010-10-313676. [DOI] [PMC free article] [PubMed] [Google Scholar]
- 46.Persons DA, et al. Enforced expression of the GATA-2 transcription factor blocks normal hematopoiesis. Blood. 1999;93(2):488–499. [PubMed] [Google Scholar]
- 47.Tipping AJ, et al. High GATA-2 expression inhibits human hematopoietic stem and progenitor cell function by effects on cell cycle. Blood. 2009;113(12):2661–2672. doi: 10.1182/blood-2008-06-161117. [DOI] [PubMed] [Google Scholar]
- 48.Moser M, Nieswandt B, Ussar S, Pozgajova M, Fassler R. Kindlin-3 is essential for integrin activation and platelet aggregation. Nat Med. 2008;14(3):325–330. doi: 10.1038/nm1722. [DOI] [PubMed] [Google Scholar]
- 49.Hodivala-Dilke KM, et al. Beta3-integrin-deficient mice are a model for Glanzmann thrombasthenia showing placental defects and reduced survival. J Clin Invest. 1999;103(2):229–238. doi: 10.1172/JCI5487. [DOI] [PMC free article] [PubMed] [Google Scholar]
- 50.Bialkowska K, et al. The integrin co-activator Kindlin-3 is expressed and functional in a non-hematopoietic cell, the endothelial cell. J Biol Chem. 2010;285(24):18640–18649. doi: 10.1074/jbc.M109.085746. [DOI] [PMC free article] [PubMed] [Google Scholar]
- 51.Yu C, et al. Targeted deletion of a high-affinity GATA-binding site in the GATA-1 promoter leads to selective loss of the eosinophil lineage in vivo. J Exp Med. 2002;195(11):1387–1395. doi: 10.1084/jem.20020656. [DOI] [PMC free article] [PubMed] [Google Scholar]
- 52.Shivdasani RA, Fujiwara Y, McDevitt MA, Orkin SH. A lineage-selective knockout establishes the critical role of transcription factor GATA-1 in mekagaryocyte growth and platelet development. EMBO J. 1997;16(13):3965–3973. doi: 10.1093/emboj/16.13.3965. [DOI] [PMC free article] [PubMed] [Google Scholar]
- 53.Rodrigues NP, et al. Haploinsufficiency of GATA-2 perturbs adult hematopoietic stem cell homeostasis. Blood. 2005;106(2):477–484. doi: 10.1182/blood-2004-08-2989. [DOI] [PubMed] [Google Scholar]
- 54.Ling KW, et al. GATA-2 plays two functionally distinct roles during the ontogeny of hematopoietic stem cells. J Exp Med. 2004;200(7):871–882. doi: 10.1084/jem.20031556. [DOI] [PMC free article] [PubMed] [Google Scholar]
- 55.Kim I, He S, Yilmaz OH, Kiel MJ, Morrison SJ. Enhanced purification of fetal liver hematopoietic stem cells using SLAM family receptors. Blood. 2006;108(2):737–744. doi: 10.1182/blood-2005-10-4135. [DOI] [PMC free article] [PubMed] [Google Scholar]
- 56.Kiel MJ, Yilmaz OH, Morrison SJ. CD150- cells are transiently reconstituting multipotent progenitors with little to no stem cell activity. Blood. 2008;111(8):4413–4414. doi: 10.1182/blood-2007-12-129601. [DOI] [PMC free article] [PubMed] [Google Scholar]
- 57.Zhang J, et al. Oncogenic Kras-induced leukemogenesis: hematopoietic stem cells as the initial target and lineage-specific progenitors as the potential targets for final leukemic transformation. Blood. 2009;113(6):1304–1314. doi: 10.1182/blood-2008-01-134262. [DOI] [PMC free article] [PubMed] [Google Scholar]
- 58.Smyth GK. Linear models and empirical Bayes methods for assessing differential expression in microarray experiments. Stat Appl Genet Mol Biol. 2004;3:Article 3. doi: 10.2202/1544-6115.1027. [DOI] [PubMed] [Google Scholar]
- 59.Benhamini Y, Hochberg Y. Controlling the false discovery rate: a practical and powerful approach to multiple testing. J R Statis Soc B. 1995;57(1):289–300. [Google Scholar]
- 60.Pal S, et al. An antiangiogenic neurokinin-B/thromboxane A2 regulatory axis. J Cell Biol. 2006;174(7):1047–1058. doi: 10.1083/jcb.200603152. [DOI] [PMC free article] [PubMed] [Google Scholar]
Associated Data
This section collects any data citations, data availability statements, or supplementary materials included in this article.