

Abstract
Huntington’s disease (HD) is a fatal, inherited neurodegenerative disorder caused by an expanded CAG repeat in the gene encoding huntingtin (HTT). Therapeutic approaches to lower mutant HTT (mHTT) levels are expected to proceed to human trials, but noninvasive quantification of mHTT is not currently possible. The importance of the peripheral immune system in neurodegenerative disease is becoming increasingly recognized. Peripheral immune cells have been implicated in HD pathogenesis, but HTT levels in these cells have not been quantified before. A recently described time-resolved Förster resonance energy transfer (TR-FRET) immunoassay was used to quantify mutant and total HTT protein levels in leukocytes from patients with HD. Mean mHTT levels in monocytes, T cells, and B cells differed significantly between patients with HD and controls and between pre-manifest mutation carriers and those with clinical onset. Monocyte and T cell mHTT levels were significantly associated with disease burden scores and caudate atrophy rates in patients with HD. mHTT N-terminal fragments detected in HD PBMCs may explain the progressive increase in mHTT levels in these cells. These findings indicate that quantification of mHTT in peripheral immune cells by TR-FRET holds significant promise as a noninvasive disease biomarker.
Introduction
Huntington’s disease (HD) is caused by an autosomal dominant pathogenic mutation, resulting in an expanded stretch of 36 or more glutamine residues in the N terminus of the huntingtin (HTT) protein (1). Mutant HTT (mHTT) expression in the CNS is the primary pathogenic factor for the development of HD, with increasing expression levels associated with disease severity and toxicity in various models (2–4). However, patients with HD also exhibit multiple systemic changes (5). We have previously demonstrated peripheral immune system dysfunction in HD, including increases in innate immune proteins in patient plasma, many of which track with disease progression (6). Inflammatory cytokines and chemokines are elevated in the plasma of patients with HD, the origin of which appears to be hyperreactive monocytes carrying the HD mutation (7, 8). Recent studies using peripherally administered kynurenine 3-monooxygenase inhibitors (9) and bone marrow transplantation (10) highlight further that the peripheral immune system is altered in HD. The hyperreactivity observed in monocytes is reflected by a similar pattern in HD microglia (7), and microglial activation is seen before symptom onset in HD mutation carriers (11). Peripheral immune dysfunction may be pathogenically important and could offer a window onto relevant CNS dysfunction.
Many putative therapeutic approaches for HD attempt to lower mHTT levels in the CNS or systemically. However, noninvasive means of quantifying mHTT in the CNS do not exist. Peripheral readouts may be of value in assessing the effects of systemically delivered HTT-lowering therapies, i.e., small molecules aimed at enhancing HTT clearance, and detecting peripheral effects of centrally delivered therapies. If mHTT levels track with disease progression, they may have value as markers of disease progression. Therefore, we aimed to use a recently described time-resolved Förster resonance energy transfer (TR-FRET) immunoassay (12) to quantify total HTT and mHTT levels in peripheral immune cells in patients with HD.
Results and Discussion
Whole blood was collected from 8 HD gene carriers without manifest disease (pre-manifest patients), 10 early-stage and 8 moderate-stage patients with HD, and 12 control subjects. Monocytes, T cells, and B cells were isolated using magnetic-activated cell sorting. Cheek swabs to harvest buccal epithelial cells were collected from 84 subjects from the same experimental groups. Multiple swabs and/or blood samples were taken from some subjects. TR-FRET was used for the immunodetection of mutant and total HTT protein using HTT-specific antibodies (ref. 12 and Figure 1). Most patients with HD express mHTT with polyglutamine repeat lengths of 40 to 50 residues (13), and the patient cohort used here was broadly within this range (Supplemental Table 1; supplemental material available online with this article; doi: 10.1172/JCI64565DS1). TR-FRET analysis of an allelic series of purified HTT with increasing polyglutamine repeat lengths showed 10- to 20-fold higher sensitivity for mHTT than that of the wild-type protein (Supplemental Figure 1 and Supplemental Methods). Quality control experiments using repeated freeze-thaw cycles and different antibody pairs and fluorophores indicated that the TR-FRET HTT assays were specific and reproducible (Supplemental Figure 2).
Figure 1. Relationship between HTT levels in peripheral immune cells and disease stage.

Total HTT and mHTT protein levels were quantified by TR-FRET in monocytes, T cells, and B cells. Total HTT quantification relies on simultaneous binding of 2B7 and 2166 anti-HTT antibodies. mHTT is quantified using the 2B7 antibody and a polyglutamine-specific antibody, MW1. (A) Total HTT levels in leukocytes showed no significant differences between patients with HD and control subjects or between HD gene carriers at different disease stages. (B) mHTT protein was detected in samples from patients with HD and pre-manifest HD mutation carriers, as compared with that in controls. Differences in mean mHTT levels in leukocytes were observed between pre-manifest and manifest HD patients (P < 0.01) and between pre-manifest and early-stage HD subjects (P = 0.051 and P < 0.05 for monocytes and T cells/B cells, respectively). Colored circles indicate multiple samples from a single subject. White circles indicate samples from individual subjects. Horizontal bars indicate the mean. Em, emission; Ex, excitation; N, N-terminal; C, C-terminal; Tb, terbium cryptate; polyQ, polyglutamine tract; pre-HD, pre-manifest HD sample; Early HD, early-stage HD sample; Moderate HD, moderate-stage HD sample.
Total HTT levels did not differ significantly (P > 0.05) between patients with HD and controls (Figure 1A). mHTT levels in each cell type showed statistically significant (P < 0.001) differences between patients with HD and controls. Mean mHTT levels increased with successive disease stage in each leukocyte cell type, with differences (P < 0.01) between pre-manifest HD patients and patients with HD (manifest HD patients) and between pre-manifest and early-stage HD patients (0.021 < P < 0.051) but not between patients with early-stage and moderate-stage HD (Figure 1B and Table 1). Such an increase was not observed in buccal cells (Supplemental Figure 3). Disease burden scores (14), which are based on an individual’s age and HTT CAG repeat length and correlate with clinically relevant end points (15), were calculated for each patient with HD. After adjustment for age and gender, there was a strong (P < 0.001) positive association between disease burden and mHTT in monocytes and T cells (Figure 2A and Table 1). A significant (P < 0.05) association was observed for B cells, but no evidence of an association was found in buccal epithelial cells (Supplemental Figure 4). Significant associations were also observed between CAG repeat length and mHTT (Supplemental Figure 5). No such associations were found between total HTT levels and disease burden score (data not shown).
Table 1.
P values for associations among cellular mHTT levels and disease stage and disease burden score, adjusted for age and gender
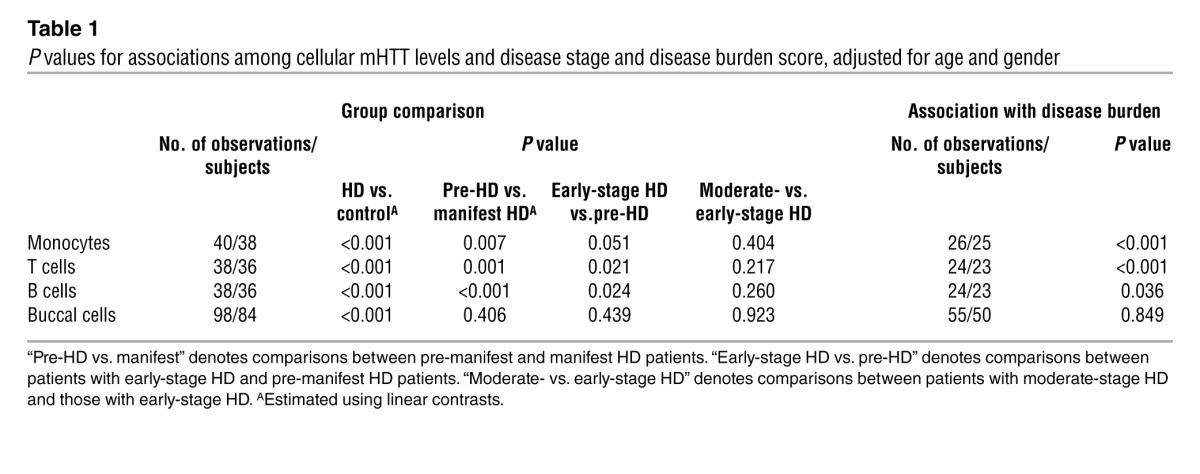
Figure 2. Associations among mHTT levels in peripheral immune cells and disease burden score and caudate atrophy rate.

(A) mHTT protein levels in leukocytes show a statistically significant positive association with HD disease burden score. Repeated measurements for a single subject are joined by a line. (B) mHTT levels in monocytes are significantly associated with caudate atrophy rates measured by serial volumetric MRI.
We also examined the relationship among leukocyte mHTT levels and rates of caudate and whole brain atrophy and ventricular expansion in a subset of subjects with HD who had undergone 3T MRI as part of the TRACK-HD study (15). Such atrophy rates provide a quantifiable measure of disease-associated changes in brain volume (15). mHTT levels in monocytes were significantly (P < 0.05) associated with rates of caudate and whole brain atrophy and ventricular expansion (Figure 2B, Supplemental Figure 6, and Supplemental Table 2). The associations with caudate and whole brain atrophy were borderline significant in T cells (P = 0.086 and P = 0.049, respectively). To investigate whether the association between brain atrophy and mHTT levels merely reflects their mutual associations with disease burden, this factor was adjusted for in a secondary analysis. The association between mHTT and brain atrophy remained significant or close to significant for caudate atrophy and ventricular expansion in monocytes (P = 0.007 and P = 0.093, respectively) and for caudate atrophy in T cells (P = 0.099) (Supplemental Table 2). These results must be interpreted cautiously due to the small sample size, but, to our knowledge, this is the first instance of a biochemical measure of a known pathogenic entity in peripheral cells that is significantly associated with measures of structural brain changes in a neurodegenerative disease.
There are several possible explanations for the progressive increase in mHTT levels in leukocytes with no concomitant differences in total HTT levels. An accumulation of mHTT over the life span of the cells is unlikely, because although some leukocytes are long-lived, monocytes typically persist for only 2 to 8 days in the bloodstream (16). Accumulation of extended CAG repeat expansions in the HTT gene due to somatic DNA instability, another possible explanation, is not seen in peripheral immune cells (17). Selective increases in mHTT expression as the disease develops cannot be excluded, but this seems improbable as total HTT levels did not change. The most likely explanation is a progressive accumulation of mHTT N-terminal fragments that are not detected in the TR-FRET total HTT signal.
mHTT fragments accumulate in HD rodent brain (18) and have been detected in HD patient brain postmortem (19, 20). Furthermore, HTT protein proteolysis has been demonstrated in lymphoblast cell lines from patients with HD (21). To identify HTT fragments in peripheral immune cells, a previously described unbiased immunoprecipitation and immunodetection strategy was used (18). This approach was chosen because although HTT fragments can be detected directly by Western blot, interpretation of such results is complicated by the cross-reactivity of some anti-HTT antibodies with other proteins. HTT was immunoprecipitated using anti-HTT antibodies (2B7, 2166, 4C9) from PBMCs from patients with early-stage HD and control subjects and immunodetected by Western blot (4C9, 2166) (Figure 3A). Several HTT fragments were immunoprecipitated, as detected by each of the anti-HTT antibodies.
Figure 3. mHTT protein fragments are present in HD PBMCs.

(A) HTT in PBMCs from 2 subjects with HD and an age-matched control was immunoprecipitated with 2166, 2B7, or 4C9 anti-HTT antibodies, as compared with that precipitated by an IgG control. Immunoprecipitates were blotted with 4C9 and 2166 anti-HTT antibodies. Several HTT-specific bands were found in HD patient and control subject PBMC samples. (B) HTT protein in PBMCs from 2 patients with early-onset HD (HTT CAG repeat lengths of 76 and 59) and an age-matched control was immunoprecipitated with 2B7, 3B5H10, or 2166 anti-HTT antibodies. Immunoprecipitates were blotted with either the polyglutamine-specific MW1 antibody or the 2166 anti-HTT antibody. Several mHTT-specific bands were found in the lysates from the PBMCs from the patients with early-onset HD (colored boxes), including N-terminal HTT fragments (yellow boxes) immunoprecipitated with the 2B7 and 3B5H10 antibodies but not with the more C-terminal epitope-binding 2166. ID, immunodetection; IgG heavy chain, antibody heavy chain.
Specifically detecting N-terminal mHTT fragments is difficult in samples in which the polyglutamine length is in the typical patient range of 40 to 50 CAG repeats. No antibodies are available that specifically detect either the wild-type or mHTT protein per se, and antibodies that distinguish between the two on the basis of polyglutamine-tract length only readily do so with many more CAG repeats. Therefore, HTT was detected in PBMCs isolated from patients with early-onset HD with 73 and 59 CAG repeats, compared with those from an aged-matched control subject (Figure 3B and Supplemental Figure 7). HTT was immunoprecipitated with the 2B7 and 2166 anti-HTT antibodies, as before, and also with the 3B5H10 antibody, which only recognizes an expanded polyglutamine tract and does not immunoprecipitate wild-type HTT. Similarly, HTT was immunodetected with the 2166 (Figure 3B) and 1H6 (Supplemental Figure 7) anti-HTT antibodies and also with the MW1 antibody (Figure 3B), which again only specifically recognizes an expanded polyglutamine tract. Using this approach, mHTT-specific fragments were readily identified in PBMCs from a patient with HD, compared with those from a control subject. Moreover, comparison of the mHTT fragments immunoprecipitated by the N-terminal 2B7 anti-HTT antibody with those from the more C-terminal 2166 antibody, indicated that some of the fragments were derived from the N terminus of the mHTT protein. This suggests that full-length mHTT is continuously cleaved to produce N-terminal fragments in patients’ peripheral immune cells.
Since noninvasive quantification of mHTT in CNS tissue or CSF in human subjects is not currently possible, the success of forthcoming trials to lower mHTT levels will rely on indirect pharmacodynamic outcome measures. Ex vivo testing of peripheral immune cells may be useful in identifying subjects in whom such therapies are most likely to succeed. Further research will determine whether the techniques described here can be used to monitor mHTT-lowering therapies that may be expected to elicit systemic effects. Quantifying the progressive, selective increase of mHTT protein levels in peripheral immune cells may provide a valuable means, alongside other measures, of monitoring disease progression in HD. The meaning of longitudinal changes in mHTT levels in individual subjects remains to be seen but is of interest. That mHTT levels in such cells appear to be associated both with disease progression and with brain atrophy rates indicates their potential relevance to pathogenic and clinical events in the CNS. Future clinical trials in HD that aim to modulate mHTT levels directly or indirectly, and would be expected to act peripherally, may be enhanced by the application of such quantification.
Methods
Leukocyte isolation.
Cells were isolated from whole blood as previously described (7). Briefly, 50 ml whole blood was collected in heparin (CP Pharmaceuticals), and leukocytes were isolated by density gradient centrifugation. Leukocyte subsets were sorted via magnetic cell separation columns (Miltenyi Biotec) using anti-CD14, anti-CD3, and anti-CD19 microbeads for monocytes, T cells, and B cells, respectively. Pellets were snap-frozen and stored at –80°C until analysis.
Mutant and total HTT protein quantification by TR-FRET.
TR-FRET was performed as previously described (12), with the following modifications. For every 1 × 10⁶ cells, cells were lysed in 100 εl PBS, 1% Triton X-100, protease inhibitor cocktail (Roche). Cell lysates were added to 50 mM NaH2PO4, 400 mM NaF, 0.1% BSA, and 0.05% Tween and analyzed in white 384-well plates with 0.25 ng terbium cryptate (Tb) (Cisbio) conjugated 2B7 antibody and 20 ng D2 fluorophore (Cisbio) conjugated MW1 antibody for mHTT, and 1 ng Tb conjugated 2B7 and 10 ng Alexa Fluor 488 (A488) (Invitrogen) conjugated 2166 antibody for total HTT. Plates were rotated at 20 g for 30 seconds and incubated for 1 hour. Following excitation of the Tb donor at 320 nm and a time delay of 100 εs, emission signals were measured at 620, 665, and 520 nm for Tb, D2, and A488, respectively. Ratios of 665:620 nm and 520:620 nm signals corresponded to mutant or total HTT levels. Total protein concentrations were determined by BCA assay (Pierce). Signals are reported as percentages of signal intensities over lysis buffer background signals normalized to total protein concentration (difference in fluorescence intensity [ΔF]). All assays were carried out by an observer blinded to subject group (see Supplemental Table 3 for antibody details).
HTT fragment protein detection by immunoprecipitation and Western blot.
HTT fragment protein detection was performed as described previously (18), with the following adaptations. PBMCs were lysed in 500 εl ice-cold lysis buffer (50 mM HEPES [pH 7.0], 150 mM NaCl, 10 mM EDTA, 1% NP-40, 0.5% sodium deoxycholate, 0.1% SDS, 0.1% BSA, 10 mM DTT, 1 mM PMSF, 1x complete protease inhibitor cocktail [Roche]). Lysates were precleared prior to immunoprecipitation by incubation with 50 εl (1:1 slurry) prewashed G-Sepharose-agarose beads (Invitrogen) for 6 hours at 4°C. Immunoprecipitations were carried out overnight using 1 mg precleared supernatant, 20 εl protein G-Sepharose-agarose (1:1 slurry), and 2 εg antibody in a 1 ml final volume. Beads were pelleted by centrifugation at 13,000 g for 30 seconds, washed 4 times with lysis buffer, resuspended in 8 εl 2× Laemmli buffer, and denaturated at 75°C for 5 minutes. Immunoprecipitates were separated by 8% SDS-PAGE and blotted onto nitrocellulose membranes for immunodetection (see Supplemental Table 3 for antibody details).
Brain atrophy quantification.
3-Tesla volumetric MRI sequences were obtained using the TRACK-HD study London cohort. Details of the imaging protocols and rigorous quality control procedures are provided elsewhere (15). Follow-up scans were positionally matched to the baseline images, and change over 36 months was calculated using the robust boundary shift integral technique (22). All boundary shift integral changes were annualized before statistical analysis. All image analysis was carried out by an observer blinded to subject identity and group.
Statistics.
Linear regression models were used to compare HTT protein levels between groups, with adjustment for age and sex. Linear contrasts were used to compare participants with HD and control participants and pre-manifest and manifest subjects with HD. To allow for repeated measures for some subjects and potential heteroskedasticity, Huber-White robust standard errors are reported (23, 24). Linear regression models with robust standard errors were used to investigate associations between HTT levels and disease burden after adjustment for age and gender. To relate brain atrophy to mHTT levels, ordinary least-squares regression models were fitted, using mean mHTT levels in the case of multiple measures, again adjusting for age and gender. Throughout, statistically significant P values were taken to be those less than 0.05 (2 sided). Disease burden score was calculated as follows: [CAG repeat length – 35.5] × age. All analysis was performed using STATA v12.
Study approval.
Experiments were performed in accordance with the Declaration of Helsinki and approved by UCL/UCL Hospitals Joint Research Ethics Committee. All subjects gave informed written consent. Subject inclusion criteria and clinical assessments were used, and CAG repeat lengths were measured in RNA, as previously described (7).
Supplementary Material
Acknowledgments
This work was funded in part by the European Community’s Seventh Framework Programme (FP7/2007-2013) under grant agreement n261358 (PADDINGTON), MRC, BBSRC, the High Q Foundation/CHDI Foundation, UCL/UCLH NIHR Biomedical Research Centre, the Huntington’s Disease Association, the European HD Network, and the UK Dementia and Neurodegenerative Diseases Network. TRACK-HD investigators contributed to the study from which the MRI measures were drawn (15). Thanks to Ray Young for preparation of graphics.
Footnotes
Conflict of interest: The authors have declared that no conflict of interest exists.
Citation for this article: J Clin Invest. 2012;122(10):3731–3736. doi:10.1172/JCI64565.
References
- 1.The Huntington’s Disease Collaborative Research Group. A novel gene containing a trinucleotide repeat that is expanded and unstable on Huntington’s disease chromosomes. Cell. 1993;72(6):971–983. doi: 10.1016/0092-8674(93)90585-E. [DOI] [PubMed] [Google Scholar]
- 2.de Almeida LP, Ross CA, Zala D, Aebischer P, Déglon N. Lentiviral-mediated delivery of mutant huntingtin in the striatum of rats induces a selective neuropathology modulated by polyglutamine repeat size, huntingtin expression levels, and protein length. J Neurosci. 2002;22(9):3473–3483. doi: 10.1523/JNEUROSCI.22-09-03473.2002. [DOI] [PMC free article] [PubMed] [Google Scholar]
- 3.Kim J, Bordiuk OL, Ferrante RJ. Experimental models of HD and reflection on therapeutic strategies. Int Rev Neurobiol. 2011;98:419–481. doi: 10.1016/B978-0-12-381328-2.00016-X. [DOI] [PubMed] [Google Scholar]
- 4.MacDonald ME, Gines S, Gusella JF, Wheeler VC. Huntington’s disease. Neuromolecular Med. 2003;4(1–2):7–20. doi: 10.1385/NMM:4:1-2:7. [DOI] [PubMed] [Google Scholar]
- 5.van der Burg JM, Björkqvist M, Brundin P. Beyond the brain: widespread pathology in Huntington’s disease. Lancet Neurol. 2009;8(8):765–774. doi: 10.1016/S1474-4422(09)70178-4. [DOI] [PubMed] [Google Scholar]
- 6.Dalrymple A, et al. Proteomic profiling of plasma in Huntington’s disease reveals neuroinflammatory activation and biomarker candidates. J Proteome Res. 2007;6(7):2833–2840. doi: 10.1021/pr0700753. [DOI] [PubMed] [Google Scholar]
- 7.Björkqvist M, et al. A novel pathogenic pathway of immune activation detectable before clinical onset in Huntington’s disease. J Exp Med. 2008;205(8):1869–1877. doi: 10.1084/jem.20080178. [DOI] [PMC free article] [PubMed] [Google Scholar]
- 8.Wild E, et al. Abnormal peripheral chemokine profile in Huntington’s disease. PLoS Curr. 2011;3:RRN1231. doi: 10.1371/currents.RRN1231. [DOI] [PMC free article] [PubMed] [Google Scholar]
- 9.Zwilling D, et al. Kynurenine 3-monooxygenase inhibition in blood ameliorates neurodegeneration. Cell. 2011;145(6):863–874. doi: 10.1016/j.cell.2011.05.020. [DOI] [PMC free article] [PubMed] [Google Scholar]
- 10.Kwan W, et al. Bone marrow transplantation confers modest benefits in mouse models of Huntington’s disease. J Neurosci. 2012;32(1):133–142. doi: 10.1523/JNEUROSCI.4846-11.2012. [DOI] [PMC free article] [PubMed] [Google Scholar]
- 11.Tai YF, et al. Microglial activation in presymptomatic Huntington’s disease gene carriers. Brain. 2007;130(pt 7):1759–1766. doi: 10.1093/brain/awm044. [DOI] [PubMed] [Google Scholar]
- 12.Weiss A, et al. Microtiter plate quantification of mutant and wild-type huntingtin normalized to cell count. Anal Biochem. 2011;410(2):304–306. doi: 10.1016/j.ab.2010.11.044. [DOI] [PubMed] [Google Scholar]
- 13.Myers RH. Huntington’s disease genetics. NeuroRx. 2004;1(2):255–262. doi: 10.1602/neurorx.1.2.255. [DOI] [PMC free article] [PubMed] [Google Scholar]
- 14.Penney JB, Vonsattel JP, MacDonald ME, Gusella JF, Myers RH. CAG repeat number governs the development rate of pathology in Huntington’s disease. Ann Neurol. 1997;41(5):689–692. doi: 10.1002/ana.410410521. [DOI] [PubMed] [Google Scholar]
- 15.Tabrizi SJ, et al. Potential endpoints for clinical trials in premanifest and early Huntington’s disease in the TRACK-HD study: analysis of 24 month observational data. Lancet Neurol. 2012;11(1):42–53. doi: 10.1016/S1474-4422(11)70263-0. [DOI] [PubMed] [Google Scholar]
- 16.Whitelaw DM. The intravascular lifespan of monocytes. Blood. 1966;28(3):455–464. [PubMed] [Google Scholar]
- 17.MacDonald ME, et al. Gametic but not somatic instability of CAG repeat length in Huntington’s disease. J Med Genet. 1993;30(12):982–986. doi: 10.1136/jmg.30.12.982. [DOI] [PMC free article] [PubMed] [Google Scholar]
- 18.Landles C, et al. Proteolysis of mutant huntingtin produces an exon 1 fragment that accumulates as an aggregated protein in neuronal nuclei in Huntington disease. J Biol Chem. 2010;285(12):8808–8823. doi: 10.1074/jbc.M109.075028. [DOI] [PMC free article] [PubMed] [Google Scholar]
- 19.DiFiglia M, et al. Aggregation of huntingtin in neuronal intranuclear inclusions and dystrophic neurites in brain. Science. 1997;277(5334):1990–1993. doi: 10.1126/science.277.5334.1990. [DOI] [PubMed] [Google Scholar]
- 20.Vonsattel JP, Keller C, Cortes Ramirez EP. Huntington’s disease — neuropathology. Handb Clin Neurol. 2011;100:83–100. doi: 10.1016/B978-0-444-52014-2.00004-5. [DOI] [PubMed] [Google Scholar]
- 21.Toneff T, et al. Comparison of huntingtin proteolytic fragments in human lymphoblast cell lines and human brain. J Neurochem. 2002;82(1):84–92. doi: 10.1046/j.1471-4159.2002.00940.x. [DOI] [PubMed] [Google Scholar]
- 22.Leung KK, et al. Robust atrophy rate measurement in Alzheimer’s disease using multi-site serial MRI: tissue-specific intensity normalization and parameter selection. Neuroimage. 2010;50(2):516–523. doi: 10.1016/j.neuroimage.2009.12.059. [DOI] [PMC free article] [PubMed] [Google Scholar]
- 23.White HA. White HA. Heteroskedasticity-consistent covariance matrix estimator and a direct test for heteroskedasticity. Econometrica. 1980;48(4):817–838. doi: 10.2307/1912934. [DOI] [Google Scholar]
- 24.Huber PJ. Proceedings of the Fifth Berkeley Symposium on Mathematical Statistics and Probability. 1967. The behavior of maximum likelihood estimates under nonstandard conditions. In: Le Cam LM, Neyman J, eds. pp. 221–233. Vol. 1: Statistics. Berkeley, California, USA: University of California Press; [Google Scholar]
Associated Data
This section collects any data citations, data availability statements, or supplementary materials included in this article.