

Abstract
Parkinson's disease (PD) is a common neurodegenerative disease caused by genetic and environmental factors. We analyzed induced pluripotent stem cell (iPSC)-derived neural cells from PD patients and presymptomatic individuals carrying mutations in the PINK1 and LRRK2 genes, and healthy control subjects. We measured several aspects of mitochondrial responses in the iPSC-derived neural cells including production of reactive oxygen species, mitochondrial respiration, proton leakage and intraneuronal movement of mitochondria. Cellular vulnerability associated with mitochondrial function in iPSC-derived neural cells from PD patients and at-risk individuals could be rescued with coenzyme Q10, rapamycin or the LRRK2 kinase inhibitor GW5074. Analysis of mitochondrial responses in iPSC-derived neural cells from PD patients carrying different mutations provides insights into convergence of cellular disease mechanisms between different familial forms of PD and highlights the importance of oxidative stress and mitochondrial dysfunction in PD.
Introduction
The progressive motor symptoms in Parkinson's disease (PD) involve the loss of particularly vulnerable dopaminergic (DA) synapses and neurons. PD also damages other neurons in the central and peripheral nervous systems. The reasons for loss of function and degeneration remain unclear although the normal physiology of DA neurons (1, 2) can be considered in the context of known hereditary genetic risk factors. Clearly, genetic and environmental factors both contribute to an individual's risk of developing PD (3–6). Over the last decade, mutations in several genes have been shown to confer a significant risk of developing PD (7, 8). From studies of the rare inherited (familial) form of PD, mutations have been identified in the genes leucine-rich repeat kinase 2 and PTEN-induced putative kinase 1 encoding the LRRK2 and PINK1 kinases, respectively (7). Dominantly inherited mutations in LRRK2 are associated with familial PD (9, 10) that is clinically and pathologically similar, but not identical, to the more common late-onset idiopathic form of the disease (11–14). Interestingly, LRRK2 pathogenic mutations occur in the catalytic domains of this kinase---the G2019S mutation in the kinase domain and the R1441C/G/H mutation in the GTPase domain---implicating altered LRRK2 kinase activity in PD pathogenesis (15, 16). Mutations in PINK1, which encodes a mitochondria-targeted kinase, cause recessively inherited early onset parkinsonism (17–20) that clinically resembles the common late-onset form of PD but also presents with additional psychiatric symptoms. It is not clear whether PINK1 mutations cause the characteristic Lewy bodies that are found in most other forms of PD (21, 22).
Patients with the common sporadic form of PD may have genetic variations that influence their risk of developing PD. Such variations may be found in genes implicated in familial PD (6, 23) or in genes in signaling pathways that have not yet been implicated in familial PD (3, 24). The accumulation of genetic variants associated with PD may also explain the high incidence of shared clinical syndromes in family members who do not share the familial genetic mutation (25).
In this study, we derive neural cells from iPSCs from presymptomatic individuals and PD patients carrying the recessive homozygous Q456X mutation in PINK1, the dominant homozygous G2019S mutation in LRRK2 and the heterozygous R1441C substitution in LRRK2 and healthy subjects not carrying these mutations. In parallel experiments performed in several collaborating laboratories, mitochondrial, proteasomal and lysosomal function were analysed in these cells. The results of these assays were then used to characterize resulting neural cell phenotypes from individuals with genetically distinct forms of PD or without familial history of PD.
Results
PINK1 and LRRK2 mutations and vulnerability to cell stressors
The phenotypic assays were performed at the same time in several laboratories using neural cells distributed from the same weekly batches of differentiated iPSC cultures. All iPSC clones were differentiated and analyzed in parallel. The iPSCs were generated from 3 patients with familial PD, 2 asymptomatic individuals carrying PD-associated genetic mutations and 2 healthy individuals who were not carrying genetic mutations associated with familial PD (Fig. S1–3 and Table S1). Comparative batch-batch analysis of iPSC differentiation confirmed the reproducibility of the broad neural cell types used for the phenotypic assays (Fig. S4). The populations of neural cells contained dopaminergic (DA) neurons, non-DA neurons and immature cells of these lineages. Neural cell vulnerabilities to PD-associated chemical toxins and stressors targeting either mitochondrial function or protein degradation (Fig. 1) were determined in parallel by measuring cellular release of lactate dehydrogenase (LDH) and intracellular activity of MTS (reductase 3-(4,5-dimethylthiazol-2-yl)-5-(3-carboxymethoxyphenyl)-2-(4-sulfophenyl)-2H-tetrazolium). As the LDH and MTS assays produced similar dose responses, only the data from the LDH assays are shown (Table 1). The genotype-specific cytotoxicity profiles showed that neural cells from patients with the PINK1 Q456X mutation were more vulnerable to valinomycin (0.5–100 μM), MPP+ (0.05 and 5 μM), concanamycin A (10–100 nM), hydrogen peroxide (1–10 μM) and MG132 (1 μM) than neural cells from healthy subjects (Fig. S5). Neural cells from individuals carrying LRRK2 mutations shared a vulnerability to valinomycin (0.5–100 μM), concanamycin A (10 and 50 nM), and MPP+ (0.05 μM) (Fig. S6). From analyses using the same batches of cells as used in the LDH and MTS assays, immunocytochemistry and cell counts revealed fewer DA neurons among the neural cells from individuals carrying PINK1 Q456X and LRRK2 R1441C mutations compared to those from healthy subjects not carrying the genetic mutations after exposure to low concentrations of valinomycin and concanamycin A (Table S4). These data show that iPSC-derived neural cells from patients with genetically distinct forms of PD or at-risk individuals share common vulnerabilities to valinomycin and concanamycin A. Furthermore, the data demonstrate the differential vulnerability of human neural cells, neurons and DA neurons carrying PD-associated genetic mutations to valinomycin and concanamycin A.
Figure 1. Cellular stressors used to treat PD patient iPSC-derived neural cells.

To analyze cellular vulnerability and dysfunctional oxidative phosphorylation relevant to PD, ten different cellular stressors were administered to cells derived from PD patients and asymptomatic individuals carrying PINK1 or LRRK2 genetic mutations, and healthy subjects who were not carrying these PD-associated mutations. The cellular stressors were known to affect pathways implicated in PD pathogenesis, such as oxidative phosphorylation, the autophagy-lysosomal pathway or the ubiquitin-proteasome system (UPS).
Table 1.
Sensitivity of iPSC-derived neural cells from PD patients and healthy subjects in response to chemical stressors (Mean ± SEM of LDH release expressed as % of Triton X-100 Control).
| Cellular stressor Neural cell genotype |
Valinomycin (10 μM) | MPP+ (5 μM) | Concanamycin A (10 nM) | Hydrogen peroxide (1 μM) | MG132 (1 μM) | CCCP (10 μM) | 6OHDA (10 μM) |
|---|---|---|---|---|---|---|---|
| Healthy subjects | 30.1 ± 2.8 | 34.5 ± 2.2 | 39.3 ± 3.4 | 40.3 ± 2.8 | 35.1 ± 3.1 | 42.3 ± 4.1 | 31.4 ± 3.4 |
| PINK1 Q456X homozygotes | 52.3 ± 3.3* | 41.4 ± 2.8* | 51.6 ± 4.1* | 52.3 ± 4.1* | 44.5 ± 4.8* | 48.2 ± 4.4 | 33.1 ± 2.7 |
| LRRK2 G2019S homozygote | 42.8 ± 3.9* | 39.5 ± 4.2 | 48.4 ± 3.9* | 49.3 ± 8.2 | 38.5 ± 4.9 | 52.4 ± 6.3 | 34.5 ± 4.1 |
| LRRK2 R1441C heterozygotes | 45.3 ± 3.9* | 37.5 ± 5.2 | 53.7 ± 4.5* | 48.2 ± 7.3 | 40.4 ± 3.9 | 53.1 ± 5.7 | 35.7 ± 3.1 |
N=3,
p<0.05 ANOVA.
PD-associated chemical stressors reveal genotype-specific vulnerability to mROS
Given that mitochondrial reactive oxygen species (mROS) are a primary source of cellular stress that can be induced by a wide variety of chemical stimuli, we examined whether low concentrations of chemical stressors such as the potassium ionophore, valinomycin could increase mROS concentrations in neural cells from PD patients compared to healthy subjects. There was an increase in the production of mROS by neural cells from PD patients with PINK1 mutations (0.1 μM valinomycin, 308.99 ± 101% SEM, p<0.05 ANOVA) compared to healthy controls that did not carry familial PD associated genetic mutations (0.1 μM valinomycin, 122.84 ± 7.16% SEM) in response to a low concentration of valinomycin (Fig. 2A,B). Neural cells from PD patients and healthy subjects showed similar dose-dependent increases in mROS levels in response to low concentrations of hydrogen peroxide (Fig. 2C); the remaining chemical stressors did not change mROS levels in neural cells from either patients or healthy subjects (Table S3).
Figure 2. Effects of cellular stressors on iPSC-derived neural cells with a PINK1 mutation.

PINK1 Q456X homozygote PD patient neural cells were treated with low concentrations of valinomycin and mitochondrial reactive oxygen species (mROS) and GSH concentrations were measured. (A–C) After 24 hours of incubation in vehicle, 0.1 μM or 1 μM valinomycin, patient specific neural cells were labeled with a fluorescent indicator of mitochondrial reactive oxygen species and analyzed by fluorescence-activated cell sorting (FACS). (A) Few fluorescent cellular events were recorded from healthy subject neural cells exposed to 0.1 μM valinomycin relative to unstained cultures. In contrast, many fluorescent cellular events representing increased mROS production were recorded from PINK1 patient neural cells exposed to 0.1 μM valinomycin. (B) Quantification of fluorescent events revealed that 0.1 μM valinomycin increased the percentage of fluorescent PINK1 patient specific neural cells. (C) Parallel incubations of healthy subject and patient-specific neural cells with 1 nM or 10 nM hydrogen peroxide (H2O2) showed dose-dependent increases in the percentage of fluorescent cellular events independent of genotype, confirming the specificity of the assay for ROS levels. (D–I) After exposure to valinomycin (0.1 or 1 μM, D), concanamycin A (10 nM, E), MPP+ (5 μM, F), or H2O2 (10 μM, G), PINK1 patient neural cells (black bars) showed reduced GSH levels relative to healthy subject neural cells (white bars). In contrast, low concentrations of 6OHDA (1 or 10 μM, H) or MG132 (1 or 10 μM, I) did not change GSH levels in PINK1 patient or healthy subject neural cells. Data are represented as Mean ± SEM, N=3, * p<0.05 ANOVA PINK1 versus Healthy subject, δ p<0.05 ANOVA chemical stressor versus vehicle.
The reduced form of glutathione (GSH) is an antioxidant that is important for preventing the damage caused by an increase in mROS concentrations. Given the combined cytotoxicity and increased mROS concentrations in neural cells from PD patients with the PINK1 Q456X mutation in response to valinomycin, we next determined GSH concentrations in neural cells from PINK1 Q456X patients and healthy subjects after exposure to low concentrations of valinomycin, concanamycin A, MPP+ and hydrogen peroxide. Neural cells from PINK1 Q456X patients contained reduced GSH after administration of low concentrations of valinomycin (1 and 10 μM), concanamycin A (10 nM), MPP+ (5 μM) and hydrogen peroxide (10 μM) but not MG132 or 6OHDA (Fig. 2D–I). Taken together, the cytotoxicity profiles and the changes in mROS and GSH concentrations suggest that neural cells from PD patients carrying the PINK1 mutation show increased vulnerability to cellular oxidative stress compared to neural cells from healthy individuals.
Mitochondrial respiration in neural cells from individuals carrying PINK1 or LRRK2 mutations
Next, we determined the rates of oxygen consumption by neural cells derived from individuals carrying PD-associated genetic mutations in PINK1 or LRRK2 and healthy subjects without these genetic mutations in response to the inhibitor of ATP synthase oligomycin (antibiotic), the proton ionophore, FCCP (carbonyl cyanide 4-trifluoromethoxy phenylhydrazone) and the mitochondrial complex I inhibitor rotenone (pesticide) (Fig. 3). The basal oxygen consumption rate of neural cells from PD patients with PINK1 mutations was greater than that for healthy subjects; exposure to oligomycin did not reduce the oxygen consumption rate (Fig. 3A,B). Neural cells from both PD patients with PINK1 mutations and healthy subjects showed similar responses in oxygen consumption rate to FCCP and rotenone. Furthermore, neural cells from PINK1 PD patients showed an increased difference between oligomycin and rotenone inhibition of oxygen consumption rates, representing energy substrate (ATP) independent respiration and an increase in the passive leak of protons from the inner mitochondrial membrane (Fig. 3C). The results from the full experiment (Fig. 3, T.M.D. lab) were confirmed in a parallel exploratory experiment using the same neural cells but administered oligomycin, CCCP and the electron transport chain inhibitor, antimycin A in neural cell culture medium (Fig. S7, D.K. lab).
Figure 3. Respiration in PD patient iPSC-derived neural cells.
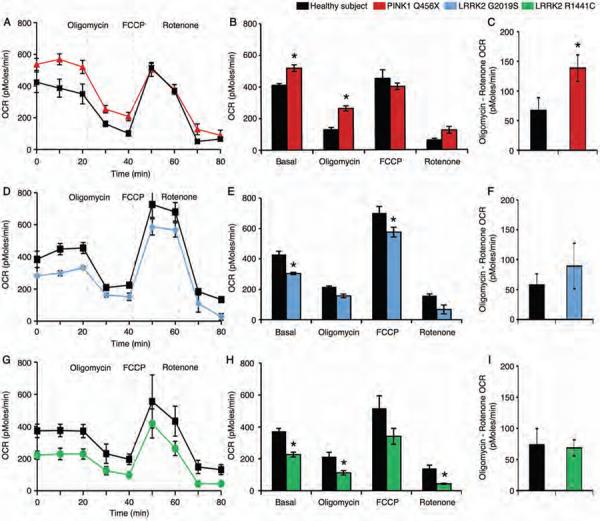
(A) iPSC-derived neural cells from healthy subjects (black) or PD patients carrying the PINK1 Q456X mutation (red) were administered oligomycin (which inhibits ATP synthesis), FCCP (which induces maximum respiratory capacity) and rotenone (which inhibits total mitochondrial respiration) sequentially and the oxygen consumption rate (OCR), indicative of oxidative phosphorylation, was measured in real time. (B) Quantification of the OCR for each cellular stressor demonstrated an increased basal respiration rate and reduced sensitivity to oligomycin of PINK1 Q456X patient neural cells. (C) Subtraction of the rotenone-induced OCR from the oligomycin OCR demonstrated an increase in proton leakage from PINK1 Q456X PD patient neural cells. (D) iPSC-derived neural cells from healthy subjects (black) and PD patient carrying the LRRK2 G2019S mutation (blue) were treated with oligomycin, FCCP and rotenone sequentially and the OCR was measured in real time. (E) iPSC-derived neural cells from a PD patient carrying the LRRK2 G2019S mutation exhibited a reduced basal respiration rate and increased sensitivity to FCCP. (F) Subtraction of the rotenone-induced OCR from the oligomycin OCR demonstrated that the levels of proton leakage from LRRK2 G2019S patient neural cells were similar to those for healthy subject neural cells. (G) iPSC-derived neural cells from healthy subjects (black) or individuals carrying the LRRK2 R1441C mutation (green) were administered oligomycin, FCCP and rotenone sequentially and the OCR was measured in real time. (H) LRRK2 R1441C patient neural cells exhibited a reduced basal respiration rate and increased sensitivity to both oligomycin and rotenone. (I) Subtraction of the rotenone-induced OCR from the oligomycin OCR demonstrated that the levels of proton leakage from LRRK2 R1441C patient neural cells were similar to those for healthy subject neural cells. Data are represented as Mean ± SEM, N=3, * p<0.05 ANOVA.
The basal oxygen consumption rates of iPSC-derived neural cells from individuals carrying the LRRK2 G2019S and R1441C mutations were reduced compared to iPSC-derived neural cells from healthy subjects (Fig. 3D,E,G,H). The neural cells from individuals carrying LRRK2 G2019S and R1441C mutations and healthy subjects showed similar changes in oxygen consumption rates in response to oligomycin, FCCP and rotenone (Fig. 3D,E,G,H). Furthermore, the similar levels of oligomycin and rotenone inhibition of oxygen consumption rates indicated that proton leakage was not found in neural cells from individuals carrying either LRRK2 G2019S or R1441C mutations (Fig. 3F,I). The shared profiles of mitochondrial dysfunction among iPSC-derived neural cells from individuals carrying different PD-associated genetic mutations suggests a common vulnerability to altered cellular bioenergetics.
Dysfunctional mitochondrial mobility in PD LRRK2 mutant neurons
Mitochondrial transport allows cells to respond to regional changes in metabolism and protect their mitochondria from damage. To examine the consequences of PD-associated genetic mutations on mitochondrial biology, we examined mitochondrial dynamics in iPSC-derived neurons from individuals carrying LRRK2 and PINK1 genetic mutations and healthy subjects using live cell imaging. Mitochondria in the proximal axon of neurons from individuals carrying the LRRK2 G2019S mutation (72.4 ± 4.6%, SD) and R1441C mutation (61.1 ± 3.8%, SD) were more mobile (percentage of mitochondria moving in any direction during the 5 minute recording) than similarly located mitochondria in neurons derived from healthy subjects (47.25 ± 1.6% SD, p<0.05 ANOVA, Fig. 4A). The mobility of mitochondria in neurons from PD patients with the PINK1 Q456X mutation was similar to mitochondrial movement in neurons from healthy subjects (Fig. 4A).
Figure 4. Mobility of mitochondria in the proximal axon of PD patient iPSC-derived neurons.

(A) Analysis of live cell imaging showed that the mitochondria in the proximal axons of neurons from individuals carrying LRRK2 G2019S and R1441C mutations moved more randomly than similarly located mitochondria in healthy control neurons. Further analysis showed that mitochondrial movements in the proximal axons of LRRK2 G2019S patient neurons were more bidirectional (both anterograde and retrograde) than mitochondrial movements in healthy control neurons. *p<0.05 ANOVA. (B) The axons of neurons from healthy subjects and individuals carrying PINK1 Q456X, LRRK2 G2019S and LRRK2 R1441C mutations the same length (Kolmogorov–Smirnov test). (C) However, the mitochondria in neurons from individuals carrying the LRRK2 R1441C mutation were shorter than mitochondria from healthy control neurons. *p<0.05, Kolmogoro–Smirnov test. (D) Representative kymographs of mitochondria labeled with mitoDendra fluorescent protein in proximal axons from neurons of healthy subjects and from individuals carrying PINK1 Q456X, LRRK2 G2019S and LRRK2 R1441C mutations taken every 5 seconds for 5 minutes. (E) Representative images of mitochondria labeled with mitoDendra fluorescent protein in the proximal axons of neurons from healthy subjects and from individuals carrying PINK1 Q456X, LRRK2 G2019S and LRRK2 R1441C mutations. Data are represented as Mean ± SD, N=3.
Regarding the direction of movement, mitochondria in the proximal axon of neurons from PD patients with the LRRK2 G2019S mutation showed more bidirectional (non-monotonic) movement (percentage of mitochondria moving in both directions, anterograde and retrograde, 21.7 ± 5.1% SD) than mitochondria in neurons from healthy subjects (8.60 ± 1.07% SD, p<0.05 ANOVA, Fig. 4A,D). An increase in bidirectional mobility of mitochondria in neurons from LRRK2 G2019S PD patients was found.
The length of axons (i.e. long, thin processes with uniform diameters) did not differ between neurons from healthy subjects (30.7 ± 16.2 μm SD, N=88, by Kolmogorov-Smirnov test) and neurons from individuals carrying PD-associated genetic mutations (PINK1 Q456X 33.5 ± 17.5 μm SD, N=81; LRRK2 R1441C 33 ± 12.1 μm SD, N=51; or LRRK2 G2019S 31.3 ± 10.8 μm SD, N=25; Fig. 4B). As for the length of each mitochondrion in the axons, mitochondria in the proximal axon of neurons from individuals carrying the LRRK2 R1441C mutation (1.8± 1.0 μm SD, N=283; p=0.041 by Kolmogorov–Smirnov test) were found to be 20% shorter than mitochondria in axons of neurons derived from healthy subjects (2.25 ± 1.36 μm SD, N=430; Fig. 4C, E). Mitochondria in neurons from PINK1 Q456X PD patients (2.34 ± 2.81 μm SD, N=463) or LRRK2 G2019S PD patients (1.91 ± 0.86 μm SD, N=116) were similar in length to neuronal mitochondria from healthy subjects. These findings suggest that the LRRK2 mutations in PD patient-specific neurons are associated with altered mitochondrial dynamics and morphology.
Pharmacological rescue of neural cell vulnerability from PD patients
Cytotoxicity assays demonstrated that iPSC-derived neural cells from individuals carrying PINK1 and LRRK2 mutations are more vulnerable to the chemical toxins valinomycin and concanamycin A than neural cells from healthy subjects. To examine whether this cellular vulnerability could be reduced pharmacologically, iPSC-derived neural cells carrying PINK1 and LRRK2 genetic mutations were treated with the antioxidants Coenzyme Q10 or rapamycin or the LRRK2 inhibitor, GW5074 during exposure to low concentrations of either valinomycin or concanamycin A. Measurements of LDH release demonstrated that treatment with Coenzyme Q10 reduced the vulnerability of iPSC-derived neural cells with PINK1 Q456X, LRRK2 G2019S and LRRK2 R1441C mutations to the lowest concentration of valinomycin (0.1 μM, Fig. 5A, C, E) and concanamycin A (1 nM, Fig. 5B, D, F). However, Coenzyme Q10 did not reduce LDH release by the same iPSC-derived neural cells in response to higher concentrations of valinomycin (1 μM) and concanamycin A (10 nM). Although rapamycin reduced LDH release from LRRK2 mutant neural cells exposed to valinomycin but not concanamycin A, neural cells from PD patients with PINK1 mutations were unresponsive to rapamycin (Fig. 5A,B). Treatment with the LRRK2 inhibitor, GW5074 reduced LDH release from neural cells of PINK1 Q456X PD patients exposed to valinomycin but not to concanamycin A (Fig. 5A,B). GW5074 also reduced LDH release from neural cells with LRRK2 mutations in response to both valinomycin and concanamycin A (Fig. 5C–F). Next, we examined whether the induction of mROS production in PINK1 PD patient neural cells in response to a low concentration of valinomycin could be reduced pharmacologically. Neural cells from PINK1 Q456X PD patients or healthy subjects were administered Coenzyme Q10, rapamycin or GW5074 during exposure to valinomycin. Neither Coenzyme Q10, rapamycin or GW5074 affected mROS production in neural cells from healthy subjects (Fig. S8A). In contrast, both rapamycin and GW5074 reduced mROS production by PINK1 PD patient neural cells exposed to 0.1 μM valinomycin (Fig. S8B).
Figure 5. Pharmacological treatment of iPSC-derived neural cells from PD patients.
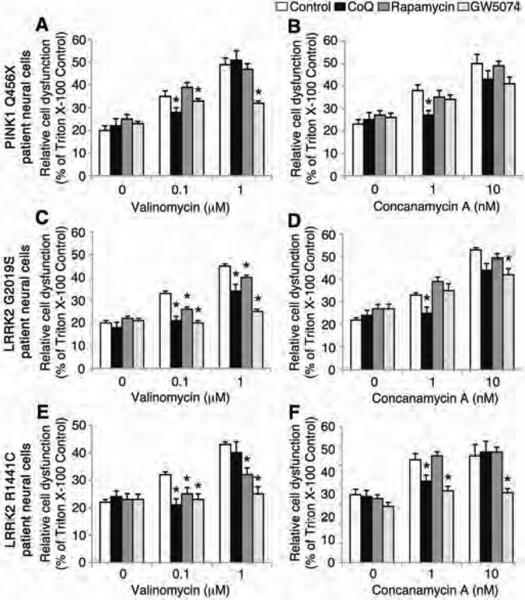
iPSC-derived neural cells from individuals with PINK1 and LRRK2 mutations were treated with Coenzyme Q10, rapamycin or GW5074 after exposure to low doses of valinomycin or concanamycin A and LDH release was measured. (A–F) The administration of either valinomycin (0.1 μM and 1 μM) or concanamycin A (1 nM and 10 nM) increased LDH release from PINK1 Q456X, LRRK2 G2019S and LRRK2 R1441C PD patient neural cells (white bars). (A) Treatment with 1 μM Coenzyme Q10 (black bars) or 1 μM GW5074 (light grey bars) but not 1 μM rapamycin (dark grey bars) reduced LDH release by PINK1 PD patient neural cells induced by valinomycin (control, white bars). (B) Treatment with Coenzyme Q10 but not rapamycin or GW5074 reduced LDH release from PINK1 Q456X PD patient neural cells induced by concanamycin A (control, white bars). (C) Treatment with Coenzyme Q10, rapamycin or GW5074 reduced LDH release by LRRK2 G2019S PD patient neural cells induced by valinomycin (control, white bars). (D) Treatment with Coenzyme Q10 or GW5074 but not rapamycin reduced LDH release by LRRK2 G2019S PD patient neural cells induced by concanamycin A (control, white bars). (E) Treatment with Coenzyme Q10, rapamycin or GW5074 reduced LDH release by neural cells from individuals carrying the LRRK2 R1441C mutation induced by valinomycin (control, white bars). (F) Treatment with Coenzyme Q10 or GW5074 but not rapamycin reduced LDH release by neural cells from individuals carrying the LRRK2 R1441C mutation induced by concanamycin A (control, white bars). The relative cell dysfunction was calculated from LDH release values as a percentage of untreated cells completely lysed by incubation with Triton X-100. Data are represented as Mean ± SEM, N=3, * p<0.05 ANOVA.
PINK1 and LRRK2 mutant neural cells are sensitive to valinomycin and concanamycin A
Finally, we examined whether cellular reprogramming is required for the cytotoxicity phenotypes observed in neural cells from individuals carrying LRRK2 and PINK1 genetic mutations. LDH release in response to a full range of valinomycin and concanamycin A concentrations was measured for iPSC-derived neural cells and for fibroblasts taken directly from familial PD patients (Fig. 6). Exposure to valinomycin caused both PINK1 PD patient neural cells (Fig. 6A) and fibroblasts (Fig. 6B) to release more LDH than iPSC-derived neural cells or fibroblasts from healthy subjects. Importantly, greater concentrations of valinomycin were required to induce vulnerability to oxidative stress in fibroblasts compared to neural cells from PINK1 PD patients. In response to concanamycin A, PINK1 PD patient neural cells released more LDH than neural cells from healthy subjects (Fig. 6C), but PINK1 patient and healthy subject fibroblasts released similar levels of LDH (Fig. 6D). Similar results were obtained for iPSC-derived neural cells and fibroblasts from PD patients with the LRRK2 G2019S and R1441C mutations in response to valinomycin and concanamycin A (Fig. 6E–H). In response to valinomycin, iPSC-derived neural cells carrying LRRK2 mutations released more LDH than neural cells from healthy subjects (Fig. 6E), but LRRK2 PD patient fibroblasts did not release more LDH than fibroblasts from healthy subjects (Fig. 6F). In response to concanamycin A, neural cells (Fig. 6G) and fibroblasts (Fig. 6H) from individuals carrying either of the LRRK2 mutations released more LDH than neural cells and fibroblasts from healthy subjects. Importantly, LRRK2 PD patient fibroblasts released less LDH than iPSC-derived neural cells with LRRK2 mutations when treated with either valinomycin or concanamycin A (Fig. 6E–H).
Figure 6. Cell type specific vulnerability to cellular stressors and oxidative stress.

iPSC-derived neural cells from individuals carrying PINK1 and LRRK2 mutations are more vulnerable to both valinomycin and concanamycin A than primary fibroblasts taken from PD patients. (A) In response to a range of valinomycin concentrations, PINK1 patient neural cells (white bars) released more LDH than healthy control neural cells (black bars). (B) Similarly, PINK1 PD patient fibroblasts (white bars) released more LDH than fibroblasts from healthy subjects (black bars) in response to valinomycin, albeit at greater concentrations of valinomycin than PINK1 PD patient neural cells. (C) In response to a range of concentrations of concanamycin A, PINK1 PD patient neural cells (white bars) released more LDH than healthy subject neural cells (black bars). (D) In contrast, PINK1 PD patient (white bars) and healthy subject (black bars) fibroblasts released similar amounts of LDH in response to concanamycin A. (E) In response to a range of concentrations of valinomycin, neural cells from individuals carrying LRRK2 G2019S (grey bars) and LRRK2 R1441C (black bars) mutations released more LDH than healthy subject neural cells (white bars). (F) In contrast, LRRK2 G2019S PD patient (grey bars), LRRK2 R1441C PD patient (black bars) and healthy subject (white bars) fibroblasts released similar levels of LDH in response to valinomycin. (G) In response to a range of concentrations of concanamycin A, neural cells from individuals carrying LRRK2 G2019S mutation (grey bars) and LRRK2 R1441C mutation (black bars) released more LDH than healthy subject neural cells (white bars). (H) Similarly, LRRK2 G2019S PD patient fibroblasts (grey bars) and LRRK2 R1441C patient fibroblasts (black bars) released more LDH than healthy subject fibroblasts (white bars) in response to concanamycin A, but the LDH levels were lower than for neural cells from individuals with LRRK2 G2019S and R1441C mutations. The relative cell dysfunction was calculated from LDH release values as a percentage of untreated cells completely lysed by incubation with Triton X-100. Data are represented as Mean ± SEM, N=3, * p<0.05 ANOVA.
Discussion
We first focused on determining phenotypes for iPSC-derived neural cells generated from patients with familial forms of PD and at-risk individuals. Our rationale was based on the fact that patients with sporadic forms of PD share many of the symptoms of patients carrying PINK1 and LRRK2 mutations. The disease in patients with sporadic forms of PD is less well defined because it may be caused by a combination of cumulative genetic variants and greater environmental effects than is the case with familial forms of PD. We therefore decided to first examine mitochondrial dysfunction in iPSC-derived neural cells from patients with rare familial forms of PD in order to see whether there are commonalities in terms of vulnerabilities to chemical stressors and toxins (26). It is hoped that future experiments using iPSC-derived neural cells from patients with sporadic PD may show some of the same phenotypic features identified in iPSC-derived neural cells from PD patients with PINK1 and LRRK2 mutations.
In our experiments, we observed a gradual increaase in sensitivity to cellular stress as the cell type analyzed became functionally closer to the vulnerable cell types in the PD patient's brain. The iPSC-derived neural cells from the different PD-associated genotypes shared cellular vulnerabilities to chemicals such as valinomycin that induces mitochondrial depolarization with K+ ions (27–29). In contrast, the iPSC-derived neural cells from PD patients were not vulnerable to CCCP (carbonyl cyanide 3-chlorophenylhydrazone), which depolarizes mitochondria using protons (H+) (30). PD patient neural cells also showed increased sensitivity compared to healthy control neural cells to Concanamycin A, a specific inhibitor of vacuolar type H+-adenosine triphosphatases (V-ATPases) that regulate autophagy and membrane transport (31, 32). However, a similar inhibitor of V-ATPases can change mitochondrial respiration and exhibits K+ ionophoric activity (33, 34). Given the shared vulnerability of PINK1 and LRRK2 PD patient neural cells to valinomycin and concanamycin A but not CCCP, it is possible that the PD-associated mutations compromised the ability of the iPSC-derived neural cells to efficiently respond to mitochondria damaged by the influx of K+ ions. Measuring cellular vulnerability to direct ROS (H2O2), induced concentrations of mROS and inhibition of complex I and the proteasome indicated that the ability of iPSC-derived neural cells from PINK1 Q456X patients to respond to oxidative stress was reduced. The findings suggest that iPSC-derived neural cells from PD patients carrying PINK1 mutations may use mitochondrial proton leakage to minimize oxidative damage from loss of PINK1 activity (27, 35, 36). In contrast, the oxygen consumption rates show that the mitochondrial electron transport chain is intact in PD patient neural cells carrying LRRK2 mutations but the reduced levels of basal respiration in these cells suggests that the increased kinase activity caused by the LRRK2 mutations reduces the availability of substrates for oxidative phosphorylation (37). The LRRK2 mutations were also associated with disrupted mitochondrial movement in PD patient-specific neurons. Dysfunctional axonal trafficking has been implicated in PD as an early event that precedes neurodegeneration (38–40). LRRK2 can regulate the stability of neuronal microtubules that are required for efficient trafficking of mitochondria to energy-dependent regions within neurons (41, 42). Importantly, the combination of altered mitochondrial dynamics and reduced basal respiration in LRRK2 PD patient neurons may contribute to the vulnerability of neurons in PD.
The pharmacological rescue of the genotype-specific vulnerabilities to valinomycin and concanamycin A also provided some mechanistic insight. The rescue of PINK1 Q456X PD patient neural cells from low concentrations of valinomycin and concanamycin A by the antioxidant Coenzyme Q10 and the LRRK2 inhibitor GW5074 is consistent with the hypothesis that loss of PINK1 leads to production of ROS through an LRRK2-associated mechanism (15, 43, 44). Rapamycin inhibits the activity of the mammalian target of rapamycin (mTOR) and can improve lysosomal degradation and activate pro-survival AKT in PD cellular and animal models (45–47). In our experiments, rapamycin did not protect PINK1 Q456X PD patient neural cells from either valinomycin or concanamycin A. This contrasts with the neuroprotective effects of rapamycin observed in Drosophila carrying a PINK1 null mutation (48). Importantly, rapamycin reduced the vulnerability of both LRRK2 G2019S and R1441C PD patient neural cells to valinomycin, suggesting a potential link between LRRK2, mitochondrial dysfunction, lysosomal degradation and AKT activation. The LRRK2 inhibitor GW5074 provided some protection against valinomycin and concanamycin A-induced toxicity in both LRRK2 G2019S and R1441C PD patient neural cells, consistent with a previous study showing that GW5074 protected mice against LRRK2-mediated toxicity (15).
Our findings raise several interesting points. First, the genotype-specific phenotypic profiles suggest possible shared cellular disease pathways for familial forms of PD. The broader range of neural cell vulnerabilities associated with the loss of PINK1 expression compared to that for neural cells from individuals with LRRK2 mutations is consistent with an increased genetic risk and an earlier age of onset of PD in patients carrying the PINK1 Q456X compared to either of the LRRK2 mutations. The shared vulnerability to chemical stressors, and the similar respiratory and mitochondrial mobility profiles for both LRRK2 G2019S and R1441C neural cells suggests that both mutations cause similar downstream dysfunction
Second, cell type-specific vulnerability, that is, preferential degeneration of nigrostriatal DA neurons, is a characteristic of PD. However, it has not been clear whether patient-specific iPSCs can provide populations of neural cells that can robustly model disease pathogenesis. Given that fibroblasts from PD patients carrying PINK1 and LRRK2 mutations exhibit phenotypes (49–52), it seems reasonable to suppose that iPSC-derived neural cells are a useful human cellular model for dissecting and reversing pathogenic events in PD. Our data demonstrate cell-type specific vulnerability as PD patient-specific neural cells differentiated from iPSCs were more sensitive to cellular stressors than fibroblasts carrying similar mutations. Our data are consistent with the hypothesis of cell type specific vulnerability developed for PD patients and other models of PD, where the midbrain dopaminergic neuron is more vulnerable than neighboring neuronal subtypes, that also express genes associated with familial PD (1, 53, 54).
Third, in terms of using iPSCs to model PD pathogenesis, we think that the cell stress assays we have used provide an opportunity to investigate aspects of aging-related pathogenesis and an individual's treatment responses. For example, the age-related accumulation of dysfunctional mitochondria (55, 56) can be mimicked using low doses of mitochondrial stressors, such as valinomycin or MPP+, which create controlled, widespread mitochondrial damage within a cell population.
Cellular reprogramming technology has been proposed as a platform for predicting disease phenotypes, drug efficacy or to classify drug responsive cohorts based on genetics (57–59). Even with advances in genomic sequencing and a better understanding of phenotypic-genotypic correlations performed on kindreds, the biological basis for predicting drug responsive phenotypes of the familial or sporadic forms of PD is unclear. Importantly, our data from the dose responses of PINK1 and LRRK2 PD patient neural cells to Coenzyme Q10, rapamycin and GW5074 suggest that cellular reprogramming technology may be able to help define patient cohorts that are responsive to different pharmacological treatments. For future clinical impact, it will be essential to determine cellular responses during the presymptomatic phase of the disease, when neuroprotective interventions are predicted to be most efficacious.
Our findings provide evidence of differences in responses to cellular stress for iPSC-derived neural cells from individuals carrying genetic mutations associated with different forms of familial disease. These data show that iPSC-derived neural cells are sensitive models for measuring vulnerability and dose responses of candidate neuroprotective molecules and may help to identify disease causes and better individualize treatment effects.
Materials and Methods
Clinical data for patient-specific iPSC lines
The iPSC lines were generated from seven subjects from 3 families with PD under informed consent. Subjects 1 (II:5) and 2 (II:7) were family members that share homozygous PINK1 Q456X mutations (Family W) (21). Briefly, the age of onset of the PD patients with PINK1 Q456X mutations were 61 and 53 years and they had scores of 2 and 2.5 on the Hoehn and Yahr Scale, respectively indicating bilateral symptoms. Subjects 3 and 4 were 59-year-old Caucasian twins (sister and brother) from a family with PD (Family D) (9, 60). They each had a heterozygous LRRK2 R1441C mutation inherited from their father who had PD. Neither of these subjects were clinically affected but Subject 3 (brother) showed some resting tremor. Subject 5 was a 78 year old, Caucasian man (Family US1) whose age at onset was 55 years and he had a score of 3.5 on the Hoehn and Yahr Scale, indicating moderate to severe disability. He carried a homozygous LRRK2 G2019S mutation and his brother, maternal aunt and paternal uncle had been diagnosed with PD ((61) and unpublished). His symptoms were responsive to anti-parkinsonism therapy. Subjects 6 and 7 were 59 and 40 years of age at skin biopsy and were from the same family as subjects 1 and 2 but did not have a known PD-associated mutation and were clinically unaffected at the time of biopsy. Skin fibroblasts from each of the subjects were reprogrammed using standard methods (Fig. S1–3 and Table S1) (27, 62) and the genotype was confirmed for each iPSC clone. The LRRK2 G2019S genotype was confirmed by PCR-RFLP with SfcI using LRRK2 exon 31 genomic DNA as a template. The PCR product from homozygous LRRK2 G2019S iPSCs was digested to produce 218 and 40 bp fragments. The PCR product from human ES cells incubated with SfcI produced a 258 bp band, consistent with non-digested DNA without the mutation. The LRRK2 R1441C genotype was confirmed by PCR-RFLP with BstUI using LRRK2 exon 31 genomic DNA template. The 386 bp PCR product from human ES cells, with Arg at amino acid position 1441, was digested to produce 316 and 70 bp fragments (no mutation). In parallel, PCR products from LRRK2 R1441C iPSCs were digested to produce bands at 386 bp, 316 bp and 70 bp, consistent with a heterozygous mutation. In parallel genetic analyses, we confirmed that the patients' and at-risk individuals' iPSC lines did not carry additional major genetic mutations found in the other families of this study and the healthy subject iPSC lines did not carry PINK1 Q456X, LRRK2 G2019S or LRRK2 R1441C mutations.
Cellular reprogramming, validation and differentiation
All iPSCs were generated using standard retrovirus-based protocols ((62, 63) & see Table S1). RT-PCR was performed as described (for primer sequences see Table S2). GTL banding of 20 metaphase cells per iPSC line confirmed normal karyotypes (Cell Line Genetics, Madison, WI). Teratoma analyses were performed in nonobese diabetes/severe-combined immunodeficient mice as described ((64), Applied Stem Cell, Menlo Park, CA). Genomic PCR (for genotyping primer sequences see Table S2) and direct sequencing of the products confirmed the genotypes of the iPSC lines using standard methods as described (65). The iPSCs were differentiated using standard protocols (66) except that recombinant human SHH-C24II protein was replaced by a small molecule agonist of Smoothened (SAG, 1 μM, ENZO, New York, NY) (67, 68).
Patient fibroblast cell lines for determining cytotoxicity assays
For the fibroblast toxicity assays, we used the following PD patients' fibroblasts: 2 patients carrying PINK1 mutations (PINK1 Q456X homozygote (SC1028) and PINK1 D525N/W577R compound (SC1027), 7 patients carrying LRRK2 G2019S mutations (SC1007, SC1012, Coriell ID ND30623, ND29492, ND29542, ND29802, ND30244), 2 patients carrying LRRK2 R1441C mutations (Coriell ID ND32386 PD2, ND32944 PD3). Fibroblasts from 2 healthy subjects were used as controls (Coriell ID AG06010D, AG06959).
In vitro toxicity assays and pharmacological rescue of vulnerability
To assess the dose ranges for PD associated toxins by LDH and MTS assays, neural cells were differentiated from all iPSC lines in parallel weekly batches (66). At DIV52–53 cells were plated in PLO/laminin-coated 96-well plates at a density of 40,000 cells per well. Fibroblasts from PD patients or age-matched healthy subjects were plated in 96-well plates at a density of 5,000 cells per well. Two days later, cells were incubated with valinomycin (0.1–100 μM, Sigma, St. Louis, MO), concanamycin A (0.1–100 nM, Sigma), CCCP (0.1–100 μM, Sigma), hydrogen peroxide (0.01–10 μM, Fisher, Pittsburgh, PA), 6-OHDA (0.1–100 μM, Sigma), MG-132 (0.1–100 μM carbobenzoxy-L-leucyl- L-leucyl-L-leucinal; Calbiochem, La Jolla, CA), or MPP+ (1-methyl-4-phenylpyridinium, 0.1–100 μM, Sigma) for 20 hours. Either water or DMSO was used as vehicle and control conditions. The LDH and MTS assays were performed as described (69) (Roche, Indianapolis, IN). For the pharmacological rescue experiments, a range of concentrations of Coenzyme Q10 (Sigma), rapamycin (Sigma) or GW5074 (Tocris) were screened to minimize drug-mediated toxicity while reducing patient neural cell vulnerability to cellular stressors. The optimal dose of Coenzyme Q10, rapamycin and GW5074 was determined to be 1 μM and was administered to the neural cells 30 minutes prior to and during exposure to the cellular stressors.
Determination of PDiPSC-derived neural cell oxygen consumption rates
(T.D.M. Lab) Mitochondrial oxygen consumption rate (OCR) in iPSC-derived neural cell cultures was analyzed in an XF24-3 Extracellular Flux Analyzer (Seahorse Bioscience, North Billerica, MA). The OCR assay uses probes loaded on a sensor cartridge for fluorimetric detection of oxygen concentration. On Day 53 of differentiation, cells were plated in V7 XF 24 well plates (Seahorse Bioscience) for 5 days. Four wells with no cells were set as background control for temperature-sensitive fluctuations in OCR analysis. For OCR measurements, culture media was replaced with Seahorse XF media, supplemented with 25 mM glucose. The plates were pre incubated in a CO2-free incubator at 37°C for 30 min for equilibration and thereafter processed in the XF analyzer for OCR analysis. OCR analysis was initiated with a 20 minute equilibration, followed by three times cycles of 2 minute mix, 2 minute wait and 2 minute measurement time. All measurement cycles were performed at 37°C as described previously. Baseline OCR was recorded three times and followed by sequential injections of oligomycin (1 μM final concentration, Sigma), carbonyl cyanide-ptrifluoromethoxyphenylhydrazone (FCCP, 3 μM final concentration, Sigma) and rotenone (1μM final concentration, Sigma) into each well. The mix-wait-measure cycles were repeated two times after each drug injection. Following the complete measurements of OCR analysis after third drug injection (rotenone), the experiment was stopped and the data were transformed to show point-point mode display of OCR with background correction, using Seahorse XF software. The data were exported to Excel and normalized to cell number in each well. To determine cell numbers, the media containing detached cells in each well of XF plates was collected in 1.5 ml tubes. 200 μl of TrypLE (Invitrogen) was added to each well of the plate. Following incubation of the plate at 37°C for 3 minutes, the remaining cells from each well were pooled. The cells were centrifuged and the cell pellet was re-suspended in PBS and mixed with trypan blue (Invitrogen) for cell counting in an automated Countess Cell counting analyzer (Invitrogen).
(D.K. Lab) Mitochondrial oxygen consumption rate (OCR) was determined by XF24 Extracellular Flux Analyzer (Seahorse Bioscience, North Billerica, MA). 60,000 cells were plated per well of XF24 plates. Four wells were left empty as background controls. On day 55 of differentiation, the OCR measurements were carried out in N2 media added fresh on the morning of the experiment. Plates were pre-incubated in a CO2-free incubator at 37°C for 30 min for equilibration prior to processing in the XF analyzer. For baseline measurements, a 20 min equilibration step was followed by 5 cycles of 2 minute mix, 2 minute wait, and 2 minute measurement time. For analysis of drug response, three cycles of 2 minute mix, 3 minute wait, and 1.6 minute measurement were used per condition. After 3 baseline measurements were taken, Oligomycin (Sigma, 1 μM), CCCP (Sigma, 1 μM), and Antimycin (Sigma, 0.1 μM) were added sequentially, with three measurements per condition. Following the experiments, cells were harvested and DNA content was measured using Quant-iT PicoGreen (Invitrogen) to normalize for cell number. Data were plotted as absolute values (+/− SEM) to compare baseline OCR, or as percent deviation from baseline (+/− SEM) following drug addition to compare the response to drugs between lines.
Flow cytometric detection of mitochondrial ROS in live PDiPSC-derived neural cells
For low dose toxicity assays, neural cells differentiated from control or PDiPSC lines at DIV52–53 were plated in 24-well PLO/laminin-coated plates at a density of 250,000 cells per well. Two days later, neural cells were incubated with toxins for 20 hours. Mitochondrial reactive oxygen species were identified by MitoSox (Invitrogen). Neural cells were dissociated with 0.05% trypsin, rinsed in HBSS and incubated in MitoSox working solution (50 μg MitoSox reconstituted in 13 μl DMSO and diluted in 5 ml of warm HBSS) at a concentration of 250 ml per well of 24 well-plate. The cells were incubated in MitoSox working solution at 37°C for 10 minutes in the dark. The cells were twice washed in warm HBSS before FACS analysis (FACSAria, BD Biosciences) at 510/580 nm using a live cell gate and standard methods (70).
Immunocytochemistry and confocal microscopy
For immunocytochemistry, the primary antibodies were raised against tyrosine hydroxylase (Pel Freez), type III β-tubulin (Covance) and FOXA2 (Santa Cruz). Indirect immunofluorescence and confocal microscopy was performed as described (66).
Determination of glutathione (GSH) levels
At DIV52–53 of differentiation, 40,000 neural cells were plated per well of PLO/laminin-coated 96 well plates. Two days later, the neural cells were administered cellular stressors or vehicle for 24 hours and lysed. Following the manufacturer's protocol (GSH-Glo, Promega, Madison, WI), the cell lysate was incubated with luciferin and glutathione S-transferase and intracellular GSH levels were measured by luminescence using a plate reader.
Live cell imaging of mitochondrial dynamics
Live imaging experiments were performed in 4-well chambered slides (Lab-Tek, Nunc). A pTurbo-mitoDendra expression vector (a generous gift from Jordi Magrane, Cornell University, New York) was used to visualize the mitochondria. GFP was substituted with the Dendra coding region at the AgeI and NotI sites of the pTurboGFP-mito (Evrogen). The construct was verified by sequencing. Cells were seeded (75,000 cells per chamber) onto poly-ornithine and laminin-coated surfaces (3 μg/ml each). Cells were maintained in Neurobasal complete medium and only cells with a neuronal-like morphology (i.e. multipolar cell bodies with at least two processes), which likely encompassed both neuronal progenitors and neurons, were selected for further analyses. Cells were transduced after 6–7 days in vitro (DIV) with a pTurbo-mitoDendra encoding lentivirus at various multiplicity of infection (MOI). Media was changed after 12 hours and live imaging was performed 72 hours later. Confocal microscopy was performed using a Nikon A1R MP confocal microscope (Nikon Instruments, Melville, NY). The 488 nm laser was maintained below 0.5 mW to avoid photoconversion of Dendra. A 63× oil immersion objective and a pinhole measurement of ~2.5 Airy units (optical slice < 2 μm) were used. Images were collected every 5 seconds for 5 minutes (61 frames). Only the proximal segment of the axon was acquired and recorded. Analyses of axonal and mitochondria lengths were performed as described (71). The dynamics of mitochondria along the axonal processes were studied using Metamorph software (Universal Imaging). Kymographs were generated from each film (position versus time) and used to examine the fraction of mitochondria that were mobile with respect to those that were static. A mitochondrion was considered mobile if it changed its position in at least three consecutive frames. Within mobile mitochondria, we differentiated two different populations: one monotonic (movement in one direction only) and one non-monotonic (movement in various directions). Monotonic mitochondria are classified as anterograde and retrograde.
Electrophysiological recordings
Differentiated neural cell cultures were transferred to a recording chamber of an upright microscope equipped with a 40× water-immersion objective (Eclipse E600FN; Nikon) and perfused with saline containing (mM): 125 NaCl, 2.5 KCl, 25 NaHCO3, 1.25 NaH2PO4, 2 CaCl, 1 MgCl2, and 25 glucose (34 °C; saturated with 95% 02-5% CO2; pH 7.4; 298 mOsm/L). The saline flow rate was 2–3 ml/min running through an in-line heater (SH-27B with TC-324B controller; Warner Instruments). Neurons were visualized by video microscopy with a cooled-CCD digital camera (CoolSNAP ES2, Photometrics, Roper Scientific, Tucson, AZ). Cells selected for electrophysiological recordings had neuron-like shapes showing distinguishable neurites. Somatic whole-cell patch-clamp recordings in current clamp configuration were performed with a MultiClamp 700B amplifier (Molecular Devices). Signals were filtered at 1–4 kHz and digitized at 5–20kHz with a Digidata 1440A (Molecular Devices). Recording patch electrodes had a resistance of 4–6 MΩ and were fabricated from filamented borosilicate glass (Sutter Instruments) pulled on a Flaming-Brown puller (P-97, Sutter Instruments). Patch electrodes were filled with internal solution containing in mM: 135 K-MeSO4, 5 KCl, 5 HEPES, 0.25 EGTA, 10 phosphocreatine-di(tris), 2 ATP-Mg, and 0.5 GTP-Na (pH 7.3, osmolarity adjusted to 290–300 mOsm/L). For current-clamp recordings, the amplifier bridge circuit was adjusted to compensate for electrode resistance and monitored. Electrode capacitance was also compensated. If series resistance increased >20% during the recording, the data were discarded. To study the responsiveness of spontaneous active cells to current commands, a holding current was injected to hyperpolarize the membrane potential around −65 mV, avoiding the spontaneous firing. Then, step current commands were injected to elicit action potentials (1 sec, 5–10 pA). Spontaneous activity was also recorded in current-clamp configuration without holding current.
Automated image acquisition and quantitative analysis of immunocytochemistry
Quantitative analysis of immunocytochemistry was performed on 2 coverslips per experimental condition. Each experimental condition was performed at least three times. Nine images per coverslip were acquired using an IN Cell Analyzer 2000 (GE Healthcare, Piscataway, NJ) at 20× magnification using autofocus. The exposure times were in the range of 0.02–0.03 s for hoechst and β-tubulin and 0.07–0.1s for TH (below saturation). Images were analyzed in an automatic, unbiased way, using IN Cell Workstation Software (GE Healthcare). The numbers of all cells, β-tubulin expressing neurons and TH/β-tubulin coexpressing cells were quantified using a multi-target analysis. Individual cells were identified as having a hoechst stained nuclear area larger than 25 μm2 using top-hat segmentation. β-tubulin and TH expressing cells were identified based on respective staining in an area extending outside of the nucleus with a sensitivity setting of 50.
Statistical Analysis
One- or two-way ANOVA with post-hoc tests or Kolmogorov–Smirnov test were used to analyze data (InStat, GraphPad Software Inc, San Diego, CA; JMP, Cary, NC). p<0.05 was considered significantly different.
Supplementary Material
Overline: Parkinson's Disease.
Single Sentence Summary
Neural cells derived from induced pluripotent stem cells from patients with genetic forms of Parkinson's disease provide insights into disease pathogenesis.
Accessible Summary
Parkinson's disease (PD) is a common, progressive, neurological disease where animal models only partially predict disease mechanisms. In order to obtain a human disease model, we obtained fibroblasts from members of families with genetically defined forms of PD and generated induced pluripotent stem cells (iPSCs). From these patient-derived iPSCs, we differentiated neural cells, including dopaminergic neurons to study how the genetic changes influence the cell biological responses to various cellular stressors. Previously, mitochondrial pathology has been implicated in the pathogenesis of PD. We therefore decided to first examine mitochondrial dysfunction in iPSC-derived neural cells from patients with rare familial forms of PD in order to see whether there are commonalities in terms of vulnerabilities to chemical stressors and toxins. In our experiments, we observed a gradual increase in sensitivity to cellular stress as the cell type analyzed became functionally closer to the vulnerable cell types in the PD patient's brain. In terms of using iPSCs to model PD pathogenesis, the cell stress assays provided an opportunity to investigate aspects of aging-related pathogenesis and an individual's treatment responses. Interestingly, several drugs helped neural cells to resist some of these pathogenic mechanisms and the damage inflicted. These studies with human neural cells from iPSCs highlight opportunities to identify mechanisms and better models for evaluating therapeutic agents.
Acknowledgements
We thank Jennifer Lash, a study coordinator from the Mayo Clinic Florida who was instrumental in assisting in recruitment of patients for this study, and making the travel arrangements for them.
Funding: This work was supported by a grant from the American Recovery and Reinvestment Act-NIH/NINDS (1RC2NS070276) and the NIH U24 grant (1U24NS078338-01) awarded to the PDiPS Cell Research Consortium. O.I., O.C., H.S., M.S., J.M., T.O., G.H., M.D., T.L., H.B. and E.P.-T. were supported by the Michael J. Fox Foundation, the Harvard Stem Cell Institute Miller Consortium, the Orchard Foundation, the Harold and Ronna Cooper Family, the Consolidated Anti-Aging Foundation and the Poul Hansen Family. Z.K.W. was partially supported by the NIH/NINDS NS057567, P50NS072187, Mayo Clinic Florida (MCF) Research Committee CR program (MCF #90052030), Dystonia Medical Research Foundation, and the gift from Carl Edward Bolch, Jr., and Susan Bass Bolch (MCF #90052031/PAU #90052). S.A., L.C., L.A.S., V.L.D. and T.M.D. were supported by NIH/NINDS NS38377, the Maryland Stem Cell Research Foundation 2007-MSCRFI-0420-00, and acknowledge the joint participation by the Adrienne Helis Malvin Medical Research Foundation through its direct engagement in the continuous active conduct of medical research in conjunction with The Johns Hopkins Hospital and the Johns Hopkins University School of Medicine and the Foundation's Parkinson's Disease Program No. M-1. C.K. was supported by a career development award from the Hermann and Lilly Schilling Foundation.
Footnotes
Author contributions: O.C., H.S., S.A., C. G.-L., J.G., M.S., J.R.M., L.C.-R., Z.X., T.O., G.H., M.D., T.L., H.B., E.P.-T., L.C., C.M., J.M., L.C., L.V.-D., N.R., H.J., R.J.U., Z.H., G.O., L.A.S., V.L.D., C.K., J.F., O.A.R., J.Q.T., V.M.-Y.L., K.M., D.J.S., Z.K.W., S.P., D.K., T.M.D. and O.I. contributed to the ideas and designs of the experiments. O.C., H.S. and O.I. designed the experiments and wrote the manuscript. O.C., H.S., M.S., T.O., G.H. and M.D. performed cytotoxicity assays. S.A., L.A.S., V.L.D., T.M.D., J.G., J.M., and D.K. designed, performed and analyzed the oxygen consumption rates of neural cells. O.C., H.S., M.S., M.D., T.L. and E.P.-T. performed the experiments using flow cytometry. C.G.-L., N.R. and S.P. designed, performed and analyzed the mitochondrial dynamics in neurons. O.C., J.M. and O.I. performed and analyzed the genotyping and transgene silencing of the iPSC lines. L.C.-R., Z.X. and D.J.S. designed, performed and analyzed the electrophysiological experiments for PDiPSC-derived neurons. O.C., M.S., T.O., G.H., M.D., T.L., H.B. and O.I. performed and analyzed differentiation experiments. L.C., C.M., R.J.U., Z.H., G.O., K.M., T.M.D. and Z.K.W. recruited and genotyped patients, created fibroblast samples. D.K. and C.K. provided the PINK1 PD patient and healthy subject iPSC lines.
Competing interests: T.M.D. is a paid consultant to Merck KGAA, TEVA Pharmaceuticals, UptoDate Inc., Boehringer Ingelheim, Glaxo Research and Development LTD, Pfizer Inc, QRx Pharma, Shering-Plough Research Inst. The terms of these arrangements are being managed by the Johns Hopkins University in accordance with its conflict of interest policies. Z.W. has a financial interest in a technology (LRRK2 gene test), which has been licensed to a commercial entity. Mayo Clinic and Z.W. receive roylaties from that license. The other authors declare that they have no competing interests.
Data and Materials: The biological samples, fibroblasts and iPSC used are stored at the participating institutions and will also be stored at the NINDS Human Genetics DNA and Cell Line Repository at Coriell Institute for Medical Research.
References and Notes
- 1.Chung CY, Seo H, Sonntag KC, Brooks A, Lin L, Isacson O. Cell type-specific gene expression of midbrain dopaminergic neurons reveals molecules involved in their vulnerability and protection. Hum Mol Genet. 2005 Jul 1;14:1709. doi: 10.1093/hmg/ddi178. [DOI] [PMC free article] [PubMed] [Google Scholar]
- 2.Guzman JN, Sanchez-Padilla J, Wokosin D, Kondapalli J, Ilijic E, Schumacker PT, Surmeier DJ. Oxidant stress evoked by pacemaking in dopaminergic neurons is attenuated by DJ-1. Nature. 2010 Dec 2;468:696. doi: 10.1038/nature09536. [DOI] [PMC free article] [PubMed] [Google Scholar]
- 3.Lesnick TG, Papapetropoulos S, Mash DC, Ffrench-Mullen J, Shehadeh L, de Andrade M, Henley JR, Rocca WA, Ahlskog JE, Maraganore DM. A genomic pathway approach to a complex disease: axon guidance and Parkinson disease. PLoS Genet. 2007 Jun;3:e98. doi: 10.1371/journal.pgen.0030098. [DOI] [PMC free article] [PubMed] [Google Scholar]
- 4.Langston JW, Ballard P, Tetrud JW, Irwin I. Chronic parkinsonism in humans due to a product of meperidine analog synthesis. Science. 1983;219:979. doi: 10.1126/science.6823561. [DOI] [PubMed] [Google Scholar]
- 5.Gorell JM, Johnson CC, Rybicki BA, Peterson EL, Richardson RJ. The risk of Parkinson's disease with exposure to pesticides, farming, well water, and rural living. Neurology. 1998;50(5):1346–50. doi: 10.1212/wnl.50.5.1346. [DOI] [PubMed] [Google Scholar]
- 6.Simon-Sanchez J, Schulte C, Bras JM, Sharma M, Gibbs JR, Berg D, Paisan-Ruiz C, Lichtner P, Scholz SW, Hernandez DG, Kruger R, Federoff M, Klein C, Goate A, Perlmutter J, Bonin M, Nalls MA, Illig T, Gieger C, Houlden H, Steffens M, Okun MS, Racette BA, Cookson MR, Foote KD, Fernandez HH, Traynor BJ, Schreiber S, Arepalli S, Zonozi R, Gwinn K, van der Brug M, Lopez G, Chanock SJ, Schatzkin A, Park Y, Hollenbeck A, Gao J, Huang X, Wood NW, Lorenz D, Deuschl G, Chen H, Riess O, Hardy JA, Singleton AB, Gasser T. Genome-wide association study reveals genetic risk underlying Parkinson's disease. Nat Genet. 2009 Dec;41:1308. doi: 10.1038/ng.487. [DOI] [PMC free article] [PubMed] [Google Scholar]
- 7.Cookson MR, Bandmann O. Parkinson's disease: insights from pathways. Hum Mol Genet. 2010 Apr 15;19:R21. doi: 10.1093/hmg/ddq167. [DOI] [PMC free article] [PubMed] [Google Scholar]
- 8.Hardy J. Genetic analysis of pathways to Parkinson disease. Neuron. 2010 Oct 21;68:201. doi: 10.1016/j.neuron.2010.10.014. [DOI] [PMC free article] [PubMed] [Google Scholar]
- 9.Zimprich A, Biskup S, Leitner P, Lichtner P, Farrer M, Lincoln S, Kachergus J, Hulihan M, Uitti RJ, Calne DB, Stoessl AJ, Pfeiffer RF, Patenge N, Carbajal IC, Vieregge P, Asmus F, Muller-Myhsok B, Dickson DW, Meitinger T, Strom TM, Wszolek ZK, Gasser T. Mutations in LRRK2 cause autosomal-dominant parkinsonism with pleomorphic pathology. Neuron. 2004 Nov 18;44:601. doi: 10.1016/j.neuron.2004.11.005. [DOI] [PubMed] [Google Scholar]
- 10.Paisan-Ruiz C, Jain S, Evans EW, Gilks WP, Simon J, van der Brug M, Lopez de Munain A, Aparicio S, Gil AM, Khan N, Johnson J, Martinez JR, Nicholl D, Carrera IM, Pena AS, de Silva R, Lees A, Marti-Masso JF, Perez-Tur J, Wood NW, Singleton AB. Cloning of the gene containing mutations that cause PARK8-linked Parkinson's disease. Neuron. 2004 Nov 18;44:595. doi: 10.1016/j.neuron.2004.10.023. [DOI] [PubMed] [Google Scholar]
- 11.Aasly JO, Toft M, Fernandez-Mata I, Kachergus J, Hulihan M, White LR, Farrer M. Clinical features of LRRK2-associated Parkinson's disease in central Norway. Ann Neurol. 2005 May;57:762. doi: 10.1002/ana.20456. [DOI] [PubMed] [Google Scholar]
- 12.Healy DG, Falchi M, O'Sullivan SS, Bonifati V, Durr A, Bressman S, Brice A, Aasly J, Zabetian CP, Goldwurm S, Ferreira JJ, Tolosa E, Kay DM, Klein C, Williams DR, Marras C, Lang AE, Wszolek ZK, Berciano J, Schapira AH, Lynch T, Bhatia KP, Gasser T, Lees AJ, Wood NW. Phenotype, genotype, and worldwide genetic penetrance of LRRK2-associated Parkinson's disease: a case-control study. Lancet Neurol. 2008 Jul;7:583. doi: 10.1016/S1474-4422(08)70117-0. [DOI] [PMC free article] [PubMed] [Google Scholar]
- 13.Chen-Plotkin AS, Yuan W, Anderson C, McCarty Wood E, Hurtig HI, Clark CM, Miller BL, Lee VM, Trojanowski JQ, Grossman M, Van Deerlin VM. Corticobasal syndrome and primary progressive aphasia as manifestations of LRRK2 gene mutations. Neurology. 2008 Feb 12;70:521. doi: 10.1212/01.WNL.0000280574.17166.26. [DOI] [PMC free article] [PubMed] [Google Scholar]
- 14.Giasson BI, Covy JP, Bonini NM, Hurtig HI, Farrer MJ, Trojanowski JQ, Van Deerlin VM. Biochemical and pathological characterization of Lrrk2. Ann Neurol. 2006 Feb;59:315. doi: 10.1002/ana.20791. [DOI] [PubMed] [Google Scholar]
- 15.Lee BD, Shin JH, VanKampen J, Petrucelli L, West AB, Ko HS, Lee YI, Maguire-Zeiss KA, Bowers WJ, Federoff HJ, Dawson VL, Dawson TM. Inhibitors of leucine-rich repeat kinase-2 protect against models of Parkinson's disease. Nat Med. 2010 Sep;16:998. doi: 10.1038/nm.2199. [DOI] [PMC free article] [PubMed] [Google Scholar]
- 16.Cookson MR. The role of leucine-rich repeat kinase 2 (LRRK2) in Parkinson's disease. Nat Rev Neurosci. 2010 Dec;11:791. doi: 10.1038/nrn2935. [DOI] [PMC free article] [PubMed] [Google Scholar]
- 17.Valente EM, Abou-Sleiman PM, Caputo V, Muqit MM, Harvey K, Gispert S, Ali Z, Del Turco D, Bentivoglio AR, Healy DG, Albanese A, Nussbaum R, Gonzalez-Maldonado R, Deller T, Salvi S, Cortelli P, Gilks WP, Latchman DS, Harvey RJ, Dallapiccola B, Auburger G, Wood NW. Hereditary early-onset Parkinson's disease caused by mutations in PINK1. Science. 2004 May 21;304:1158. doi: 10.1126/science.1096284. [DOI] [PubMed] [Google Scholar]
- 18.Valente EM, Bentivoglio AR, Dixon PH, Ferraris A, Ialongo T, Frontali M, Albanese A, Wood NW. Localization of a novel locus for autosomal recessive early-onset parkinsonism, PARK6, on human chromosome 1p35-p36. Am J Hum Genet. 2001 Apr;68:895. doi: 10.1086/319522. [DOI] [PMC free article] [PubMed] [Google Scholar]
- 19.Hatano Y, Sato K, Elibol B, Yoshino H, Yamamura Y, Bonifati V, Shinotoh H, Asahina M, Kobayashi S, Ng AR, Rosales RL, Hassin-Baer S, Shinar Y, Lu CS, Chang HC, Wu-Chou YH, Atac FB, Kobayashi T, Toda T, Mizuno Y, Hattori N. PARK6-linked autosomal recessive early-onset parkinsonism in Asian populations. Neurology. 2004 Oct 26;63:1482. doi: 10.1212/01.wnl.0000142258.29304.fe. [DOI] [PubMed] [Google Scholar]
- 20.Hatano Y, Li Y, Sato K, Asakawa S, Yamamura Y, Tomiyama H, Yoshino H, Asahina M, Kobayashi S, Hassin-Baer S, Lu CS, Ng AR, Rosales RL, Shimizu N, Toda T, Mizuno Y, Hattori N. Novel PINK1 mutations in early-onset parkinsonism. Ann Neurol. 2004 Sep;56:424. doi: 10.1002/ana.20251. [DOI] [PubMed] [Google Scholar]
- 21.Hedrich K, Hagenah J, Djarmati A, Hiller A, Lohnau T, Lasek K, Grunewald A, Hilker R, Steinlechner S, Boston H, Kock N, Schneider-Gold C, Kress W, Siebner H, Binkofski F, Lencer R, Munchau A, Klein C. Clinical spectrum of homozygous and heterozygous PINK1 mutations in a large German family with Parkinson disease: role of a single hit? Arch Neurol. 2006 Jun;63:833. doi: 10.1001/archneur.63.6.833. [DOI] [PubMed] [Google Scholar]
- 22.Kasten M, Weichert C, Lohmann K, Klein C. Clinical and demographic characteristics of PINK1 mutation carriers--a meta-analysis. Mov Disord. 2010 May 15;25:952. doi: 10.1002/mds.23031. [DOI] [PubMed] [Google Scholar]
- 23.Satake W, Nakabayashi Y, Mizuta I, Hirota Y, Ito C, Kubo M, Kawaguchi T, Tsunoda T, Watanabe M, Takeda A, Tomiyama H, Nakashima K, Hasegawa K, Obata F, Yoshikawa T, Kawakami H, Sakoda S, Yamamoto M, Hattori N, Murata M, Nakamura Y, Toda T. Genome-wide association study identifies common variants at four loci as genetic risk factors for Parkinson's disease. Nat Genet. 2009 Dec;41:1303. doi: 10.1038/ng.485. [DOI] [PubMed] [Google Scholar]
- 24.Edwards YJ, Beecham GW, Scott WK, Khuri S, Bademci G, Tekin D, Martin ER, Jiang Z, Mash DC, ffrench-Mullen J, Pericak-Vance MA, Tsinoremas N, Vance JM. Identifying consensus disease pathways in Parkinson's disease using an integrative systems biology approach. PLoS One. 2011;6:e16917. doi: 10.1371/journal.pone.0016917. [DOI] [PMC free article] [PubMed] [Google Scholar]
- 25.Klein C, Chuang R, Marras C, Lang AE. The curious case of phenocopies in families with genetic Parkinson's disease. Mov Disord. 2011 Aug 15;26:1793. doi: 10.1002/mds.23853. [DOI] [PubMed] [Google Scholar]
- 26.Israel MA, Yuan SH, Bardy C, Reyna SM, Mu Y, Herrera C, Hefferan MP, Van Gorp S, Nazor KL, Boscolo FS, Carson CT, Laurent LC, Marsala M, Gage FH, Remes AM, Koo EH, Goldstein LS. Probing sporadic and familial Alzheimer's disease using induced pluripotent stem cells. Nature. 2012 Feb 9;482:216. doi: 10.1038/nature10821. [DOI] [PMC free article] [PubMed] [Google Scholar]
- 27.Seibler P, Graziotto J, Jeong H, Simunovic F, Klein C, Krainc D. Mitochondrial Parkin Recruitment Is Impaired in Neurons Derived from Mutant PINK1 Induced Pluripotent Stem Cells. J Neurosci. 2011 Apr 20;31:5970. doi: 10.1523/JNEUROSCI.4441-10.2011. [DOI] [PMC free article] [PubMed] [Google Scholar]
- 28.Vives-Bauza C, Zhou C, Huang Y, Cui M, de Vries RL, Kim J, May J, Tocilescu MA, Liu W, Ko HS, Magrane J, Moore DJ, Dawson VL, Grailhe R, Dawson TM, Li C, Tieu K, Przedborski S. PINK1-dependent recruitment of Parkin to mitochondria in mitophagy. Proc Natl Acad Sci U S A. 2010 Jan 5;107:378. doi: 10.1073/pnas.0911187107. [DOI] [PMC free article] [PubMed] [Google Scholar]
- 29.Van Laar VS, Arnold B, Cassady SJ, Chu CT, Burton EA, Berman SB. Bioenergetics of neurons inhibit the translocation response of Parkin following rapid mitochondrial depolarization. Hum Mol Genet. 2011 Mar 1;20:927. doi: 10.1093/hmg/ddq531. [DOI] [PMC free article] [PubMed] [Google Scholar]
- 30.Brustovetsky T, Li V, Brustovetsky N. Stimulation of glutamate receptors in cultured hippocampal neurons causes Ca2+−dependent mitochondrial contraction. Cell Calcium. 2009 Jul;46:18. doi: 10.1016/j.ceca.2009.03.017. [DOI] [PMC free article] [PubMed] [Google Scholar]
- 31.Nishi T, Forgac M. The vacuolar (H+)-ATPases--nature's most versatile proton pumps. Nat Rev Mol Cell Biol. 2002 Feb;3:94. doi: 10.1038/nrm729. [DOI] [PubMed] [Google Scholar]
- 32.Drose S, Bindseil KU, Bowman EJ, Siebers A, Zeeck A, Altendorf K. Inhibitory effect of modified bafilomycins and concanamycins on P- and V-type adenosinetriphosphatases. Biochemistry. 1993 Apr 20;32:3902. doi: 10.1021/bi00066a008. [DOI] [PubMed] [Google Scholar]
- 33.Zhdanov AV, Dmitriev RI, Papkovsky DB. Bafilomycin A1 activates respiration of neuronal cells via uncoupling associated with flickering depolarization of mitochondria. Cell Mol Life Sci. 2011 Mar;68:903. doi: 10.1007/s00018-010-0502-8. [DOI] [PMC free article] [PubMed] [Google Scholar]
- 34.Teplova VV, Tonshin AA, Grigoriev PA, Saris NE, Salkinoja-Salonen MS. Bafilomycin A1 is a potassium ionophore that impairs mitochondrial functions. J Bioenerg Biomembr. 2007 Aug;39:321. doi: 10.1007/s10863-007-9095-9. [DOI] [PubMed] [Google Scholar]
- 35.Grunewald A, Breedveld GJ, Lohmann-Hedrich K, Rohe CF, Konig IR, Hagenah J, Vanacore N, Meco G, Antonini A, Goldwurm S, Lesage S, Durr A, Binkofski F, Siebner H, Munchau A, Brice A, Oostra BA, Klein C, Bonifati V. Biological effects of the PINK1 c.1366C>T mutation: implications in Parkinson disease pathogenesis. Neurogenetics. 2007 Apr;8:103. doi: 10.1007/s10048-006-0072-y. [DOI] [PubMed] [Google Scholar]
- 36.Divakaruni AS, Brand MD. The regulation and physiology of mitochondrial proton leak. Physiology (Bethesda) 2011 Jun;26:192. doi: 10.1152/physiol.00046.2010. [DOI] [PubMed] [Google Scholar]
- 37.West AB, Moore DJ, Biskup S, Bugayenko A, Smith WW, Ross CA, Dawson VL, Dawson TM. Parkinson's disease-associated mutations in leucine-rich repeat kinase 2 augment kinase activity. Proc Natl Acad Sci U S A. 2005 Nov 15;102:16842. doi: 10.1073/pnas.0507360102. [DOI] [PMC free article] [PubMed] [Google Scholar]
- 38.Morfini G, Pigino G, Opalach K, Serulle Y, Moreira JE, Sugimori M, Llinas RR, Brady ST. 1-Methyl-4-phenylpyridinium affects fast axonal transport by activation of caspase and protein kinase C. Proc Natl Acad Sci U S A. 2007 Feb 13;104:2442. doi: 10.1073/pnas.0611231104. [DOI] [PMC free article] [PubMed] [Google Scholar]
- 39.Saha AR, Hill J, Utton MA, Asuni AA, Ackerley S, Grierson AJ, Miller CC, Davies AM, Buchman VL, Anderton BH, Hanger DP. Parkinson's disease alpha-synuclein mutations exhibit defective axonal transport in cultured neurons. J Cell Sci. 2004 Mar 1;117:1017. doi: 10.1242/jcs.00967. [DOI] [PubMed] [Google Scholar]
- 40.Chung CY, Koprich JB, Siddiqi H, Isacson O. Dynamic changes in presynaptic and axonal transport proteins combined with striatal neuroinflammation precede dopaminergic neuronal loss in a rat model of AAV alpha-synucleinopathy. J Neurosci. 2009 Mar 18;29:3365. doi: 10.1523/JNEUROSCI.5427-08.2009. [DOI] [PMC free article] [PubMed] [Google Scholar]
- 41.Goldstein LS, Yang Z. Microtubule-based transport systems in neurons: the roles of kinesins and dyneins. Annu Rev Neurosci. 2000;23:39. doi: 10.1146/annurev.neuro.23.1.39. [DOI] [PubMed] [Google Scholar]
- 42.Gillardon F. Leucine-rich repeat kinase 2 phosphorylates brain tubulin-beta isoforms and modulates microtubule stability--a point of convergence in parkinsonian neurodegeneration? J Neurochem. 2009 Sep;110:1514. doi: 10.1111/j.1471-4159.2009.06235.x. [DOI] [PubMed] [Google Scholar]
- 43.Frei B, Kim MC, Ames BN. Ubiquinol-10 is an effective lipid-soluble antioxidant at physiological concentrations. Proc Natl Acad Sci U S A. 1990 Jun;87:4879. doi: 10.1073/pnas.87.12.4879. [DOI] [PMC free article] [PubMed] [Google Scholar]
- 44.Chin PC, Liu L, Morrison BE, Siddiq A, Ratan RR, Bottiglieri T, D'Mello SR. The c-Raf inhibitor GW5074 provides neuroprotection in vitro and in an animal model of neurodegeneration through a MEK-ERK and Akt-independent mechanism. J Neurochem. 2004 Aug;90:595. doi: 10.1111/j.1471-4159.2004.02530.x. [DOI] [PubMed] [Google Scholar]
- 45.Dehay B, Bove J, Rodriguez-Muela N, Perier C, Recasens A, Boya P, Vila M. Pathogenic lysosomal depletion in Parkinson's disease. J Neurosci. 2010 Sep 15;30:12535. doi: 10.1523/JNEUROSCI.1920-10.2010. [DOI] [PMC free article] [PubMed] [Google Scholar]
- 46.Malagelada C, Jin ZH, Jackson-Lewis V, Przedborski S, Greene LA. Rapamycin protects against neuron death in in vitro and in vivo models of Parkinson's disease. J Neurosci. 2010 Jan 20;30:1166. doi: 10.1523/JNEUROSCI.3944-09.2010. [DOI] [PMC free article] [PubMed] [Google Scholar]
- 47.Malagelada C, Jin ZH, Greene LA. RTP801 is induced in Parkinson's disease and mediates neuron death by inhibiting Akt phosphorylation/activation. J Neurosci. 2008 Dec 31;28:14363. doi: 10.1523/JNEUROSCI.3928-08.2008. [DOI] [PMC free article] [PubMed] [Google Scholar]
- 48.Tain LS, Mortiboys H, Tao RN, Ziviani E, Bandmann O, Whitworth AJ. Rapamycin activation of 4E-BP prevents parkinsonian dopaminergic neuron loss. Nat Neurosci. 2009 Sep;12:1129. doi: 10.1038/nn.2372. [DOI] [PMC free article] [PubMed] [Google Scholar]
- 49.Mortiboys H, Johansen KK, Aasly JO, Bandmann O. Mitochondrial impairment in patients with Parkinson disease with the G2019S mutation in LRRK2. Neurology. 2010 Nov 30;75:2017. doi: 10.1212/WNL.0b013e3181ff9685. [DOI] [PubMed] [Google Scholar]
- 50.Piccoli C, Sardanelli A, Scrima R, Ripoli M, Quarato G, D'Aprile A, Bellomo F, Scacco S, De Michele G, Filla A, Iuso A, Boffoli D, Capitanio N, Papa S. Mitochondrial respiratory dysfunction in familiar parkinsonism associated with PINK1 mutation. Neurochem Res. 2008 Dec;33:2565. doi: 10.1007/s11064-008-9729-2. [DOI] [PubMed] [Google Scholar]
- 51.Rakovic A, Grunewald A, Seibler P, Ramirez A, Kock N, Orolicki S, Lohmann K, Klein C. Effect of endogenous mutant and wild-type PINK1 on Parkin in fibroblasts from Parkinson disease patients. Hum Mol Genet. 2010 Aug 15;19:3124. doi: 10.1093/hmg/ddq215. [DOI] [PubMed] [Google Scholar]
- 52.Rakovic A, Grunewald A, Kottwitz J, Bruggemann N, Pramstaller PP, Lohmann K, Klein C. Mutations in PINK1 and Parkin impair ubiquitination of Mitofusins in human fibroblasts. PLoS One. 2011;6:e16746. doi: 10.1371/journal.pone.0016746. [DOI] [PMC free article] [PubMed] [Google Scholar]
- 53.Damier P, Hirsch EC, Agid Y, Graybiel AM. The substantia nigra of the human brain. II. Patterns of loss of dopamine-containing neurons in Parkinson's disease. Brain. 1999 Aug;122:1437. doi: 10.1093/brain/122.8.1437. [DOI] [PubMed] [Google Scholar]
- 54.Brooks DJ. Examining Braak's hypothesis by imaging Parkinson's disease. Mov Disord. 2010;25(Suppl 1):S83. doi: 10.1002/mds.22720. [DOI] [PubMed] [Google Scholar]
- 55.Bender A, Krishnan KJ, Morris CM, Taylor GA, Reeve AK, Perry RH, Jaros E, Hersheson JS, Betts J, Klopstock T, Taylor RW, Turnbull DM. High levels of mitochondrial DNA deletions in substantia nigra neurons in aging and Parkinson disease. Nat Genet. 2006 May;38:515. doi: 10.1038/ng1769. [DOI] [PubMed] [Google Scholar]
- 56.Kraytsberg Y, Kudryavtseva E, McKee AC, Geula C, Kowall NW, Khrapko K. Mitochondrial DNA deletions are abundant and cause functional impairment in aged human substantia nigra neurons. Nat Genet. 2006 May;38:518. doi: 10.1038/ng1778. [DOI] [PubMed] [Google Scholar]
- 57.Colman A, Dreesen O. Pluripotent stem cells and disease modeling. Cell Stem Cell. 2009 Sep 4;5:244. doi: 10.1016/j.stem.2009.08.010. [DOI] [PubMed] [Google Scholar]
- 58.Saha K, Jaenisch R. Technical challenges in using human induced pluripotent stem cells to model disease. Cell Stem Cell. 2009 Dec 4;5:584. doi: 10.1016/j.stem.2009.11.009. [DOI] [PMC free article] [PubMed] [Google Scholar]
- 59.Rubin LL. Stem cells and drug discovery: the beginning of a new era? Cell. 2008 Feb 22;132:549. doi: 10.1016/j.cell.2008.02.010. [DOI] [PubMed] [Google Scholar]
- 60.Wszolek ZK, Pfeiffer RF, Tsuboi Y, Uitti RJ, McComb RD, Stoessl AJ, Strongosky AJ, Zimprich A, Muller-Myhsok B, Farrer MJ, Gasser T, Calne DB, Dickson DW. Autosomal dominant parkinsonism associated with variable synuclein and tau pathology. Neurology. 2004 May 11;62:1619. doi: 10.1212/01.wnl.0000125015.06989.db. [DOI] [PubMed] [Google Scholar]
- 61.Ishihara L, Warren L, Gibson R, Amouri R, Lesage S, Durr A, Tazir M, Wszolek ZK, Uitti RJ, Nichols WC, Griffith A, Hattori N, Leppert D, Watts R, Zabetian CP, Foroud TM, Farrer MJ, Brice A, Middleton L, Hentati F. Clinical features of Parkinson disease patients with homozygous leucine-rich repeat kinase 2 G2019S mutations. Arch Neurol. 2006 Sep;63:1250. doi: 10.1001/archneur.63.9.1250. [DOI] [PubMed] [Google Scholar]
- 62.Chan EM, Ratanasirintrawoot S, Park IH, Manos PD, Loh YH, Huo H, Miller JD, Hartung O, Rho J, Ince TA, Daley GQ, Schlaeger TM. Live cell imaging distinguishes bona fide human iPS cells from partially reprogrammed cells. Nat Biotechnol. 2009 Nov;27:1033. doi: 10.1038/nbt.1580. [DOI] [PubMed] [Google Scholar]
- 63.Boulting GL, Kiskinis E, Croft GF, Amoroso MW, Oakley DH, Wainger BJ, Williams DJ, Kahler DJ, Yamaki M, Davidow L, Rodolfa CT, Dimos JT, Mikkilineni S, Macdermott AB, Woolf CJ, Henderson CE, Wichterle H, Eggan K. A functionally characterized test set of human induced pluripotent stem cells. Nat Biotechnol. 2011 Feb 3; doi: 10.1038/nbt.1783. [DOI] [PMC free article] [PubMed] [Google Scholar]
- 64.Deleidi M, Hargus G, Hallett P, Osborn T, Isacson O. Development of histocompatible primate-induced pluripotent stem cells for neural transplantation. Stem Cells. 2011 Jul;29:1052. doi: 10.1002/stem.662. [DOI] [PMC free article] [PubMed] [Google Scholar]
- 65.Deng H, Le W, Guo Y, Hunter CB, Xie W, Huang M, Jankovic J. Genetic analysis of LRRK2 mutations in patients with Parkinson disease. J Neurol Sci. 2006 Dec 21;251:102. doi: 10.1016/j.jns.2006.09.017. [DOI] [PubMed] [Google Scholar]
- 66.Cooper O, Hargus G, Deleidi M, Blak A, Osborn T, Marlow E, Lee K, Levy A, Perez-Torres E, Yow A, Isacson O. Differentiation of human ES and Parkinson's disease iPS cells into ventral midbrain dopaminergic neurons requires a high activity form of SHH, FGF8a and specific regionalization by retinoic acid. Mol Cell Neurosci. 2010 Nov;45:258. doi: 10.1016/j.mcn.2010.06.017. [DOI] [PMC free article] [PubMed] [Google Scholar]
- 67.Frank-Kamenetsky M, Zhang XM, Bottega S, Guicherit O, Wichterle H, Dudek H, Bumcrot D, Wang FY, Jones S, Shulok J, Rubin LL, Porter JA. Small-molecule modulators of Hedgehog signaling: identification and characterization of Smoothened agonists and antagonists. J Biol. 2002 Nov 6;1:10. doi: 10.1186/1475-4924-1-10. [DOI] [PMC free article] [PubMed] [Google Scholar]
- 68.Chen JK, Taipale J, Young KE, Maiti T, Beachy PA. Small molecule modulation of Smoothened activity. Proc Natl Acad Sci U S A. 2002 Oct 29;99:14071. doi: 10.1073/pnas.182542899. [DOI] [PMC free article] [PubMed] [Google Scholar]
- 69.Chung CY, Seo H, Sonntag KC, Brooks A, Lin L, Isacson O. Cell type specific gene expression of midbrain dopaminergic neurons reveals molecules involved in their vulnerability and protection. Hum Mol Genet. 2005 Jul 1;14:1709. doi: 10.1093/hmg/ddi178. [DOI] [PMC free article] [PubMed] [Google Scholar]
- 70.Pruszak J, Ludwig W, Blak A, Alavian K, Isacson O. CD15, CD24, and CD29 define a surface biomarker code for neural lineage differentiation of stem cells. Stem Cells. 2009 Dec;27:2928. doi: 10.1002/stem.211. [DOI] [PMC free article] [PubMed] [Google Scholar]
- 71.Magrane J, Hervias I, Henning MS, Damiano M, Kawamata H, Manfredi G. Mutant SOD1 in neuronal mitochondria causes toxicity and mitochondrial dynamics abnormalities. Hum Mol Genet. 2009 Dec 1;18:4552. doi: 10.1093/hmg/ddp421. [DOI] [PMC free article] [PubMed] [Google Scholar]
Associated Data
This section collects any data citations, data availability statements, or supplementary materials included in this article.