Abstract
We have designed, fabricated and evaluated a novel translating stage system (TSS) that augments a conventional micro particle image velocimetry (µ-PIV) system. The TSS has been used to enhance the ability to measure flow fields surrounding the tip of a migrating semi-infinite bubble in a glass capillary tube under both steady and pulsatile reopening conditions. With conventional µ-PIV systems, observations near the bubble tip are challenging because the forward progress of the bubble rapidly sweeps the air–liquid interface across the microscopic field of view. The translating stage mechanically cancels the mean bubble tip velocity, keeping the interface within the microscope field of view and providing a tenfold increase in data collection efficiency compared to fixed-stage techniques. This dramatic improvement allows nearly continuous observation of the flow field over long propagation distances. A large (136-frame) ensemble-averaged velocity field recorded with the TSS near the tip of a steadily migrating bubble is shown to compare well with fixed-stage results under identical flow conditions. Use of the TSS allows the ensemble-averaged measurement of pulsatile bubble propagation flow fields, which would be practically impossible using conventional fixed-stage techniques. We demonstrate our ability to analyze these time-dependent two-phase flows using the ensemble-averaged flow field at four points in the oscillatory cycle.
Keywords: micro-PIV, interfacial flows, pulmonary airway reopening
1. Introduction
In this paper, we present a novel translating stage system (TSS) designed to enable continuous microscale particle image velocimetry (µ-PIV) measurements of the flow field surrounding the tip of a migrating semi-infinite bubble propagating through a sub-millimeter glass capillary tube. We have developed this technique to allow observation of time-dependent pulsatile propagation because resolving these phenomena with a fixed stage presents intractable experimental difficulties.
In a previous study (Yamaguchi et al 2009), our group employed µ-PIV to determine the ensemble-averaged flow field surrounding the tip of a semi-infinite bubble migrating with a constant velocity. Such observations are difficult because the forward progress of the interface rapidly sweeps the bubble tip region of interest across the field of view. In our previous study, the bubble tip traversed the microscope field of view in approximately 140 ms; approximately 2% of the images recorded in this study contained the bubble tip.
To increase the efficiency of data collection, and thereby allow the analysis of oscillatory flows, we have created a translating stage system that effectively removes the mean forward velocity of the air–liquid interface, keeping the bubble tip visible in the microscope field of view. In the current study, we have achieved a success rate >90% for steady propagation, which we define as capturing the bubble tip in the 500 µm window required for µ-PIV measurement. As such, the TSS allows the acquisition of significantly larger sets of data in substantially shorter periods of time, which reduces the unwanted accumulation of fluorescent particles at the bubble tip as discussed in Yamaguchi et al (2009). This process provides the investigator with a spatially—and temporally—continuous description of the flow dynamics in the fluid surrounding the advancing bubble.
The purpose of the TSS is to enable observation of bubble propagation driven by flow with both mean and sinusoidal oscillatory components. Such phenomena are nearly impossible to observe with the necessary resolution in a fixed reference frame because data must be recorded describing oscillatory behavior that spans a spatial region larger than the observation window. However, by translating the capillary tube opposite the flow direction at the mean bubble tip velocity, we are able to create ensemble-averaged velocity fields for 16 temporal segments of the oscillatory cycle.
This paper is oriented toward our specific application, the measurement of pulsatile bubble motion in a capillary tube. Our interest in this phenomenon stems from pulmonary airway reopening, where a finger of air propagates through a viscous occlusion, restoring airflow to the alveoli (the primary site of gas exchange). As described below, mechanical cancellation of the forward velocity of a free surface is applied to achieve high-resolution ensemble-averaged velocity fields. This general technique may be applied to a diverse spectrum of applications involving µ-PIV and other observation techniques. For instance, droplet-based mixing devices rely on recirculating flows to enhance mixing and reactions as the droplets travel through channels in a microscale system (Khandurina and Guttman 2002, Stone et al 2004, Tan et al 2004, Huebner et al 2008). Because of the propagation distances, high-resolution measurements of the flow field (using µ-PIV) and concentrations (using laser-induced fluorescence) would be aided by observing the system in the droplet frame of reference.
The experimental procedure and results presented herein contain three novel components that extend the capabilities of a standard µ-PIV to allow for the analysis of time-dependent two-phase flows.
A translating stage system is employed to cancel the mean forward velocity of the bubble tip. This technique retains the bubble tip in the microscope field of view and therefore allows the investigation of pulsatile bubble propagation, a phenomenon inaccessible in traditional fixed-stage experiments.
We have validated the translating stage through the flow-field analysis of steady bubble propagation. This required the measurement of a large ensemble-averaged velocity field (136 frames) that resulted in a tenfold increase in data collection efficiency compared to fixed-stage methods.
We present a successful technique for determining the ensemble-averaged velocities of cyclic unsteady flows and demonstrate its use and accuracy.
2. Background
Steady air finger propagation in tubes and channels has been a topic of investigation for nearly a century. Early experimental studies by Fairbrother and Stubbs (1935), Bretherton (1961) and Cox (1962) led to extensive computational work beginning in the early 1980s. Reinelt and Saffman (1985) applied the finite difference method while Shen and Udell (1985) utilized a finite element routine to investigate the microscale flow-fields near the bubble tip region of interest. These studies laid the fundamental framework for investigations of surfactant dynamics during bubble migration including Ratulowski and Chang (1990), Stebe and Maldarelli (1994), Stebe and Barthes-Biesel (1995), Ghadiali et al (2001) and Ghadiali and Gaver (2003), demonstrating the importance of surface contaminants to the flow field. Simulations of pulsatile reopening in 2D (Zimmer et al 2005) and cylindrical geometries (Smith and Gaver 2008) demonstrated flow-field modifications that may influence surfactant delivery to the interface. These are important investigations that are motivated by pulmonary disease and the treatment methods necessary to reopen fluid-occluded pulmonary airways (Gaver et al 2006, Ghadiali and Gaver 2008). Due to the steadily escalating computational resources available, bubble propagation dynamics have been extensively modeled, far outpacing experimental investigations of the phenomenon. Our goal is to provide experimental results to augment the aforementioned computations, providing a detailed description of the velocity fields surrounding migrating bubbles to allow validation of theoretical concepts.
PIV is a well-established velocity measurement technique wherein velocity vector fields are obtained by statistically correlating the displacement, over a small time interval, of particles illuminated by a pulsed light sheet (Adrian 2005). Soares et al (2005) applied PIV to two-phase flows in large (2–3 mm) diameter capillary tubes. Nogueira et al (2003) extended this work by utilizing a simultaneous shadowgraphy and PIV system, yielding the interfacial geometry for each image pair.
Micro PIV (µ-PIV) employs a cone of light, emitted from the microscope objective lens, to illuminate the sample volume instead of the laser sheet employed in conventional PIV. The focal depth of the objective lens provides a quasi-2D plane of focused particles for correlation (Santiago et al 1998). Limitations on the laser sheet thickness prevent conventional PIV observations in sub-millimeter geometries. µ-PIV does not suffer this difficulty because the thickness of the focal plane is limited by the optical characteristics of the objective lens. However, the volumetric illumination results in an increase in the signal-to-noise (S/N) ratio compared to conventional PIV, necessitating the careful selection of seeding particle size and concentration. We have determined appropriate particle parameters in our previous investigations (Yamaguchi et al 2009), which described novel observations of steady bubble propagation in sub-micron capillary tubes. However, that study relied on a conventional fixed experimental stage; approximately 2% of the images recorded contained the bubble tip region of interest and were used to reconstruct the velocity field.
While a static stage is suitable (though inefficient) for the analysis of steady flow, it is inadequate for the evaluation of unsteady flows where the necessary ensemble averages would be nearly impossible to determine from data over many experiments. Because of the limitations of the fixed-stage experiments, we have developed the TSS to facilitate observation of steady bubble propagation and allow observation of pulsatile two-phase phenomenon.
3. Methods
Our interest lies in imaging transient microscale phenomenon, specifically the flows surrounding the tip of a migrating semi-infinite bubble. We experimentally investigate this phenomenon utilizing µ-PIV and a translating stage; in this section, we describe the configuration of our µ-PIV system, our flow-control system, the configuration of the TSS and the post-processing necessary to create accurate ensemble averages. Finally, we present a shadowgraphic technique to determine the shape of the air/liquid interface.
3.1. µ-PIV system
The µ-PIV system and parameters employed in this series of experiments have been described in detail in Yamaguchi et al (2009). Briefly, the system consists of a Nikon TE2000-U inverted microscope (Nikon Corporation, Japan) equipped with a 10× objective lenses (NA = 0.30 Plain Flour, Nikon Corp.) and a 1× projection lens (1× coupler, Nikon Corp.). Volumetric illumination is provided by a Nd:YAG laser (λ = 532 nm, power = 15 mJ/pulse, pulse duration = 4 ns, New Wave Laser Pulse Solo Mini, New Wave Research, CA), traveling through a fiber-optic cable to an optical port on the microscope. The laser light passes through an epi-fluorescent filter cube and then the objective lens to illuminate the sample volume. The liquid under observation is doped with a 0.02 vol% solution of dp = 1 µm fluorescent particles (Nile Red, Fluo Spheres, Invitrogen Corporation, CA), with 535/575 nm excitation/emission peaks. Light emitted from the particles travels back through the high-pass epi-fluorescent filter (λ > 550 nm) to a 2048 × 2048 pixel CCD camera (12 bit, 4 MP, TSI PowerView Plus, TSI Incorporated, MN). The laser and camera operations are synchronized by a laser pulse synchronizer (model 610035, TSI Inc.); two images are recorded over a short ΔT and subsequently filtered, processed and displayed using the Insight 3G software (TSI Inc.). Determination of the vector field is accomplished with a recursive Nyquist grid with a FFT correlation engine and Gaussian peak algorithm operating on 64 × 64 and 32 × 32 pixel windows (50% overlap) for the first and second interrogations. The velocity fields determined in the interrogation process are then refined with velocity range, standard deviation and local magnitude difference filters.
3.2. Flow actuation
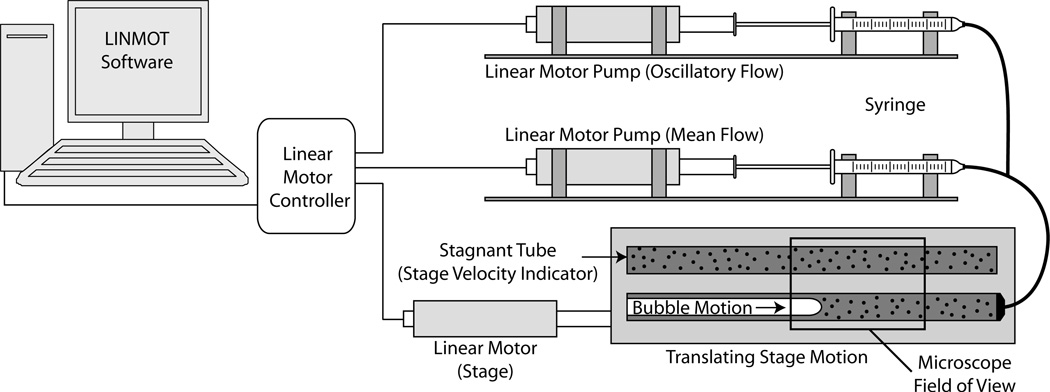
The flow is driven by a computer-controlled electromagnetic precision actuator system (electromagnetic direct linear motor P0123 × 80/30 × 90 and E400-AT, LinMot Incorporated, Switzerland), allowing precise and dynamic control of the bubble motion (figure 1). The electromagnetic motor utilizes a position sensor and programming and monitoring software (LinMot-Talk, LinMot Inc.) to provide precision closed-loop control of the actuator position and velocity. The system is capable of velocities from 1 to 200 mm s−1 over a 90 mm stroke with a position error less than 100 µm. We employ two actuators for flow control; utilizing syringe volumes ranging from 100 µl (Gastight Syringe 1710, Hamilton Company, NV) to 10 µl (Gastight Syringe 1701, Hamilton Company, NV) provides the constant flow rate while a 0.5 µl syringe (Microliter Syringe 7000.5, Hamilton Co) is used to drive the oscillatory flow component in pulsatile experiments.
Figure 1.
The experimental apparatus, wherein linear-motor-driven syringe pumps propel the bubble from the downstream end of the channel. The translating stage, driven by a computer-controlled linear motor, mechanically cancels the forward velocity of the migrating bubble. The stage velocity is determined via µ-PIV interrogation of the stagnant fluid in the stage velocity indicator.
3.3. Translating stage configuration
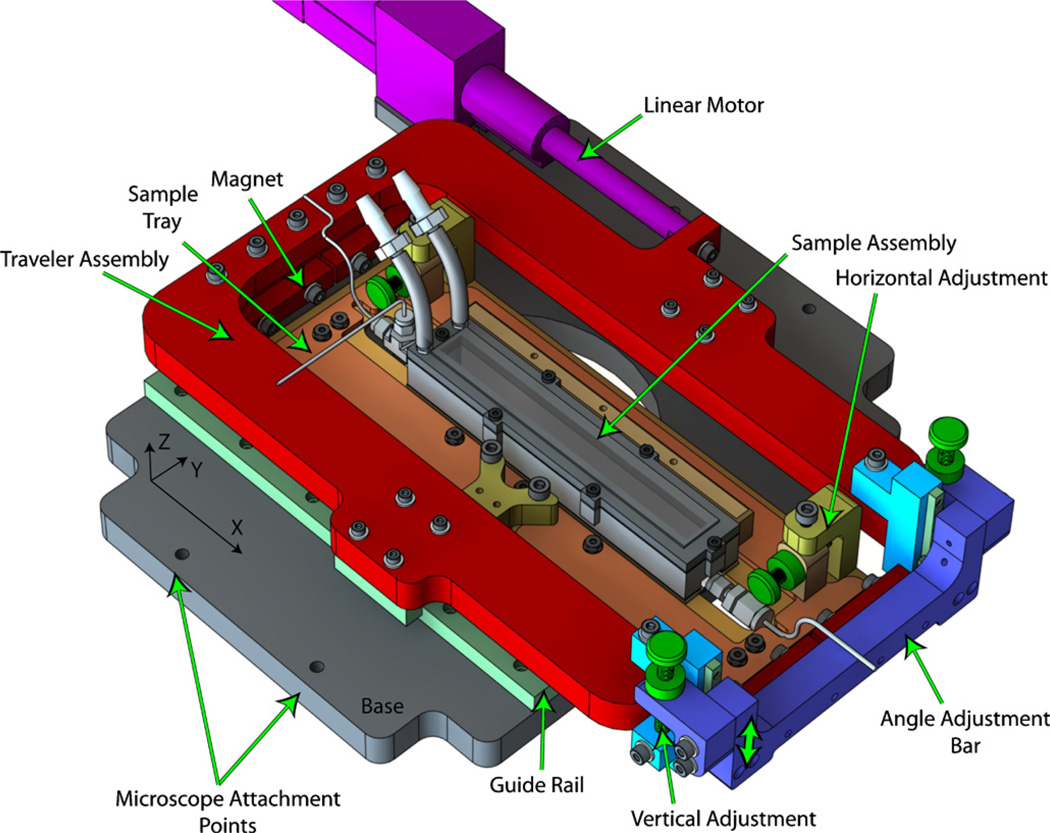
The TSS, shown in figure 2, was designed to provide smooth, controlled motion in the x-direction while providing the adjustments in both y and z necessary to position the sample for imaging. The system can be sub-divided into five component groups as shown in figure 2: (1) the base (gray), (2) linear motor (fuchsia), (3) traveler (red and blue), (4) sample tray (orange) and (5) sample assembly (gray). We will first describe the general configuration of the TSS followed by detailed descriptions of items 3–5.
Figure 2.
Translating stage system showing the base (gray), traveler (red and blue), sample tray (orange), sample assembly (gray) and linear motor (fuchsia). The stage translates in the x-direction, and adjustment screws (green) allow positioning in the y- and z-directions.
3.3.1. Overview
The TSS system is constructed around the base plate (figure 2, gray), to which the guide rails for x-translation (light green), the linear motor (fuchsia) and microscope (not shown) are attached. The traveler assembly rides upon recirculating ball linear guide rails (Miniature Slide Guide SEBS 15B, Nippon Bearing Co., Japan) and is driven in the x-direction by a long-stroke (210 mm) direct-drive linear motor (electromagnetic direct linear motor P01–23 × 80/150 – 210, LinMot Inc.). This configuration allows observation over a 125 mm length of glass capillary tube. The traveler allows vertical sample adjustment (z-direction) via the angle adjustment bar and is connected to the sample tray assembly by four neodymium-iron-boron magnets striking against 1/2 round bars on the sample tray. The sample tray assembly allows both coarse and fine adjustment in the y-direction and provides a clamping mechanism to securely fix the sample assembly to the TSS.
The aluminum base of the TSS is machined to couple with the factory-supplied stage mounting points on a Nikon TE-2000U inverted microscope (‘Microscope Attachment Points’, figure 2). The base and all other aluminum components were CNC milled in-house from 5/8″ precision ground ALCOA MIC-6 cast aluminum plate. The inverted microscope configuration is critical to the function of the TSS; the additional space available above the focal plane allows room for the translating components to clear the microscope objectives.
3.3.2. Traveler
The traveler assembly (figure 2, red and blue) is attached to the guide rails and linear motor, rigidly connecting the functional components of the TSS. The sample is adjusted parallel to the microscope focal plane using the vertical adjustment sub-assembly shown in blue and light blue (figure 2). Small linear guide rails (SEBS 5B, Nippon Bearing Co., shown in light green) are oriented in the z-direction to control the position of the angle adjustment bar (blue) while 250 µm thread pitch adjustment screws (Ultra-Fine Adjustment Screw 9S127–25, Standa, Lithuania), shown in green, allow positioning within 10 µm (0.0025° of sample angle). Bonded neodymium–iron–boron magnets mounted on the angle adjustment bar and the frame of the traveler (figure 2, red) bind to 1/2 round steel bars mounted on the sample tray assembly as shown in figure 2. Because of the magnetic mounting system, this attachment method ensures smooth angular adjustment and allows freedom in positioning the sample in the y-direction.
3.3.3. Sample tray
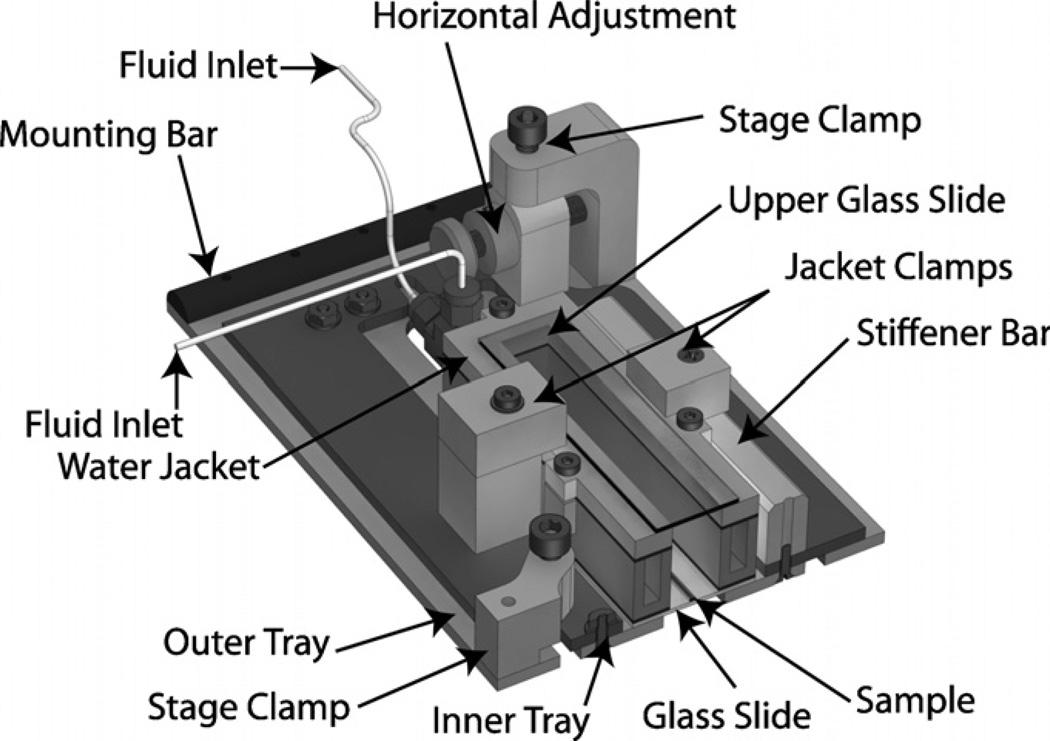
The sample tray assembly has three primary functions: (a) firmly secure the sample assembly, (b) allow fine horizontal adjustment and (c) provide a method for connecting to the traveler assembly. The main structure of the tray assembly consists of three CNC laser cut, precision ground 1/8″ 4142 chrome-moly steel sheets. These are labeled the outer, inner and lower trays in figure 3. The inner and lower trays are securely fastened together and further strengthened by the aluminum stiffener bar, also shown in figure 3. The stiffener bar serves to straighten the chrome-moly plates which were slightly deformed by thermal stresses during the laser cutting. Aluminum clamps secure the water jacket (part of the sample assembly), which contains the capillary tube under observation, to the lower and inner trays. The outer and inner trays slide freely over one another, allowing fine horizontal adjustment via the ‘horizontal adjustment’ system shown in figure 3.
Figure 3.
Sample and sample tray section view. The sample assembly consists of a glass capillary tube resting on a glass slide within a temperature-controlled water jacket. The sample assembly is mounted to the inner and lower trays which are fastened together and travel freely over the outer tray. When the position has been set with the horizontal adjustment screws, the stage clamps are used to fix the location. The entire assembly is mounted to magnets on the traveler by the 1/2 round mounting bar.
Sample alignment with the translation (x) direction (adjustments in the y-position) is performed in two stages. Gross alignment, typically ≈500 µm in accuracy, is achieved by sliding the entire sample tray assembly along the mounting magnets. The fine alignment is controlled with 250 µm thread pitch adjustment screws (Ultra-Fine Adjustment Screw 9S127-10, Standa), labeled ‘Horizontal Adjustment’ in figure 3, providing positional accuracy on the order of 10 µm. When the y-position has been set at both ends of the stage travel, such that the tube is both centered in the microscope field of view and parallel to the direction of translation, the stage clamps are used to secure the inner tray at the desired position. The tray interfaces with the traveler through 10 mm half-round bars (‘mounting bar’ in figure 3), and the round profile of the bar allows smooth vertical adjustment via the traveler mechanisms described above and shown in figure 2. The magnetic attachment system has proven to be robust; this design requires significant force to move the mounting bars across or off the magnets, preventing accidental movement.
3.3.4. Sample
The base of the sample assembly is a 30 × 161.5 × 1.1 mm soda lime glass slide (Specialty Glass Products, PA). Two 535 µm ID fused silica glass capillary tubes (TSP530660, Polymicro Technologies, AZ) are adhered to the slide with a two-part quick setting epoxy. One capillary tube is used for the experimental fluid flow; the other contains a quiescent fluorescent particle/fluid mixture which we term the ‘stage velocity indicator’ (SVI). The SVI is used in the µ-PIV interrogation process to determine the stage velocity for each frame. By subtracting the measured stage velocity from the µ-PIV flow field, we revert back to the laboratory frame of reference. The SVI is filled with a 30% glycerol/water mixture to reduce the effects of particle sedimentation. Because the densities of the fluid and suspended particles are more closely matched, the particles rise upward at 0.005 µm s−1, in comparison to a downward velocity of 0.028 µm s−1 in the particle/water mixture. As such, the particles travel a distance of one tube radius (267.5µm) over 12.5 h in the glycerol/water system and 2.5 h in pure water. Our experimental durations are less than 3 h; particle sedimentation in the SVI is not significant over this duration.
The second capillary tube, where the bubble is propagated, is attached via zero dead volume PEEK fittings (Upchurch Scientific P760 and P728, WA) and PEEK tubing (Upchurch, ID = 1 mm, OD = 1.6 mm) to the linear motor-driven syringe pumps. An aluminum water bath is attached atop the slide using adhesive gasket material and silicone caulk, providing temperature control within 0.1 °C over the area of the glass slide (at 37 °C in a 23 °C room). The jacket volume (adjacent to the sample tube) is filled with either water or glycerol, depending on the fluid used in the experiments, to reduce optical distortion due to mismatched indices of refraction.
3.4. µ-PIV post-processing
Following vector interrogation, described above, additional processing steps are necessary to align the vector fields and remove the stage velocity prior to computing the ensemble average. Regardless of the type of experiment, the vector fields are loaded into MATLAB (Mathworks Inc., MA) where the stage velocity (obtained from the stage velocity indicator) is subtracted from the flow field of interest if the TSS was used. The relevant cross-sectional velocity profile in the fluid phase is then determined. For two-phase (air/liquid) trials, we consider the fluid velocity sufficiently downstream from the bubble tip to reasonably describe the far field. In single-phase trials, the entire domain is averaged in the axial direction to provide the cross-sectional velocity profile. The location of the maximum velocity, computed using the derivative of a cubic spline, is used to determine the location of the tube centerline.
Because of mechanical noise owing to the recirculating ball linear guide rails, we found it necessary to eliminate frames of data where the stage velocity violates specific metrics. As such, we eliminate data where the measured stage velocity in the direction of translation differs from the average stage velocity by 25% or more. Furthermore, we discarded frames where the stage velocity normal to the translation direction exceeded 1% of the average stage velocity. In steady propagation air/glycerol trials, this accounted for approximately 50% of the successfully interrogated images. Methods for reducing the incidence of outlier data are discussed in section 4.5.
In the pulsatile two-phase flow trials, we align the phase of the experimental runs using the mean downstream velocity. The runs are then divided into single oscillatory cycles which are overlaid to create an ensemble oscillation. The ensemble oscillation, containing several hundred observations, is then sub-divided into 16 ‘bins’ within which a time-averaged ensemble is calculated. For steady propagation, it is unnecessary to sub-divide the flow; all frames are placed into a single bin.
In order to compute an accurate ensemble average in the two-phase trials, it is essential to align the axial position of the images at a common reference point in proximity to the bubble tip. To identify the location of this reference point, we compute the location along the tube centerline where the velocity is equal to 1.2Umean, where Umean is the average far-field velocity (for steady flow, 1.3Umean is used). We employ this reference point because optical distortion near the bubble cap introduces noise in the vector field immediately adjacent to the tip. In the steady propagation trial presented in section 4.4.1, 80% of the computed tip positions fell within 12.5 µm of the location visually determined from particle images and 97.5% of the predicted positions were within 25 µm of the visual estimate. This velocity-based estimate of the tip position is superior to a visual determination because of its algorithmic simplicity and consistency. The reference point location is then aligned for all frames so that the approximate bubble tip positions are coincident. This process allows for the necessary ensemble averaging of the velocity fields for each of the 16 segments of the oscillatory cycle.
3.5. Stroboscopic imaging
µ-PIV has been shown to be effective at resolving the flow field near the tip of a migrating semi-infinite bubble (Yamaguchi et al 2009). However, the instantaneous fluorescent particle images do not provide a clear description of the interfacial shape. Because the interrogation process yields vectors over the entire observation area, we must determine the shape of the interface to eliminate vectors in the air phase. We record shadowgraphic images in a separate experimental run from the PIV using a Direct Illumination Strobe (MVS-4100, PerkinElmer Optoelectronics, CA), triggered coincidentally with the camera by a signal generator. Because the strobe records only one image per frame (compared with two images per frame for the µ-PIV images), the effective frame rate of the system increases to 14.5 fps for 120 frames. In addition to the interfacial shape, we utilize flash illumination to determine the position of the bubble tip in the microscope field of view when assessing the performance of the stage.
The stroboscopic images are imported into MATLAB where a graphical user interface (GUI) is used to determine the edge of the air/liquid interface. First, the image is cropped to reduce the computational cost of filtering. A global threshold value is then computed with Otsu’s method (Otsu 1979) and applied to the cropped image. Isolated pixels in the resulting black and white image are removed, and the bubble edge is located by finding the maximum of the Sobel approximation of the derivative of the image. Finally, the computed boundary is overlaid on the grayscale image for visual confirmation.
The interfacial shape, shown in figure 7, is determined from the average of a large number (>20) of instantaneous images. To compute the average, the profiles are first coarsely aligned by setting the maximum axial (x) position to 0 and the mean radial (y) value to 0. The average of the set is then computed by dividing the domain into 40–50 radial divisions and computing the mean of all points falling within each region. After computing the average, the position of each curve is adjusted to minimize the error w.r.t. the average line. The resulting shape is used to eliminate erroneous vectors from the air phase.
Figure 7.
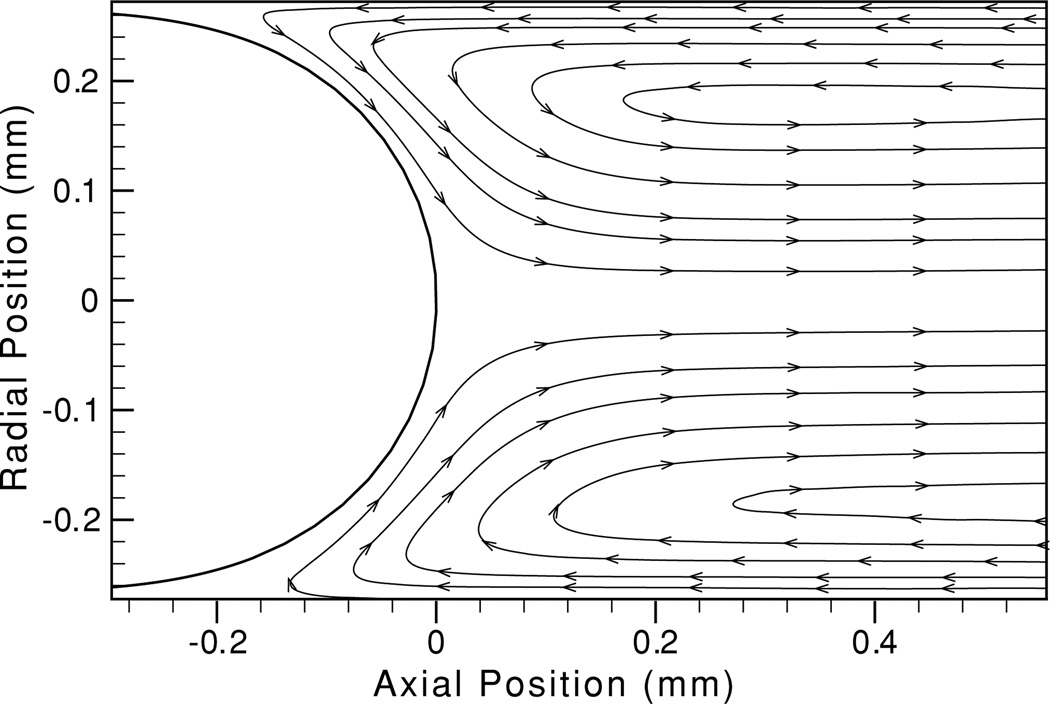
Ensemble-averaged streamlines and interfacial geometry in the air/glycerol system for Ca = 0.02 at a translating stage velocity Us = 3 mm s−1. 136 frames are included in the ensemble out of 300 collected.
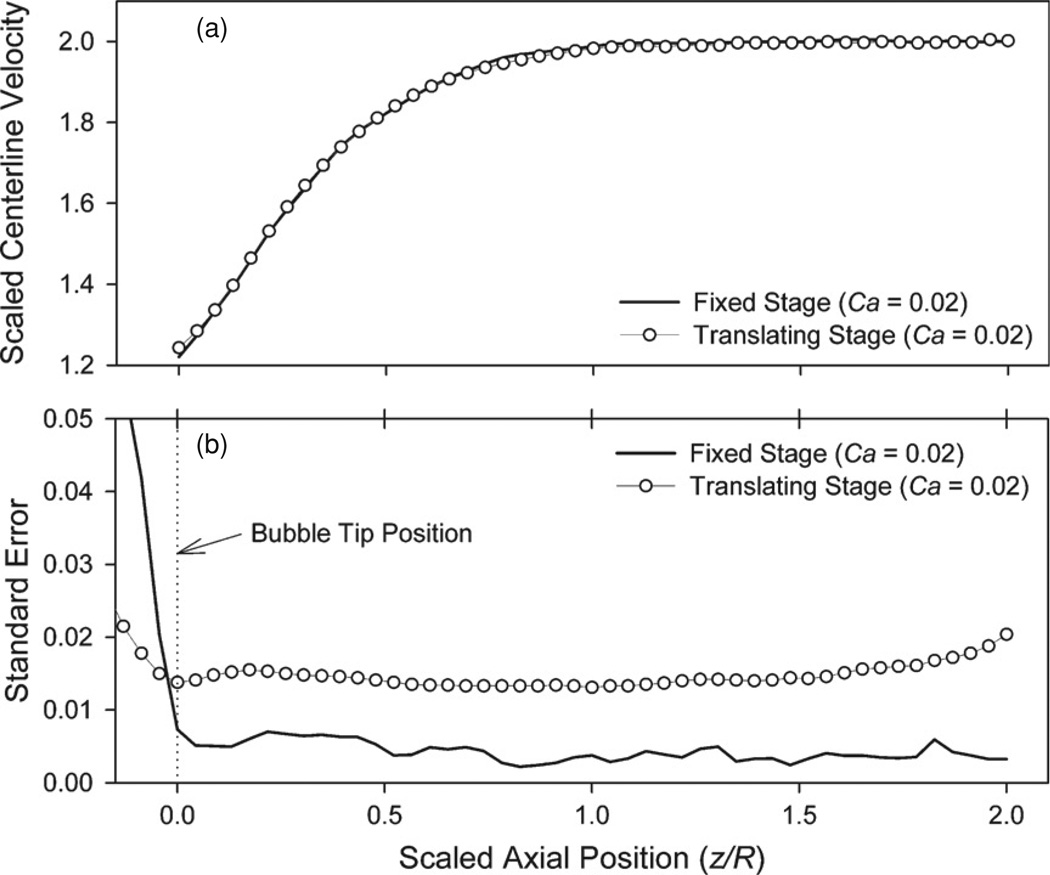
Determination of the bubble tip position in the ensemble average is required to identify the location of the interface and to ascertain the bubble tip velocity. As discussed in Yamaguchi et al (2009), the bubble tip is located at the centerline position demarcated by a distinct increase in the standard deviation of the velocity, as shown in figure 6(b). This increase occurs because the velocity field within the fluid phase is consistent between frames while the gas phase is dominated by random noise, as demonstrated in figure 5 of Yamaguchi et al (2009).
Figure 6.
Centerline velocity profile (a) and standard error (b) for steady bubble propagation at Ca = 0.02 in the air/glycerol system on both fixed and translating stages. To facilitate comparison, velocities are scaled so that the mean downstream velocity has a magnitude of 1 and lengths are scaled by the tube radius R.
Figure 5.
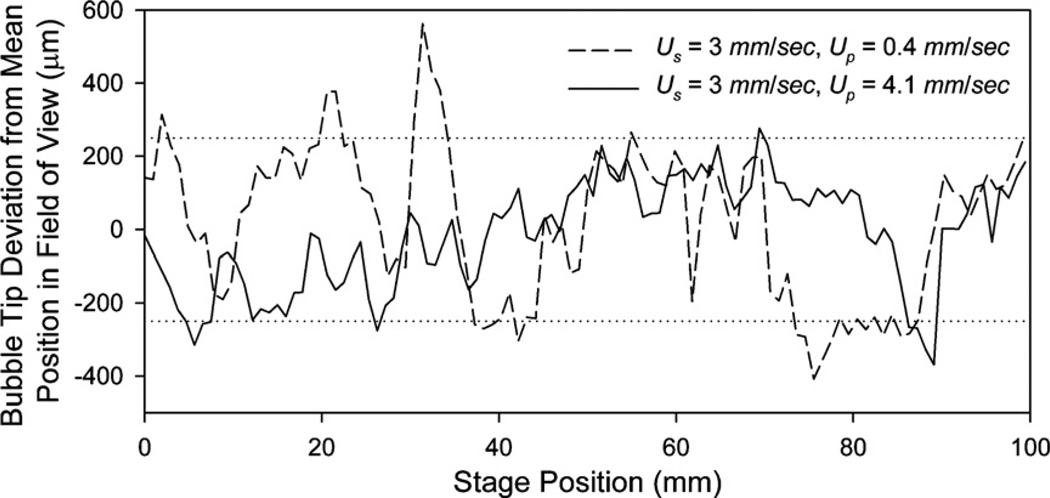
Bubble tip deviation from the mean position in the microscope field of view for the air/water system. Dotted line represents 500 µm positioning window necessary for µ-PIV measurement.
4. Results
In this section, we will first explore the positional accuracy of the TSS and then discuss variation in measurements of Poiseuille flow (no bubble) with a fixed and translating stage, which demonstrates the general accuracy of the method. Next, we present results describing the positional accuracy of the stage (the bubble tip position in the field of view) when following a steadily migrating bubble. The system is then employed to measure the flow field surrounding the tip of a bubble migrating with steady and pulsatile forcing flows.
4.1. Linear motor
This section describes the linear motor parameters defined in the LinMot-Talk software. The linear motor contains a Hall sensor which reports the achieved position and velocity; we use this information to define the low-speed limit of operation for both the linear motors driving the syringe pumps and TSS. LinMot-Talk allows the user to program curves defining the time-dependent positions of the linear motors. The external controller then uses this information, and information reported back from the linear motor, to control the position of the TSS and syringe plungers. For stage motion, we chose a 64-segment ‘Limited Jerk’ profile as defined by the Linmot software while the syringe is driven at a constant velocity for the mean flow or a sine curve for the oscillatory component of pulsatile trials. The Limited Jerk profile provided the lowest sum-squared error over the range of travel and followed the motion of an initially stagnant bubble with the greatest accuracy.
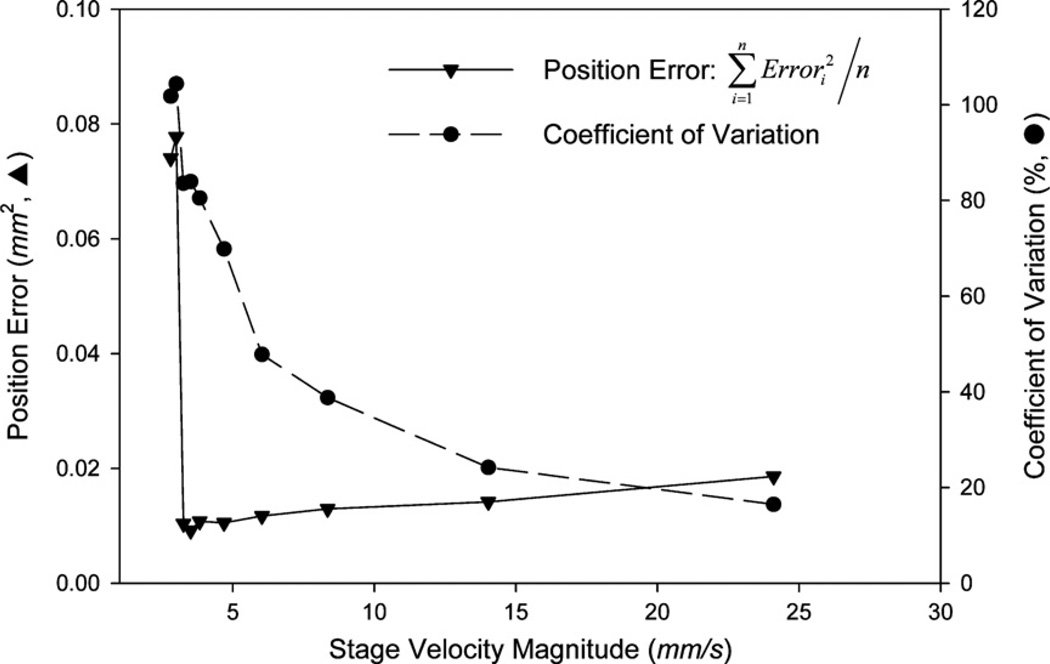
Figure 4 shows the position error and the coefficient of variation of the velocity of the TSS, as reported by the Hall sensor in the linear motor, over a range of translation velocities. Velocity deviations are approximately equal in magnitude for different stage velocities; however at lower speeds, these variations make up a larger percentage of the mean velocity (as described by the coefficient of variation in figure 4). The position error decreases slightly as the stage velocity (Us) is reduced. However, these data demonstrate that there is a dramatic increase in the position error for Us < 3 mm s−1; at this velocity, the time-dependent velocity profile obtained from the linear motor is equal to zero for a substantial portion of the stroke. For this reason, we limit our investigations to parameter combinations where Us > 3 mm s−1.
Figure 4.
The effect of stage velocity on the stage position error (triangles) and the coefficient of variation of the stage velocity (circles). Below a stage velocity of 3 mm s−1, the position error dramatically increases as the linear motor goes into a stepwise mode of operation.
4.2. Test study—evaluation of Poiseuille flow
To initially assess the efficacy of the stage system, we consider Poiseuille flow with both fixed and translating stages. In these experiments, we consider two sources of error: the TSS and the µ-PIV measurements. We have previously demonstrated the accuracy of our µ-PIV measurements (Yamaguchi et al 2009); in this section, we will focus on the errors resulting from the TSS. Table 1 describes the results of the Poiseuille flow experiments where each trial is subdivided into the forward (F) and reverse (R) strokes. In trial 1, the stage is fixed and the fluid pushed through at a constant flow rate. In trials 2 and 3, the fluid flow rate remains constant and the stage is driven at approximately 6 mm s−1. Trial 4 maintains the same fluid flow conditions but translates the stage at ~12 mm s−1.
Table 1.
Means and standard deviations of the fluid centerline axial (Uf) and radial (Vf) velocities for the forward (F) and reverse (R) strokes in the Poiseuille flow experiments. Trial 1 is for a fixed stage, trials 2 and 3 are for an intermediate translating stage velocity (~6 mm s−1) and trial 4 is for a faster (~12 mm s−1) stage velocity.
| Mean axial centerline velocityUf (mm s−1) |
Standard deviation |
Mean radial centerline velocity Vf (mm s−1) |
Standard deviation |
Number of frames in ensemble |
|
|---|---|---|---|---|---|
| Trial 1 F | 11.467 | 0.725 | 0.003 | 0.005 | 352 |
| Trial 1 R | −11.459 | 0.670 | −0.005 | 0.005 | 234 |
| Trial 2 F | 11.342 | 1.954 | −0.008 | 0.042 | 384 |
| Trial 2 R | −11.527 | 1.382 | 0.018 | 0.044 | 316 |
| Trial 3 F | 11.520 | 1.623 | −0.018 | 0.046 | 294 |
| Trial 3 R | −11.434 | 1.521 | 0.028 | 0.046 | 316 |
| Trial 4 F | 11.685 | 2.144 | −0.061 | 0.049 | 288 |
| Trial 4 R | −11.280 | 2.018 | 0.062 | 0.041 | 218 |
In translating stage trials, the ensemble-averaged centerline velocity was found to vary from the fixed-stage trials by <1% and <2% for stage velocities of 6 and 12 mm s−1, respectively. When compared to fixed stage experiments, the standard deviation is approximately 2× larger for the 6 mm s−1 case and 3× greater for the 12 mm s−1 case. However, despite the increased deviation, the ensemble average continues to provide a very accurate description of the flow field. Likewise, the mean radial fluid velocity, after removing the stage velocity, is an order of magnitude larger (10−2 versus 10−3 mm s−1) for the moving stage cases (as shown in table 1). However, the maximum radial velocity, occurring in the high-Us case, is less than 0.6% of the centerline axial velocity.−1
Table 2 demonstrates the stage velocities and standard deviations obtained from the stage velocity indicator tube. For the high-speed stage trials (Us ≈ 12 mm s−1), there is significantly greater variation in the translation velocity of the stage. Furthermore, there is an increase in the stage velocity normal to the translation direction. This may account for the corresponding increases in the radial fluid velocity discussed above.
Table 2.
Means and standard deviations of the field-averaged stage axial (Us) and radial (Vs) velocities for the forward (F) and reverse (R) strokes during Poiseuille flow. Trial 1 is conducted on a fixed stage, trials 2 and 3 are for an intermediate translating stage velocity (~6 mm s−1) and trial 4 is for a faster (~12 mm s−1) stage velocity. The correlation coefficient indicates the dependence of Vs on Us and Vf on Vs.
| Mean Us (mm s−1) |
Standard deviation |
Mean Vs (mm s−1) |
Standard deviation |
Us, Vs correlation |
Vs, Vf correlation |
|
|---|---|---|---|---|---|---|
| Trial 1 F | 0 | 0 | 0 | 0 | 0 | 0 |
| Trial 1 R | 0 | 0 | 0 | 0 | 0 | 0 |
| Trial 2 F | −5.809 | 1.204 | 0.011 | 0.068 | 0.067 | 0.099 |
| Trial 2 R | 5.944 | 1.189 | −0.012 | 0.063 | −0.103 | 0.428 |
| Trial 3 F | −5.969 | 1.131 | 0.017 | 0.066 | −0.051 | 0.216 |
| Trial 3 R | 5.892 | 1.299 | −0.007 | 0.067 | −0.103 | 0.428 |
| Trial 4 F | −12.061 | 1.599 | 0.072 | 0.081 | −0.178 | −0.118 |
| Trial 4 R | 11.777 | 2.423 | −0.072 | 0.071 | −0.278 | −0.039 |
We next consider the correlation between the instantaneous stage and fluid velocities, shown in table 2. We find that the axial fluid velocity (Uf ) is not strongly influenced by the instantaneous stage velocity in the direction of translation (Us). However, a slight correlation between the radial stage (Vs) and mean radial fluid (Vf) velocities was noted in several trials, indicating that large instantaneous Vs has an influence on the fluid flow within the capillary tube.
In summary, this series of validation experiments has demonstrated that the TSS introduces a small (1–2%) error in the ensemble average and that higher stage velocities lead to increased variation in the instantaneous velocity field. Below, we show that this increase in deviation is acceptable as the TSS allows observation of phenomenon inaccessible to fixed-stage measurements. Furthermore, techniques for reducing the error magnitude are discussed in section 4.5.
4.3. Bubble tip position—steady propagation
A critical measure of the TSS is the accuracy with which the tip of a migrating bubble is followed. Positioning the bubble tip within a 500 µm window provides a sufficient length downstream of the bubble tip for µ-PIV measurements of the flow field of interest. In this section, we consider the effect of the syringe pump on the positional accuracy of the experimental system.
To determine the positional accuracy, we employ the stroboscopic illumination system described in section 3 to measure the location of the bubble tip for a range of syringe pump (Up) and stage (Us ) velocities. The impact of position errors in the linear motor driving the stage is clear. However, the accuracy of the syringe pump plays an equally important role because instantaneous velocities of the bubble tip range from one-half to five times the velocity of the linear motor pushing the syringe plunger, potentially magnifying positioning errors. We have found, in agreement with section 4.1, that the bubble motion is smoothest when Up > 3 mm s−1.
Figure 5 shows the deviation from the mean position (in the field of view) of the tip of a migrating bubble for Us ≈ 3 mm s−1 with a 100 µl syringe (Up = 0.4 mm s−1, dashed line) and two 10 µl syringes (Up = 4.1 mm s−1, solid line). At the higher syringe pump velocity (Up = 4.1 mm s−1), 93% of the captured images show the bubble tip in the allowed 500 µm window. When the syringe pump velocity is reduced to Up = 0.4 mm s−1, while holding the stage velocity fixed, the success rate is reduced to 75%. This is a consequence of the stepwise behavior found below the 3 mm s−1 threshold described above.
4.4. Velocity field measurements
4.4.1. Steady propagation
The goal of our research is to measure the flow field surrounding the tips of migrating, semi-infinite bubbles under a variety of conditions because of the importance to pulmonary research. The first case that we investigate is a semi-infinite bubble propagating with a constant velocity, defined by the Capillary number Ca = µUAVG/γ where UAVG is the mean downstream velocity. Figure 6(a) compares the ensemble-averaged centerline velocity profile in an air/glycerol system recorded with fixed stage (Ca=0.02) and translating stage (Ca=0.02). We consider the centerline because it represents nearly the full range of velocities in the observed domain. The translating stage reduces the velocity to zero at the bubble tip, and the downstream velocity is nearly as large as velocities at the translating tube wall. Furthermore, the signal-to-noise ratio at the centerline is low because of the thickness of the fluid-particle layer. This provides an excellent demonstration of our measurement strategies in a challenging region of the observed area.
In the translating stage case, 270 of 300 frames of data (90%) contained usable images of the bubble tip. Stage velocity range filters reduced the number of images in the ensemble to 136, or 45% of the images initially recorded, a significantly greater success rate than the fixed-stage experiments where 25/600 frames (4.2%) of data were useable. Therefore, the data collection efficiency increased more than tenfold through the use of the TSS. Figure 6(b) shows the standard error for the fixed and translating stage trials. We note that the standard error increases in the far downstream region (z/R > 1.75) because some frames of data contain only 1R of vector data downstream of the bubble tip. Because of the dissimilar domain lengths, the number of data points in the far-downstream region is reduced in comparison to the fluid region in direct proximity to the bubble tip.
The excellent agreement between fixed and translating stage trials demonstrates the viability of the TSS in analyzing multiphase flows. These observations compare well with the experimental observations of Yamaguchi et al (2009) which, in turn, were shown to be in good agreement with the boundary element method computations of Smith and Gaver (2008). Ensemble-averaged streamlines for steady bubble propagation at Ca = 0.02, shown in figure 7, further demonstrate the high quality of the vector fields obtained with the TSS. Furthermore, figure 7 demonstrates the interfacial geometry determined from the analysis of 22 stroboscopic images (in a separate experimental run) of the bubble cap during steady propagation.
4.4.2. Pulsatile propagation
Measurements of steady (constant velocity) bubble propagation, although experimentally challenging, may be performed utilizing a fixed-stage configuration. However, when observing pulsatile flow with an air–liquid interface, the low data collection efficiency in fixed stage trials makes ensemble averaging difficult if not impossible.
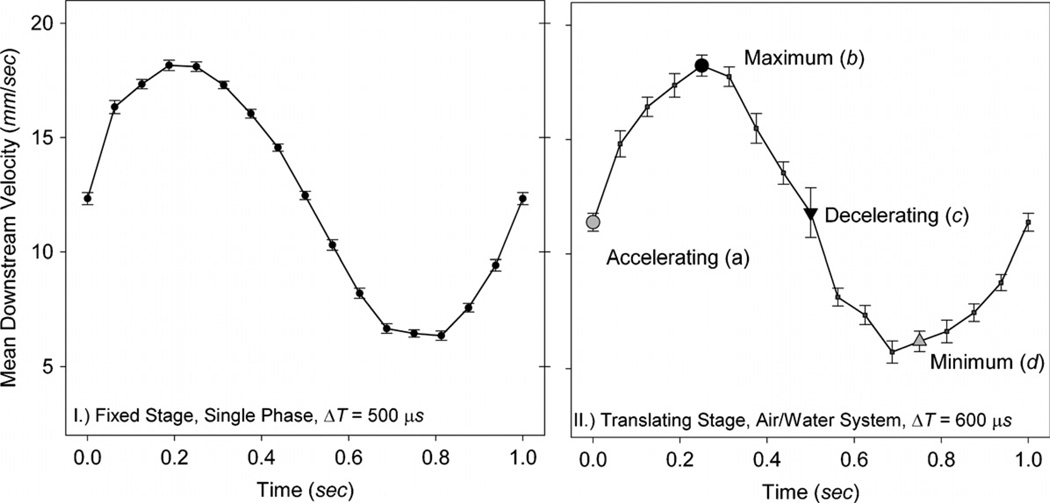
To assess the error contributed by the TSS, we first consider single phase (water) pulsatile flow on a fixed stage (as shown in figure 8(I)) where the centerline axial velocity is described as U(t) = UM + UΩ sin(ωt). Here, the time-averaged downstream centerline velocity UM = 12 mm s−1, the frequency ω = 1 Hz and the oscillatory velocity component UΩ = 6 mm s−1. Because the translating stage affects the magnitude of the observed velocities, the time interval (ΔT) between the two successive particle images used to interrogate a single vector field is adjusted to achieve a maximum particle displacement of 12 pixels. In this case, ΔT = 500 µs for the fixed stage (figure 8(I)) and ΔT = 600 µs when employing the TSS (figure 8(II)).
Figure 8.
Downstream centerline velocity and standard error for single-phase flow on a fixed stage (I) and the air/water system on a translating stage (II). The centerline velocity of the flow is described as U(t) = UM + UΩ sin(ωt) where the time-averaged downstream centerline velocity UM = 12 mm s−1, the frequency ω = 1 Hz and the oscillatory velocity component UΩ = 6 mm s−1. In the two-phase trials, this corresponds to a mean capillary number CaM = 8.1 × 10⁻⁵. For the translating stage trial (II), large symbols demarcate points a–d in the cycle further explored in figures 9 and 10.
We observed this simple time-dependent flow to establish the validity of our bin-averaging method (as described in section 3) and we have demonstrated our ability to reconstruct ensemble-averaged time-dependent cyclic flow fields. Furthermore, it is clear that the ensemble-averaged downstream centerline velocity more closely resembles the prescribed pulsatile flow in the single-phase experiments than in the translating stage two-phase trials shown in figure 8(II). As in the steady propagation trials, the standard errors in the translating stage case are larger than those in the fixed-stage single-phase trials. The difference in the error between fixed and translating stage experiments is primarily a result of mechanical imperfections in the TSS. Techniques to reduce the mechanical noise contributed to the measurements by the translating stage are discussed in section 4.5. Additional variations in the driving flow arise from the motion of the inlet tubes due to the TSS. Furthermore, observations of steady bubble propagation in our configuration indicate that a stick-slip behavior may exist wherein inconsistent wetting of the tube wall affects the bubble tip velocity. However, the two-phase translating stage results provide a satisfactory description of a flow field that is intractable on a fixed stage.
The air/water flow field is described non-dimensionally, as in Smith and Gaver (2008), by the unsteady capillary number Ca(t*) = µQ(t)/πR2γ, where the tube radius R = 268 µm, the viscosity µ = 1 cP, the surface tension γ = 72 dyn cm−1, Q is the dimensional flow rate, t is the dimensional time and t* is the dimensionless time. The flow is composed of both mean (CaM = 8.1 × 10⁻⁵) and oscillatory (CaΩ =4.3×10⁻⁵) components such that Ca(t*)= CaM + CaΩsin(Ωt*). Dimensionless frequency and amplitude parameters are defined respectively as Ω = µωR/γ = 2.3 × 10⁻⁵ and A = 2CaΩ/Ω = 3.7. To allow comparison to the single-phase oscillatory experiments, which are not correctly described by the capillary number, figures 8–10 are presented in the dimensional form.
Figure 10.
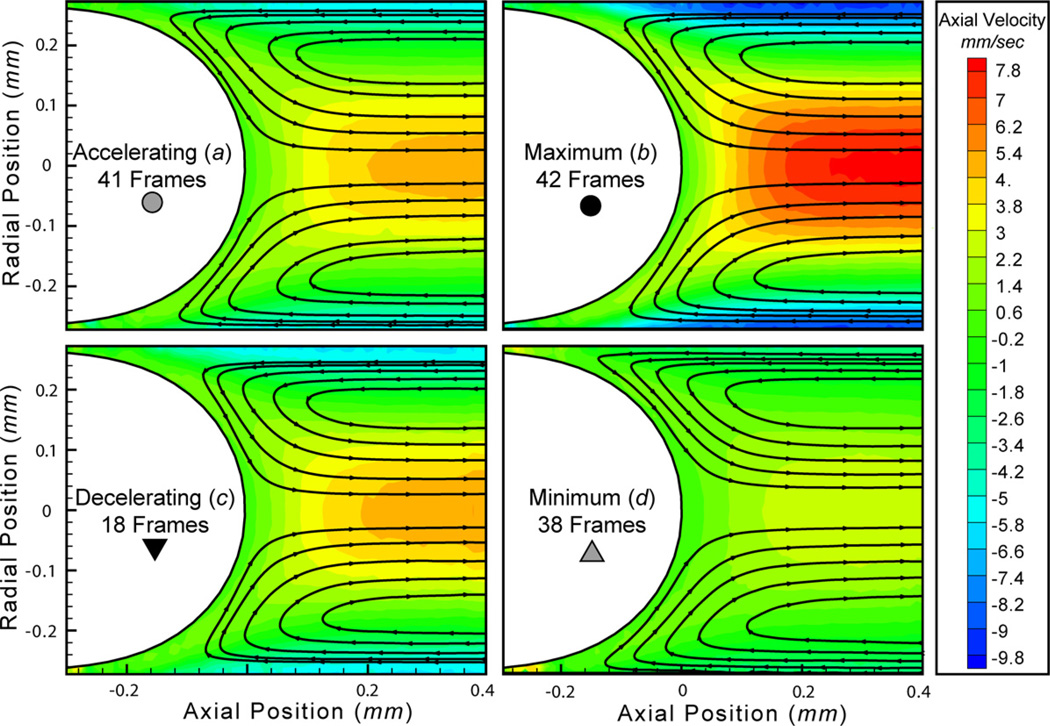
Ensemble-averaged pulsatile bubble propagation streamlines in the bubble tip frame of reference at the points in the oscillatory cycle (a–d) depicted in figures 8 and 9. The time-dependent downstream centerline velocity U(t) = UM + UΩ sin(ωt) where the time-averaged downstream centerline velocity UM = 12 mm s−1, the frequency ω = 1 Hz and the oscillatory velocity component UΩ = 6 mm s−1 (CaM = 8.1 × 10⁻⁵).
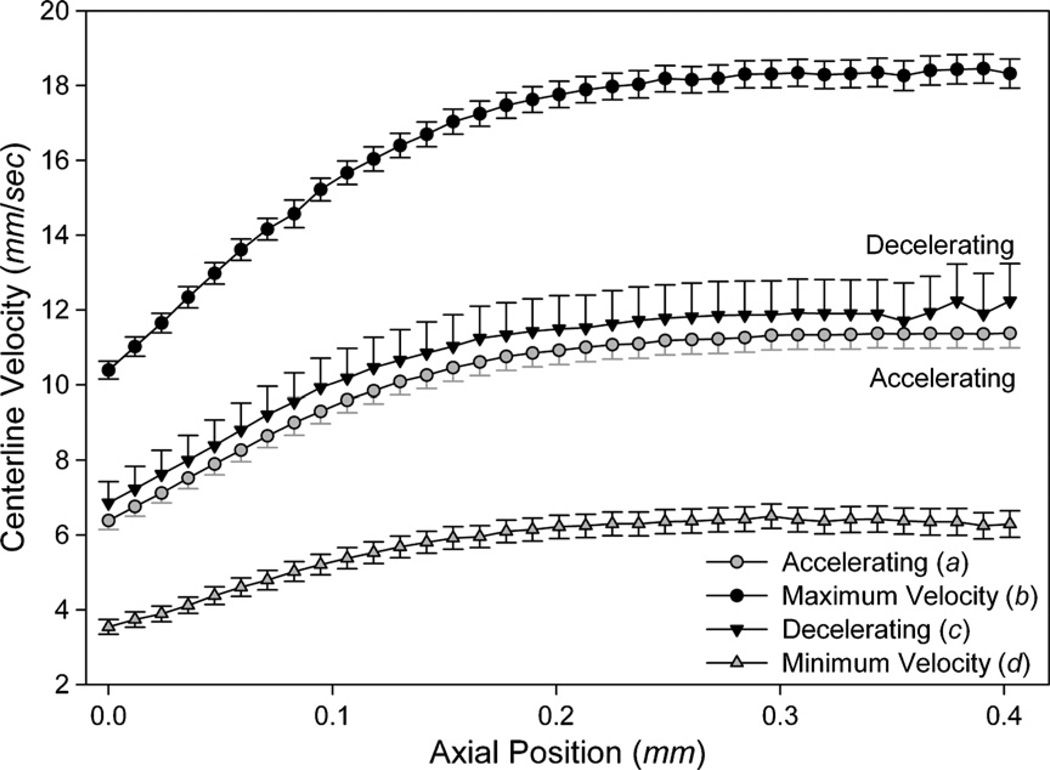
Four points of interest in the oscillatory cycle are highlighted in figure 8(II): the accelerating phase (a), maximum velocity (b), decelerating phase (c) and minimum velocity (d). These temporal points are further explored in figure 9, showing the centerline axial velocity profile, and in figure 10, showing streamlines and contour plots of the axial velocity.
Figure 9.
Centerline velocity profile and standard error for the air/glycerol system on a translating stage at the points in the cycle indicated in figure 8. The time-dependent downstream centerline velocity U(t) = UM + UΩ sin(ωt) where the time-averaged downstream centerline velocity UM = 12 mm s−1, the frequency ω = 1 Hz and the oscillatory velocity component UΩ = 6 mm s−1 (CaM = 8.1 × 10⁻⁵).
The centerline velocity profiles for the decelerating phase (figure 9(c)) show a larger standard error than other points in the oscillatory cycle; this occurs because there are approximately one-half as many frames in this bin (18 frames) as in other points in the cycle. The reduced number of frames is due to the position of the bubble; the decelerating phase finds the bubble tip at the far downstream edge of the field of view. Likewise, the position of the bubble tip in the field of view during the decelerating phase results in deviations in the far downstream centerline velocity (far right of figure 9(c)). Each frame has a different length downstream of the interface visible for vector interrogation; therefore, there are fewer points in the ensemble-averaged centerline velocity further downstream from the bubble tip, resulting in an increase in the standard error.
Streamlines and contour plots, shown in figure 10, further demonstrate the high quality of the pulsatile flow ensemble averages and provide a striking demonstration of the efficacy of the TSS for pulsatile flow velocity measurement in a two-phase system. These data would not be achievable without the advent of the translating stage and development of improved data analysis techniques. While streamlines appear geometrically similar in each frame, the velocity magnitudes represented in the contour plots show very large variation. These contour plots highlight velocity field differences that occur throughout the pulsatile flow cycle.
It should be noted that the experimental parameters in the two cases described above (pulsatile flow on a fixed and translating stage) were identical with the exception of the interval between the two raw images used to interrogate the vector field (ΔT). In the fixed-stage trial ΔT = 500 µs compared to ΔT = 600 µs in the translating stage case. The increase in ΔT is due to the mechanical subtraction of the bubble tip velocity from the flow field by the TSS. Because the velocities are reduced in magnitude, the increased ΔT yields a similar displacement, in the translating frame of reference, after the interrogation procedure.
4.5. Limitations
The TSS operates most effectively within a defined range of velocities. The linear motor driving the device provides the greatest accuracy for velocities greater than 3 mm s−1. Below this threshold, the linear motor operates in a stepwise fashion, greatly increasing the positional error. At significantly higher velocities, the quality of stage motion is adversely affected and positional accuracy is reduced (data not shown). Additionally, the observable range of the device is 125 mm. Our µ-PIV system is capable of recording at 7.5 fps for 60 frames, yielding a maximum stage velocity of 15 mms−1 if the entire 60 frames are to be used. The range of useable velocities is therefore 3–15 mm s−1, with the greatest positional accuracy and smoothest motion achieved in the middle of the range.
The quality of stage motion is a direct consequence of the quality of the linear guide rails. Our prototype TSS utilizes cost-effective and easily installed recirculating ball linear guide rails. In future experiments, we intend to replace this component with crossed-roller rails which provide significantly smoother stage motion and consistent dynamic friction because the rollers do not recirculate. This modification will reduce the magnitude of the error contributed by the stage to the measurement process and reduce variation within the ensemble averages. Further gains could be achieved by reducing the position errors and vibrations in the linear motor drive system. Also, despite the use of semi-rigid tubing, we observed minor perturbations in the bubble velocity due to compliance effects. Improvements to the mechanical quality of the TSS would allow measurements to approach the accuracy of fixed-stage experiments and would permit observation of instantaneous results in situations where the precision ensemble averaging provides is unnecessary.
In our measurements, we determine the interfacial shape from shadowgraph images recorded in separate trials from the vector interrogation. As discussed in section 2, Nogueira et al (2003) employed simultaneous shadowgraphy and PIV measurements. However, because of the high signal-to-noise ratio inherent to µ-PIV (our chosen technique), we are unable to employ simultaneous shadowgraphy in our experiments.
5. Conclusions
We have constructed a translating stage system capable of accurately tracking the motion of a semi-infinite bubble migrating through a sub-millimeter capillary tube. By mechanically canceling the mean forward velocity of the bubble, we are provided with nearly continuous observations of the moving interface. In steady bubble propagation trials, the TSS facilitates the analysis of significantly larger ensembles due to the tenfold increase in data collection efficiency. The large ensemble-averaged (136-frame) velocity field observed with the TSS has been shown to compare favorably to fixed-stage velocity field measurements.
The primary design goal of the translating stage was to allow µ-PIV imaging of pulsatile bubble propagation. The ensemble-averaged flow fields of these temporally dependent flows were previously inaccessible to µ-PIV investigation because of the large number of observations required to compute many averages over the course of a single oscillation. This study demonstrates the efficacy of the TSS and data analysis strategies for measuring these complex and previously unobserved phenomena.
Acknowledgment
This work was funded by National Institute of Health grant NIH R01-HL81266.
References
- Adrian RJ. Twenty years of particle image velocimetry. Exp. Fluids. 2005;39:159–169. [Google Scholar]
- Bretherton FP. The motion of long bubbles in tubes. J. Fluid Mech. 1961;10:166–188. [Google Scholar]
- Cox BG. On driving viscous fluid out of a tube. J. Fluid Mech. 1962;14:81. [Google Scholar]
- Fairbrother F, Stubbs AE. Studies in electroendosmosis: Part VI. The bubble-tube method of measurements. J. Chem. Soc. 1935;1:527–529. [Google Scholar]
- Gaver DP, III, et al. The significance of air–liquid interfacial stresses on low-volume ventilator-induced lung injury. In: Dreyfuss D, Saumon G, Hubmayr RD, editors. Ventilator-Induced Lung Injury. New York: Taylor and Francis; 2006. pp. 157–205. [Google Scholar]
- Ghadiali SN, Gaver DP., III The influence of non-equilibrium surfactant dynamics on the flow of a semi-infinite bubble in a rigid cylindrical capillary tube. J. Fluid Mech. 2003;478:165–196. [Google Scholar]
- Ghadiali SN, Gaver DP., III Biomechanics of liquid–epithelium interactions in pulmonary airways. Respiratory Physiol. Neurobiol. 2008;163:232–243. doi: 10.1016/j.resp.2008.04.008. [DOI] [PMC free article] [PubMed] [Google Scholar]
- Ghadiali SN, et al. A dual-reciprocity boundary element method for evaluating bulk convective transport of surfactant in free-surface flows. J. Comput. Phys. 2001;171:534–559. [Google Scholar]
- Huebner A, et al. Microdroplets: a sea of applications. Lab Chip. 2008;8:1244–1254. doi: 10.1039/b806405a. [DOI] [PubMed] [Google Scholar]
- Khandurina J, Guttman A. Bioanalysis in microfluidic devices. J. Chromatogr. A. 2002;943:159–183. doi: 10.1016/s0021-9673(01)01451-0. [DOI] [PubMed] [Google Scholar]
- Nogueira S, et al. Simultaneous PIV and pulsed shadow technique in slug flow: a solution for optical problems. Exp. Fluids. 2003;35:598–609. [Google Scholar]
- Otsu N. A threshold selection method from gray-level histograms. IEEE Trans. Syst. Man, Cybern. 1979;9:62–66. [Google Scholar]
- Ratulowski J, Chang H-C. Marangoni effects of trace impurities on the motion of long gas bubbles in capillaries. J. Fluid Mech. 1990;210:303–328. [Google Scholar]
- Reinelt DA, Saffman PG. The penetration of a finger into a viscous fluid in a channel and tube. SIAM J. Sci. Stat. Comput. 1985;6:542. [Google Scholar]
- Santiago JG, et al. A particle image velocimetry system for microfluidics. Exp. Fluids. 1998;25:316–319. [Google Scholar]
- Shen EI, Udell KS. A finite element study of low Reynolds number two-phase flow in cylindrical tubes. ASME J. Appl. Mech. 1985;52:253–256. [Google Scholar]
- Smith BJ, Gaver DP., III The pulsatile propagation of a finger of air within a fluid-occluded cylindrical tube. J. Fluid Mech. 2008;601:1–23. doi: 10.1017/S0022112008000360. [DOI] [PMC free article] [PubMed] [Google Scholar]
- Soares EJ, et al. Immiscible liquid–liquid displacement in capillary tubes. J. Fluid Eng. 2005;127:24–31. [Google Scholar]
- Stebe KJ, Barthes-Biesel D. Marangoni effects of adsorption–desorption controlled surfactants on the leading edge of an infinitely long bubble in a capillary. J. Fluid Mech. 1995;286:25–48. [Google Scholar]
- Stebe KJ, Maldarelli C. Remobilizing surfactant retarded fluid particle interfaces: II. Controlling the surface mobility at interfaces of solutions containing surface active components. J. Colloids Interface Sci. 1994;163:177–189. [Google Scholar]
- Stone HA, et al. Engineering flows in small devices: microfluidics towards a lab-on-a-chip. Annu. Rev. Fluid Mech. 2004;36:381–411. [Google Scholar]
- Tan Y-C, et al. Design of microfluidic channel geometries for the control of droplet volume, chemical concentration, and sorting. Lab Chip. 2004;4:292–298. doi: 10.1039/b403280m. [DOI] [PubMed] [Google Scholar]
- Yamaguchi E, et al. Micro-PIV measurements of the flow field surrounding a migrating semi-infinite bubble. Exp. Fluids. 2009;47:309–320. doi: 10.1007/s00348-009-0662-1. [DOI] [PMC free article] [PubMed] [Google Scholar]
- Zimmer ME, et al. The pulsatile motion of a semi-infinite bubble in a channel: flow fields, and transport of an inactive surface-associated contaminant. J. Fluid Mech. 2005;537:1–33. [Google Scholar]


