Abstract
Microscale particle image velocimetry (μ-PIV) measurements of ensemble flow fields surrounding a steadily-migrating semi-infinite bubble through the novel adaptation of a computer controlled linear motor flow control system. The system was programmed to generate a square wave velocity input in order to produce accurate constant bubble propagation repeatedly and effectively through a fused glass capillary tube. We present a novel technique for re-positioning of the coordinate axis to the bubble tip frame of reference in each instantaneous field through the analysis of the sudden change of standard deviation of centerline velocity profiles across the bubble interface. Ensemble averages were then computed in this bubble tip frame of reference. Combined fluid systems of water/air, glycerol/air, and glycerol/Si-oil were used to investigate flows comparable to computational simulations described in Smith and Gaver (2008) and to past experimental observations of interfacial shape. Fluorescent particle images were also analyzed to measure the residual film thickness trailing behind the bubble. The flow fields and film thickness agree very well with the computational simulations as well as existing experimental and analytical results. Particle accumulation and migration associated with the flow patterns near the bubble tip after long experimental durations are discussed as potential sources of error in the experimental method.
Introduction
The proper description of multiphase flows has been the subject of a wide range of fundamental experimental and theoretical investigations in systems with and without surfactant. These include the studies of liquid displacement by a long air bubble in surfactant-free systems (Bretherton, 1961; Halpern and Gaver III, 1994; Park and Homsy, 1984) and systems with surfactant (Ghadiali and Gaver III, 2003; Ghadiali et al., 2001; Ratulowski and Chang, 1990; Stebe and Barthes-Biesel, 1995; Stebe and Maldarelli, 1994). In addition, studies have measured the residual film thickness inside a capillary (Chen, 1986), the hydrodynamics of slug flow inside capillaries (Taha and Cui, 2004), liquid plug flow (Cassidy et al., 2001; Muradoglu et al., 2007), immiscible liquid-liquid displacement (Soares et al., 2005), and bubble velocity in microchannels (Agostini et al., 2007). The flow and surface dynamics of penetrating bubbles have also been experimentally and computationally investigated in flexible-walled systems, with an emphasis on pulmonary airway reopening. This highly non-linear system has been investigated, under steady reopening conditions, in (Gaver III et al., 1996; Gaver III et al., 1990; Hazel and Heil, 2003; Hazel and Heil, 2006; Heil, 2000; Juel and Heap, 2006; Perun and Gaver III, 1995a; Perun and Gaver III, 1995b; Yap and Gaver III, 1998; Yap et al., 1994). Commonly, computational analyses are performed to resolve the flow dynamics of the bulk fluid phase while experiments quantitatively verify macro-scale flow characteristics such as the thickness of a liquid film or pressure drop across the system. However, while recent dramatic improvements in computational simulations have allowed researchers to investigate more complex models, the lack of experimental feedback and estimations of detailed fluid dynamics from the multi-phase flow experiments has become a major limitation to the advancement of our understanding of these complicated systems hindering progress in this field.
In the biomedical field, the respiratory system is one area of research with increasing demand for detailed experimental observations of fluid dynamics. For example, mechanical ventilation is inarguably a necessary life-sustaining form of medical intervention. However, it exerts a wide range of excessive, irregular mechanical stresses and strains on the delicate and highly-sensitive tissues that make up the airways and alveoli of the lung, resulting in ventilator-induced lung injury (VILI). Multiple protective techniques to minimize airway epithelial damage have been developed including low-volume ventilation, positive-end-expiratory-pressure, and surfactant replacement therapy (Clements and Avery, 1998). Although these techniques have contributed greatly to reducing instances of VILI, further improvements still must be made to better treat patients with fewer resulting complications (Gaver III et al., 2006).
Experimental and computational studies of mechanical ventilation have been preformed to investigate the effects of reintroducing air into a fluid-occluded airway. These studies have demonstrated that the mechanical stresses resulting from the passage of the propagating finger of air (a semi-infinite bubble) through a liquid-filled airway may result in extensive epithelial cell damage. The study of the flow and surface dynamics of the penetrating bubble is key to making further improvements in ventilation strategies to reduce airway epithelial trauma.Bilek et al. (2003) and Kay et al. (2004) modeled airway re-opening by propagating a semi-infinite bubble into a narrow fluid-occluded channel with walls coated in pulmonary epithelial cells. Their counterintuitive results show that the rate of cell damage increases with decreasing bubble propagation speed. With the aid of computational simulations, further analyses of the experimental results have indicated the pressure gradient, not shear stress, is primarily responsible for cellular damage. The pressure gradient is the only stress component to increase with decreasing bubble velocity in the target flow conditions, indicating that excessive pressure gradients damage the cellular lining of the airway. This study was followed and confirmed by numerous groups (Huh et al., 2007; Jacob and Gaver III, 2005; Yalcin et al., 2007); for instance, Jacob and Gaver III (2005) included the influence of cell topography into the computational model, and found that the pressure gradient acting on the epithelial cells was even more pronounced than the original computations had demonstrated. These results have led to an interest in more detailed information of local fluid dynamics near the tip of the penetrating semi-infinite bubble. Smith & Gaver (2008) computationally investigated the flow fields surrounding a pulsating finger of air as it propagated along a rigid tube filled with a viscous Newtonian fluid. That study provides highly dynamic and intriguing spatial and temporal characteristics of the flow dynamics surrounding the bubble tip, and further explores the established relationship between pressure gradient and bubble velocity. It is clear that experimentally observed micro-scale flow field information is required to connect these phenomenological observations and computational simulations.
Particle image velocimetry (PIV) is a well established and highly versatile technology for investigating the hydrodynamic properties of macro- and micro-scale flows (Adrian, 2005). This technique uses a precisely timed pulsed light source to illuminate and record the position of fluorescent particles in two separate images at known times. The displacement of the particle images is then estimated statistically by correlating the particle image pairs (Adrian, 1991). In micro-particle image velocimetry (μ-PIV) experiments, the entire test section volume is illuminated using a cone of light emanating from the recording lens, rather than the light sheet used in PIV. The narrow focal depth of the objective lens results in a pseudo 2-D plane of focused particles for the correlation (Santiago et al., 1998). A proper set of fluorescent seeding particles and an optical high-pass filter are employed to separate the signal from background noise. Those innovations reduce the difficulties involved in creating a light sheet at the micron scale and in fabricating a microfluidic apparatus with multi-angled optical access windows that would otherwise be necessary with conventional PIV. As such, this technique is suitable to obtain instantaneous whole-field velocity information on the micro-scale.
The combination of the volumetric illumination technique (μ-PIV) in conjunction with a non-uniform channel depth provides substantial experimental challenges. For example, the particle concentration is limited by the diameter of the tube because the central region of the tube provides the greatest amount of noise from out of focus fluorescent particles. However, as described below, a sufficient seeding density must also exist in order for the in-plane flow to be accurately realized. For this reason, the low signal-to-noise (S/N) ratio at the center of the tube limits the concentration of the tracing particles.
For relatively large size capillaries (about 2–3 cm of diameter), a laser sheet illumination technique (PIV) can be used to measure flow patterns in the liquid phase of multi- phase flows (Thulasidas et al., 1997). This PIV method can be implemented to simultaneous use a pulsed shadow (PST) technique to detect the precise position of airliquid interface (Nogueira et al., 2003). However, an implementation of simultaneous PST with volumetric illumination (μ-PIV) is limited by the already low S/N ratio. To compensate for this problem,Meinhart et al. (2000) proposed a phase-averaged velocity field algorithm to overcome these low signal-to-noise ratio situations; however, this technique is difficult to implement in a multi-phase flow scenario. Additionally, Mielink and Saetran (2006) proposed a selective seeding method to reduce out-of-focus noise. Unfortunately, the 3-D nature of the flows investigated in our study make this technique untenable. Instead we have assumed, based on the results of Natrajan et al. (2007), that we can achieve satisfactory resolution and S/N ratio by careful adjustment of particle concentration and optical transparency without applying these newer techniques. Our results, shown below, confirm our ability to obtain the flow-field by carefully selecting the experimental parameters.
To directly correlate with Smith and Gaver III (2008), these experiments should employ the same capillary number range Ca =μ U /γ >0.01. Here, Ca is a dimensionless parameter that represents the relationship between viscosity and interfacial stress, while μ is the dynamic viscosity of the fluid, γ is the interfacial tension, and U is the mean flow velocity. Ca may be interpreted as the dimensionless bubble velocity and has been used theoretically to determine the shape of the bubble tip and thickness of the film of liquid deposited in the wake of the traveling bubble front (Fairbrother and Stubbs, 1935). Since water has a dynamic viscosity of 10−3 kg/m·sec and a surface tension of 72 dyn/cm2 at 20°C, the constant velocity of bubble propagation would have to be greater than 0.72 m/sec, to match Ca>0.01. This velocity range is clearly not experimentally practical; therefore the current experiments employ glycerol solutions to increase viscosity above 0.2 kg/m·sec and replace the air phase with an im miscible liquid to reduce the interfacial tension to approximately 30 dyn/cm2. Together, these changes reduce the velocity requirement to a more reasonable value of 1.5 mm/sec for Ca =0.01.
Due to the micron-size of the seeding particles, combined with their small displacements near the capillary tube wall, the contributions of Brownian motion to an instantaneous velocity field are relatively significant and can not be ignored. The μ-PIV technique utilizes an ensemble averaging method to reduce related errors for steady low-Reynolds number flow measurements where a time-averaged vector field fully describes the flow. In theory, the effects of Brownian motion are cancelled by taking the time average of an infinite number of instantaneous vector fields. However, for practical purposes, one must decide on some finite number to average by comparing the fluctuations to an analytical solution of simple flow with a similar Péclet number. In order to obtain an accurate ensemble average, we must generate flows that repeatedly pass the bubble through the observation window at constant speed and establish an accurate method to determine the axial coordinate of the bubble tip in each instantaneous field.
The following section describes the experimental settings and parameters for our μ- PIV measurement of ensemble flow fields surrounding a constantly migrating semiinfinite bubble. In this paper, we introduce to this topic the novel techniques of
A: the adaptation of computer controlled linear motor pump system to generate accurate repetitive motions of the semi-infinite bubble by inputting a square-wave forcing function, and
B: a method of bubble tip detection by examining standard deviations of centerline velocity profiles across the bubble interface.
We then directly compare our results with the computational results of Smith and Gaver III (2008) in addition to previous experimental and analytical observations (Bretherton, 1961; Cassidy et al., 1999; Fairbrother and Stubbs, 1935; Goldsmith and Mason, 1963) to verify that our technique provides the appropriate detailed fluid flow information we seek in order to properly couple phenomenological observations and computational simulations.
Experiment
μ-PIV system configuration
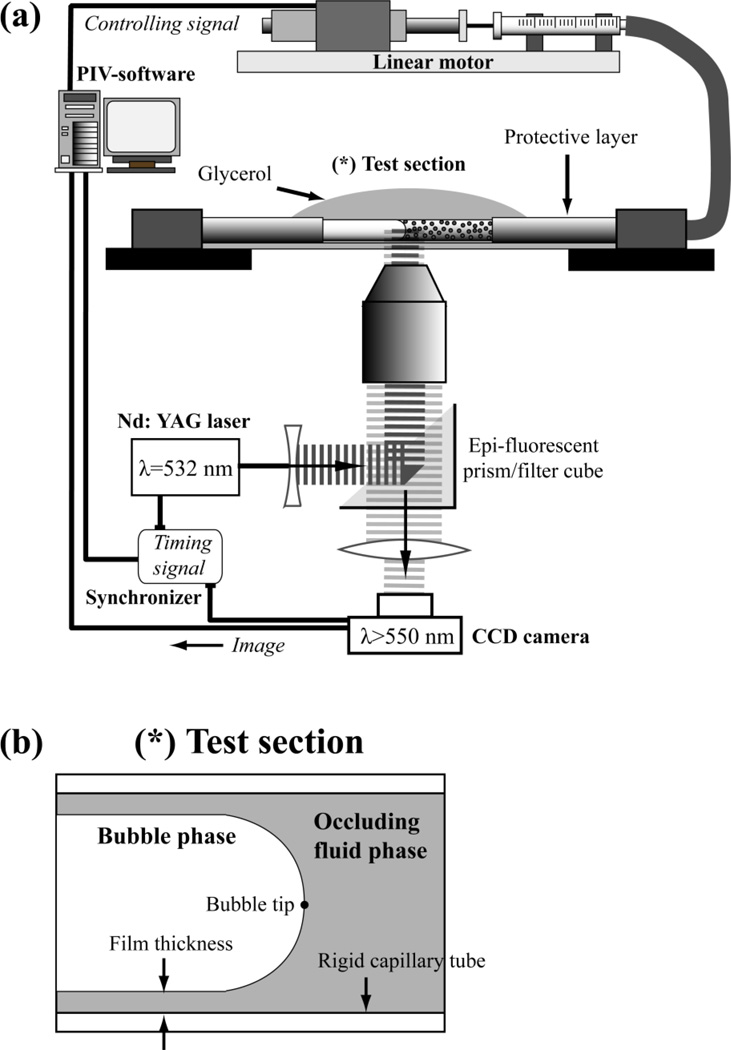
The μ-PIV system employed in this study is depicted in Fig. 1-(a). An inverted microscope (Nikon Eclipse TE2000-U, Nikon Corporation, Japan) with a 10x objective lens (NA=0.30 Plan Flour, Nikon Corp.), 2x projection lens (2x coupler, Nikon Corp.), and a 2048×2048 pixel CCD camera (12 bit, 4MP, TSI POWERVIEW Plus, TSI Incorporated, MN) provides the observation area of 721×721 µm with a theoretical pixel resolution of 0.352 µm/pixel. The volumetric illumination is provided by a dual pulse Nd:YAG laser (λ=532 nm, Power=15mJ/pulse, Pulse duration=4 ns, New Wave Laser Pulse Solo Mini, New Wave Research, CA). A beam is directed via fiber optics to an optical port on the microscope. The beam is then refracted by an epifluorescent prism and guided through the objective lens to illuminate the field of view. The liquid inside of the capillary tube is seeded with dp=1 µm fluorescent particles (Nile Red, FluoSpheres, Invitrogen Corporation, CA) that have excitation/ emission peaks at 535/575 nm. Therefore only the emission from the particles passes the high-pass filter cube (λ>550 nm) and reaches to the CCD camera to provide a particle image of the field. Timing of the camera and laser is controlled by a laser pulse synchronizer (Model 610035, TSI Inc.) so that the image from each pulse is recorded on a separate image frame which is then processed using data acquisition, analysis, and display software (Insight 3G, TSI Inc.). The interrogation employs a recursive Nyquist grid with a FFT correlation engine and a Gaussian peak algorithm with a 64×64 pixels first interrogation window, and a 32×32 pixel second interrogation window. The resulting vector fields are validated by standard deviation, local magnitude difference, and velocity range filters.
Fig. 1.
(a) Schematic of the experimental setup. (b) The modeled interface of a migrating semi-infinite bubble. Enhanced visibility of the test section is obtained by removing the protective coating from the tube in the test section and by immersing the tube in a glycerol drop.
Flow generating system
The focus of the present paper is to experimentally obtain flow fields for the liquid layer in the neighborhood of a steadily propagating semi-infinite bubble using μ-PIV. It is reasonable to assume for our rigid, uniform capillary tube and constant bubble velocity system that flow fields are time-independent when the coordinate axis resides on the bubble tip. Therefore an ensemble-averaged velocity field, which is necessary for a precise μ-PIV measurement, can theoretically be obtained by acquiring a suitable number of bubble images from repeated experiments under the same conditions. While this concept is straightforward, experimental implementation is complex. For example, a bubble with a velocity of 5 mm/sec passes through a 721×721 µm fixed observation window in 140 msec. Thus, the 5 frame/sec image acquisition system combined with the requirement that each image contain at least 2R (R is the inner radius of the capillary tube) of the fluid phase and 1R of the bubble phase for a vector interrogation would yield 0.175 frames of usable image data per each experimental run. Statistically speaking, one would obtain only 1 image every 6 trial experiments, resulting in approximately 20 usable images for an ensemble average after 120 trials. A considerably more efficient and reasonable approach is to implement a continuous data acquisition system in conjunction with a highly-accurate, precisely controlled oscillating bubble.
The proper combination of a square-wave velocity input and the deliberate positioning of the observation window enables one to measure a constant bubble propagation each time the interface passes through the field of view, allowing data acquisition to be completed in one single, continuous experimental trial. Unfortunately, common micro-flow driving equipment such as syringe pumps or pressure vessels, which are excellent at maintaining steady flow over long experimental durations, are not practical for the current application. Instead, we employ an electromagnetic precision actuator system (Electromagnetic direct linear motor P01-23×80/30×90 and E200-AT, LinMot Incorporated, Switzerland) to control bubble movement. The linear motor system consists of a magnetically driven actuator with a computer based feedback and control system. The magnetically-driven actuator is composed of a fixed stator with a linearly-aligned electromagnet and a position sensor for feedback, paired with a magnet filled slider. It is driven by a servo controller that is run using the supplied programming and monitoring software (LinMot-Talk, LinMot Inc.). The slider, with a speed range of 1 mm/sec to 20 cm/sec and less than 0.1 % position error at a 10 cm stroke is attached to the syringe that drives flow in our system, allowing for a wide range of flexibility and control. Since the target capillary tube diameter is 318 µm, a 10 µl syringe with 460 µm inner diameter (Gastight Syringe 1701, Hamilton Company, NV) was employed, resulting in a approximately 15 cm of bubble travel with each full (7 cm) stroke.
Microfluidic apparatus
In order to generate results comparable to existing experimental and computational data, the experimental apparatus must be rigid, cylindrical, and smooth. Additional requirements for integrating into our flow-driving mechanism include optical transparency, uniformity, and flexibility. A capillary tube made of fused silica coated with a polyimide protective layer (Flexible Fused Silica Capillary Tubing, Polymicro Technologies, AZ) was employed to satisfy these physical and optical conditions. We determined the inner capillary diameter to be 318 µm by the optical transparency, radial resolution, and the diameter-to-length ratio in the observation window (see the Experimental Parameters section for more detail). The capillary tube was trimmed to approximately 15cm in length and small sections of the external protective layer were removed to increase the optical transparency of the observation window. The capillary tube was then connected to 1/16” PTFE tubing on both ends, aligned, and glued onto a 12.5×5 cm microscope slide. The observation window was immersed in a drop of glycerol to reduce optical deformations caused by the curved surface of the capillary tube (see Fig. 1-(a)). Preliminary μ-PIV experiments of developing Poiseuille flows (described in the Experimental parameters section) determined the optimal tube length and observation window locations.
Experimental parameters
The combination of the capillary tube diameter and objective lens yields an ideal radial-to-axial length ratio of 1:2.21 for the capillary section image and a theoretical pixel resolution of 0.352 µm, sufficient for the 1 µm fluorescent seeding particles. The optimal volume fraction of the seeding particle was determined to be 0.0769 vol%. This was accomplished using the methodologies described in Olsen and Adrian (2000) and Meinhart et al. (1999) and by observing the optical transparency at the center of the channel. Preliminary experiments with constant Poiseuille flow showed that the optimally-seeded solution resulted in velocity errors within 2 % and a vector loss less than 1 % in the r < 0.9R region.
Because velocity and viscosity were the two limiting factors for this set of experiments, we used three different fluid phase combinations to match the required capillary number range of 3.0×10⁻⁵<Ca<6.0×10⁻² (see Table 1). While the water/air combination allowed for the greatest variability in velocity settings, the low viscosity of the liquid phase, μ=1.03*10-3 kg/m·sec, and the high surface tension, γ=72 dyn/cm2, limited Ca<10−4. On the other hand, two phase flows using a solution with a 96:4 volumetric ratio of glycerol and water (μ=0.374 kg/m·sec ) displaced by a bubble of air raised Ca=0.024. However, the high viscosity limited the velocity attainable. Finally, Si-oil, a low viscosity vinyl terminated polydimethylsiloxane (μ=5.71×10⁻³ kg/m·sec at 20°C, Gelest Incorporated, PA), immiscible in glycerol, was used to replace the air phase and reduce the surface tension to approximately γ=30 dyn/cm2. This further increased the capillary number Ca=0.063. Using two immiscible liquids had the added benefit of lowering the refractive index at the interface, which reduced optical deformation and refraction at the location where one would expect to observe the most significant and interesting fluid dynamics. The boundary conditions most relevant to this system are the normal- and tangential-stress jumps across the interface. The normal- stress jump is equal to γκ (where κ is the interfacial curvature), and in a surfactant- free system the tangential-stress jump is nonexistent. As shown by Hodges et al (2004) the viscosity ratio (Λ=μbubble/μbulk) is the characteristic that determines the influence of flows within the ‘bubble’ phase on the system dynamics. In our experiments we use air/water (Λ=0.018), air/glycerol (Λ=5×10⁻⁵) and Si-oil/glycerol (Λ=0.018). Therefore, since it is common practice to consider the air-phase to be inviscid, we carry this assumption to the Si-oil/glycerol system. Our experimental evidence (Fig. 8 and Fig. 9) confirms this assumption.
Table 1.
Flow settings for different fluid combinations.
| Solution | U (mm/sec.) | Re | Ca |
|---|---|---|---|
| water/air | 2.5–10 | 0.785–3.14 | 3.48*10−5–13.9*10−5 |
| 96%-glycerol/air | 1.0–4.0 | 1.04*10−3–4.17*10−3 | 0.006–0.024 |
| 95%-glycerol/Si-oil | 3.0–7.0 | 4.40*10−3–10.3*10−3 | 0.027–0.063 |
Fig. 8.
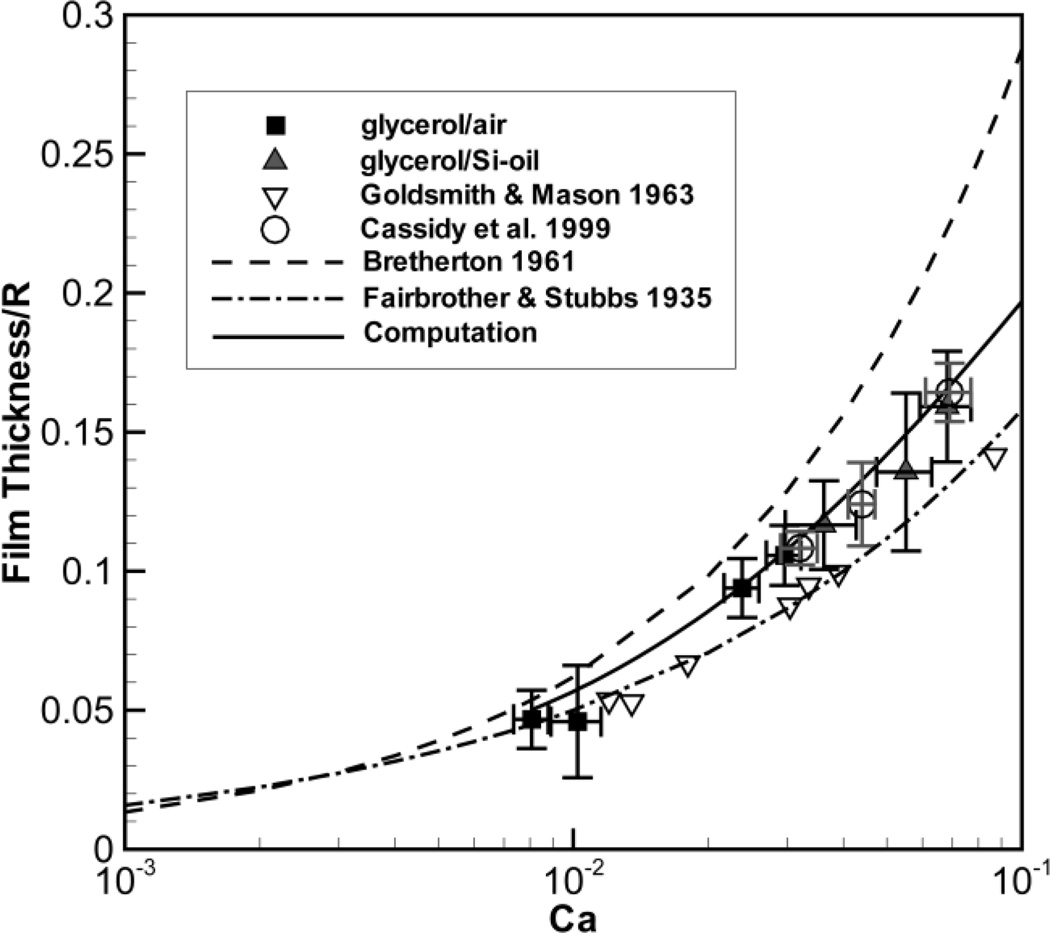
Direct measurement of normalized film thickness vs. Ca. Our results are plotted using filled squares (glycerol/air) and triangles (glycerol/Si-oil). The solid line shows computational results based on Smith and Gaver (2008), the dashed and dot-dash lines are analytical solutions (Bretherton, 1961; Fairbrother and Stubbs, 1935), and empty circles and empty deltas are experimental values (Cassidy et al., 1999; Goldsmith and Mason, 1963). Error bars on our experimental results indicate standard deviations of instantaneous film thickness (vertical) and Ca (horizontal) values.
Fig. 9.
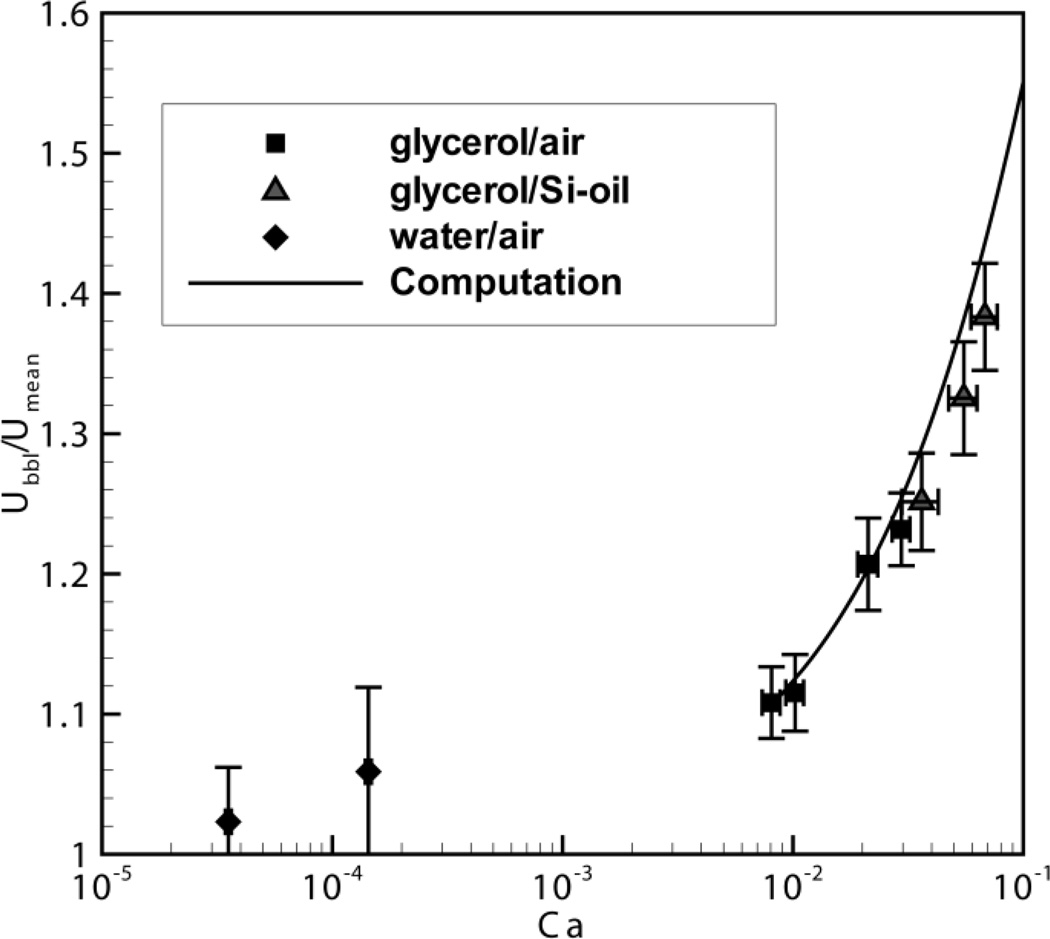
Direct measurement of normalized bubble tip velocity vs. Ca, where Ubbl is the measured bubble tip velocity and Umean is the average velocity of the fully developed region. Error bars indicate the standard deviations of instantaneous bubble velocity (vertical) and Ca (horizontal) values. The Solid line is the computational simulation based on Smith and Gaver (2008). The relatively wide margins of error for the water/air system are caused by the low signal-to-noise ratio around the bubble tip.
As previously mentioned, this measurement strategy is based on a continuous data acquisition system with fluid flow accurately controlled using a square wave velocity input: the bubble propagation starts from right edge of the capillary tube and stops at the left end; then it is retracted to its original position to start the next cycle. Our experiments therefore allow us to investigate flow surrounding the bubble under both forward (Ca>0) and reverse (Ca<0) conditions. Since the input velocity is constant in both directions (a square wave), the bubble velocity reaches steady-state after some period of flow development which is dependent upon apparatus and fluid line settings. It is therefore reasonable to assume that setting the distance to the observation window reasonably far from the original bubble position enables one to capture steady, repeatable bubble images with each cycle. Preliminary experimental results using a water-filled capillary tube suggested that the development time was approximately 3 sec when flow was driven at a constant velocity input of 7.0 mm/sec by the linear motor pump. Therefore, the observation window was created in the middle region (approximately 75 mm axially from each end) of the capillary tube to observe constant bubble behavior even with a velocity input of >10.0 mm/sec. On the other hand, the experiments with 96% glycerol solution using the same velocity input required >12 seconds to reach a state of fully-developed flow and steady propagation could not be observed in this same window even with maximum oscillation stroke length. For this case, the window had to be offset by at least 3–4 cm from the tube center, two separate observation windows were used in order to measure steady-state bubble behavior in the forward and the reverse directions of the square wave input velocity cycle. In this case, the windows were set 10 cm from the start of bubble motion.
Three different fluid combinations- water/air, 96%-glycerol/air, and 95%-glycerol/Si-oil- and the corresponding flow settings for the experimental apparatus are listed in Table 1. Phases are presented in α/β style where α is the seeded occluding phase and β is the non-seeded penetrating phase. All Ca and Re in the table were computed based on theoretical estimates of the physical properties at 20°C. For each Ca, data acquisition commenced with the square wave velocity input from the linear pump and repeated until a sufficient number of images were captured (n=20). Because flow in the liquid phase is fully-developed, the fluid dynamics captured in each sequential image are time-independent in the bubble tip frame of reference. The number of instantaneous images needed to compute the time-averaged ensemble was estimated from a constant Poiseuille flow experiment. We found that an ensemble of 20 images showed statistically insignificant differences from larger ensembles and resulted in <2% error from the theoretical value in the 0<r<0.9R region.
Results and Discussion
Image quality
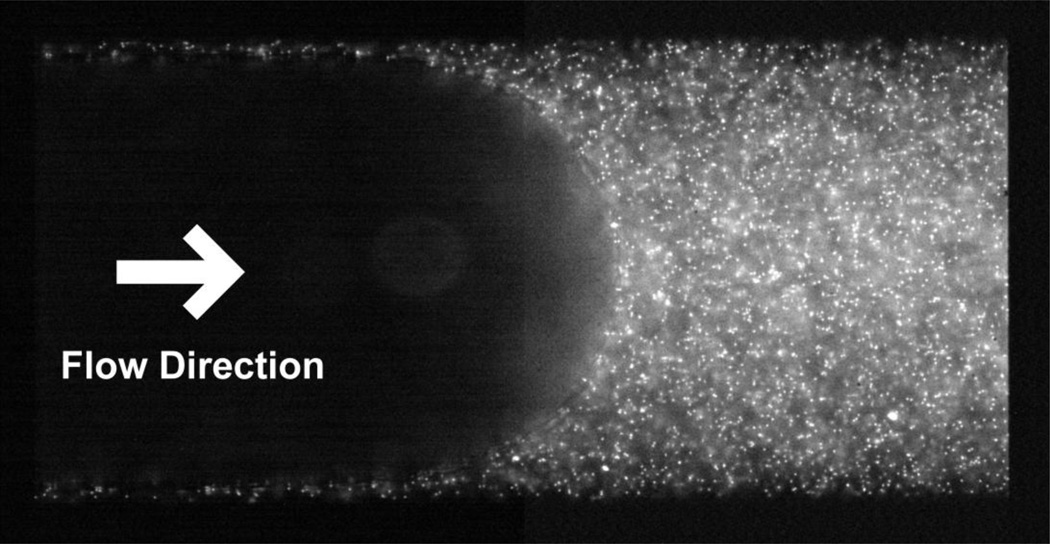
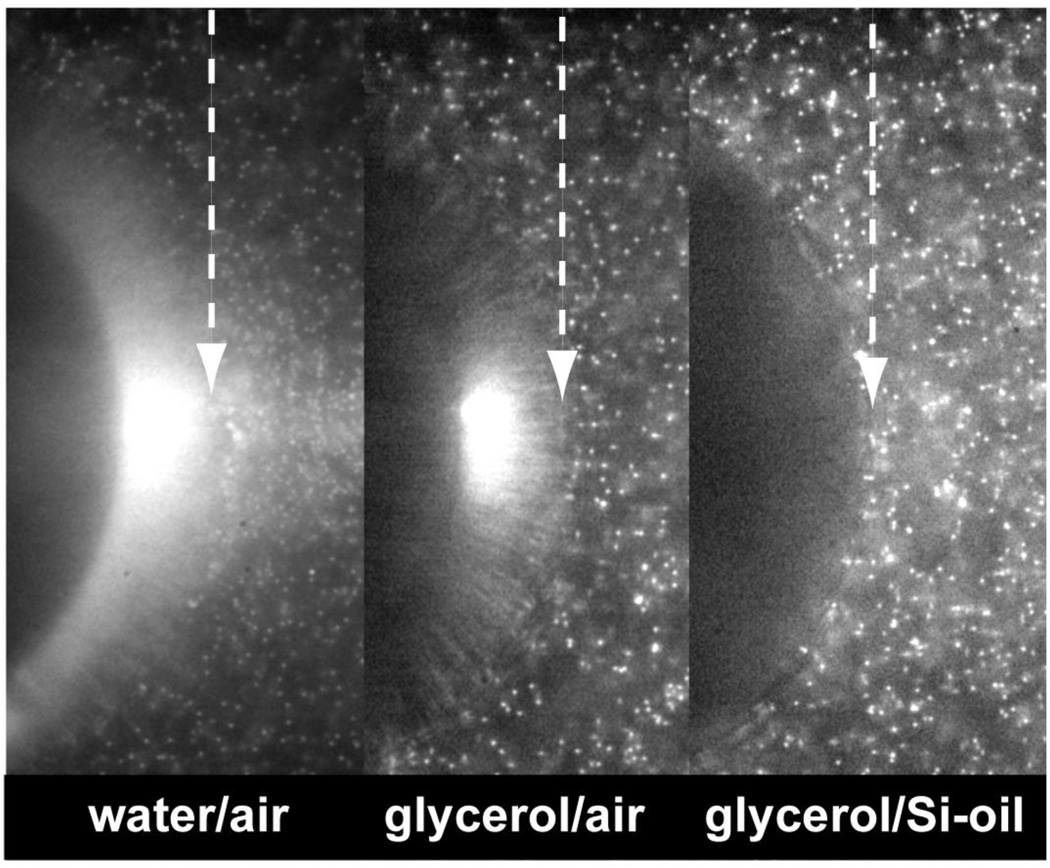
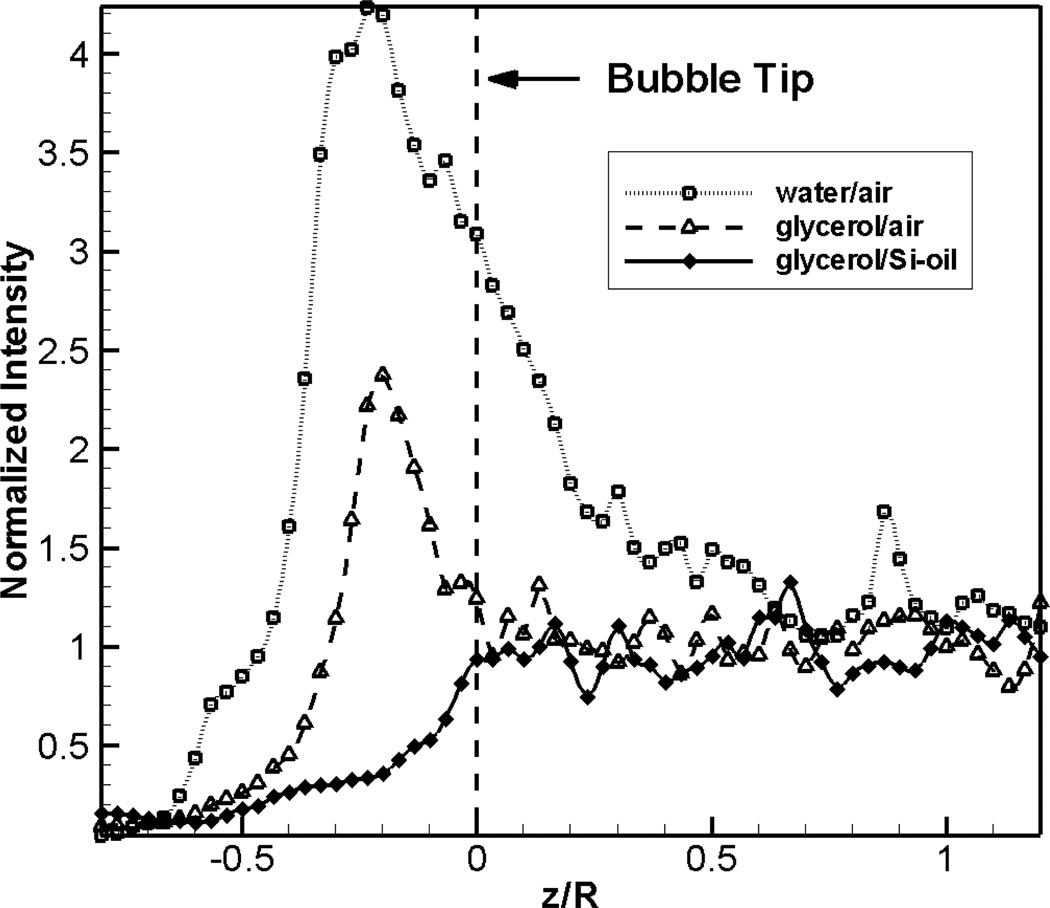
A sample fluorescent particle image of the semi-infinite bubble (Si-oil) propagating into 95% glycerol is shown in Fig. 2. The carefully optimized particle seeding population and refractive index adjustments reduce refraction, optical deformation, and uneven fluorescence from the volumetric illumination of the cylindrical channel. Although out-of-focus noise imposes a mist-like presence on the penetrating Si-oil ‘bubble’ phase, the edge of the interface remains clearly visible. The high signal-to-noise ratio allows us to identify the exact position of the bubble tip, which is critical for properly positioning the origin of the coordinate system in each instantaneous image in order to compute an accurate ensemble. Fig. 3 compares images of the bubble tip for the three fluid combinations, to properly display intensity gradients the brightness of each figure is adjusted with respect to the brightest point. The refractive index gap and interfacial curvature in the water/air and the glycerol/air systems result in strong refraction behind the actual bubble tip. It is still possible to locate the accurate position of the bubble tip in the glycerol/air system, since the refractive effects are small relative to the particle intensity near the bubble tip. Unfortunately, this is not the case with the water/air system. Fig. 4 plots pixel intensity along the centerline, averaged over 16×16 pixel areas. The bubble tip is easily identified for the glycerol/ Si-oil and the glycerol/air systems by locating the sharp gradient in the intensity curves. However, in the water/air image, the high intensity region stretches to the occluding liquid phase, obscuring out any clear indication of the bubble interface so the actual tip position must be estimated visually using clear portions of the interface images. The extended region of high intensity in the water/air images can not simply be explained by the effects of refraction at the interface of the system. First, since the refractive indexes of glycerol and water at 20°C are and respectively, there is no reason to assume that the water-air interface enhances the area of refraction significantly over that of the glycerol-air interface. Additionally, although refraction at the water-glass interface must contribute to some degree, our preliminary studies using water-filled glass capillary tube did not exhibit the highintensity gradient along the tube centerline (data not shown). Instead, we attribute this optical effect to the accumulation of fluorescent particles resulting from the fluid dynamics that arise at that experimental parameter range (to be discussed further in following section).
Fig. 2.
Fluorescent particle image of the bubble propagating from left to right for Ca=0.01. The occluded liquid phase is 0.08% seeded 95% glycerol, and the penetrating (bubble) phase is low viscosity Si-oil.
Fig. 3.
Comparison of images near the bubble tip for each of the three fluid phase combinations. Phases are presented in α/β style where α is the seeded occluded phase and β is the non-seeded penetrating phase. White arrows indicate the actual bubble tip position at the center. Here, the bubble is propagating from left to right.
Fig. 4.
Plot of pixel intensity along the capillary tube centerline. z/R denotes the axial distance from the bubble tip, normalized by the radius R. The pixel intensity is normalized by the average intensity of the occluded phase at z/R>1, with each point representing an average of 16×16 pixels.
The bubble tip position and ensemble average
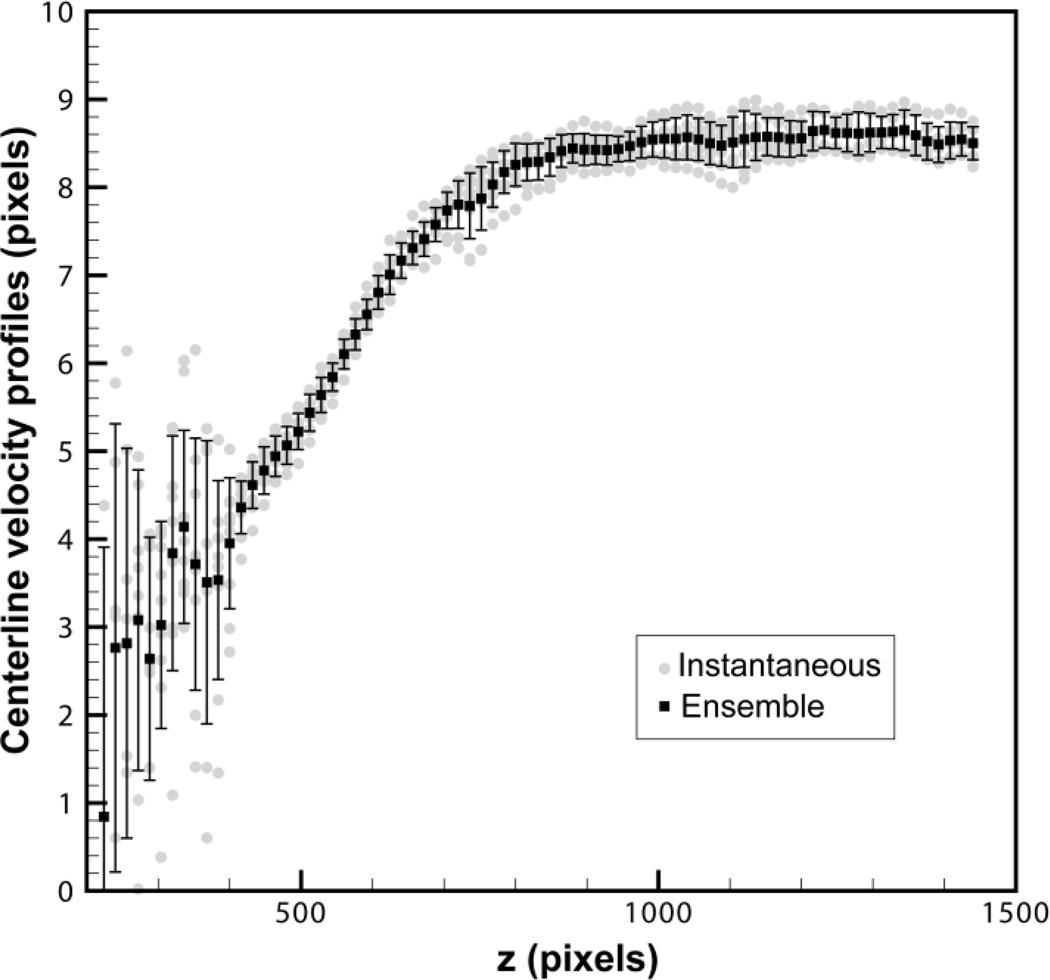
From Fig. 4, it is safe to assume that the velocity interrogation of the liquid phase is accurate for glycerin/air and glycerin/Si-oil systems. Therefore the position of the interface can be determined by examination of the standard deviation of instantaneous velocity vectors, an example of which is shown in Fig. 5. From this figure, the instantaneous velocity vectors clearly demonstrate a transition at the interface by the existence of a significant amount of noise compared to velocities measured in the liquid phase.
Fig. 5.
Instantaneous and ensemble centerline velocity profiles for Ca=0.01. Error bars indicate standard deviations (STDEV) of the instantaneous velocity at each point. The z-coordinate of instantaneous profiles are aligned at uz = 1.2umean. While the average of the STDEV in the liquid phase is 0.27±0.06, it increases significantly at the air phase. This dramatic change in the STDEV is used to identify the bubble tip location.
In order to create an accurate velocity ensemble, individual vector fields must be accurately aligned with respect to the bubble tip. To do so, we shift each image in the ensemble along the z-direction until the velocity in the transition region (between the tip and far-downstream) corresponding to uz = 1.2umean is aligned. When this is accomplished, the ensemble velocity vectors in the transition and downstream regions have very small standard deviations (STDEV). However, in the bubble phase the STDEV is substantially larger, providing a clear indication of the location of the bubble tip. Fig. 5 demonstrates the tip determination procedure, showing the centerline velocity profiles of aligned instantaneous velocity vectors, calculated ensemble, and STDEV of each point. The bubble tip was identified by the location of the last velocity point of the uniform STDEV region – this bubble tip position was cross checked with the tip position determined from direct visual examination of a sample μ-PIV image. Based on the best judgment of the tip position from μ-PIV vector field, accuracy of the method was limited to ±16 pixels (±0.036R). Since the raw μ-PIV images exhibit a 20–40 pixel zone of optical distortion (and associated low S/N ratio) along the interface (see Fig. 4) and the vector interrogation window spacing is 16 pixels, pixel-by-pixel adjustment of the original image does not improve the accuracy.
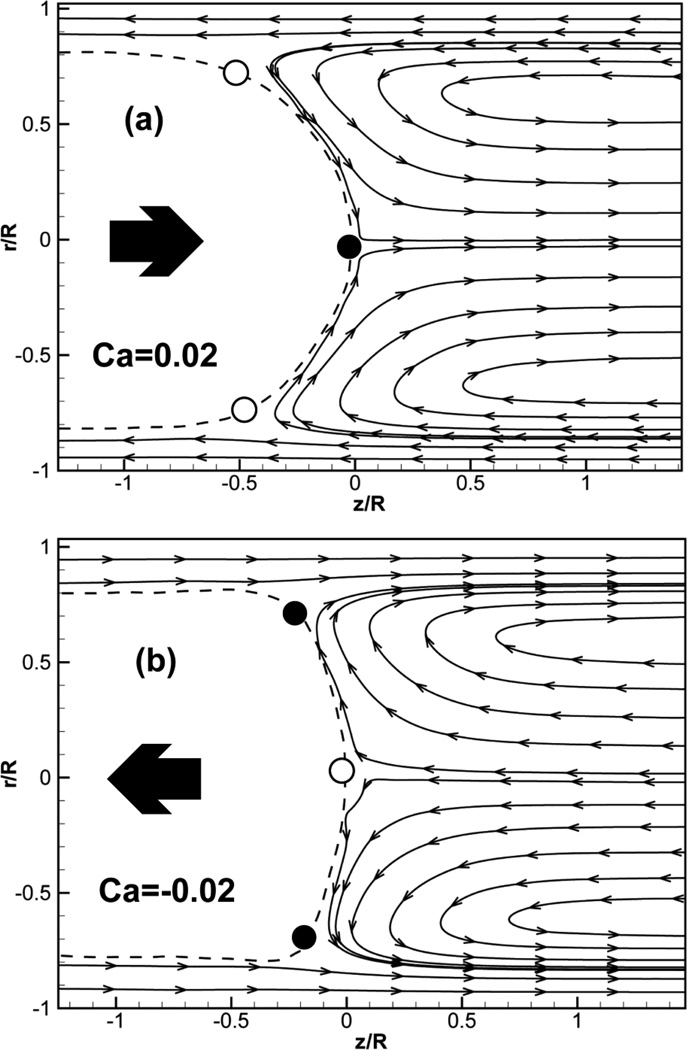
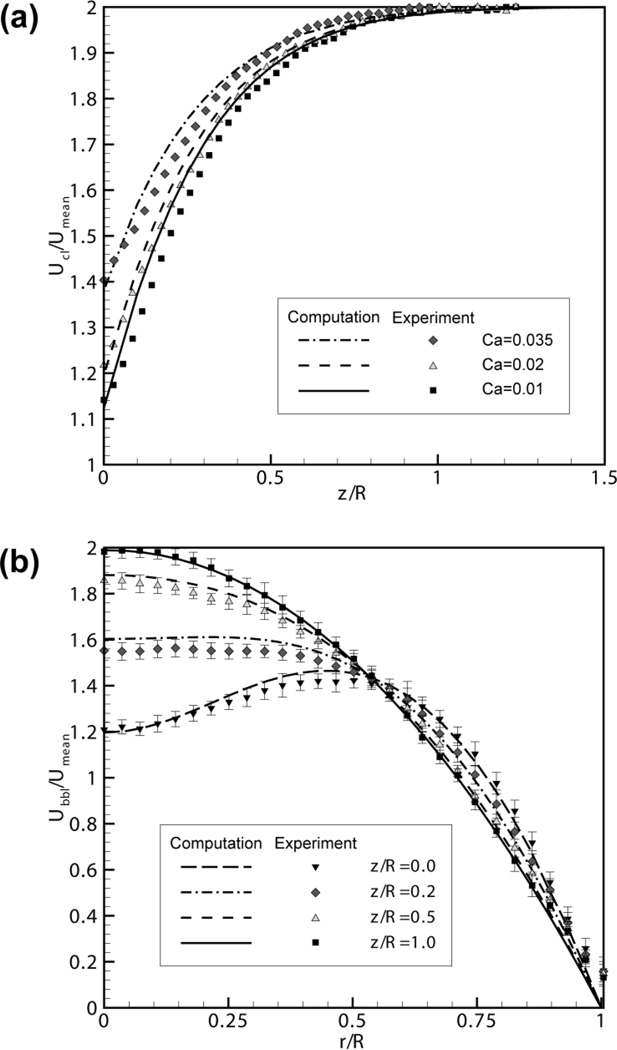
Two representative sets of streamlines generated from ensemble-averaged velocity fields in the glycerol/Si-oil system at Ca=±0.02 are presented in Fig. 6. Streamlines in the bubble tip frame of reference were derived from the average of 20 images. In Fig. 6, dashed lines represent the shape of the interface, which is taken directly from a sample fluorescence images. Converging stagnation points, where fluid flow drives the accumulation of fluorescent particles onto the interface, are denoted by filled circles, and diverging stagnation points, where particles are depleted, are indicated using open circles (see Fig. 10 for complementary images). Fig. 7 presents a detailed description of experimentally- and computationally-derived velocity profiles. Fig. 7-(a) shows the axial component of the centerline velocity for Ca=0.01, 0.02 and 0.035, along with results from Smith and Gaver’s (2008) model, which were computed using the boundary element method coupled to a lubrication theory approximation in the upstream thin-film region. In these simulations, the interface is modeled as having a constant surface tension, and hence no Marangoni (tangential) stresses are present. These simulations should therefore be directly comparable to our experimental results. The experimental data show a relatively linear velocity increase for 0<z/R<0.3, resulting in overall velocity magnitudes below those of the simulation results in this region. These errors overlap the computational predictions in the majority of points. Therefore, the computations and experiments are in very good agreement. The discrepancy may be due in part to our inability to precisely resolve the sharp velocity gradients near the bubble tip (0<z/R<0.1). Another contributing factor may be the assumptions and limitations in the computational simulations. It should also be noted these μ-PIV experiments are particularly sensitive along the centerline, where the signal-to-noise ratio is lowest. Therefore, to increase the particle concentration in order to obtain a finer interrogation grid is not an option as this would sacrifice the reliability of all vectors along the central axis. Additionally, the fluid dynamics of this system naturally drive fluorescent particles to accumulate along the interface at converging stagnation points (see Fig. 10 and the corresponding section for further detail), further confounding our ability to accurately locate the bubble tip and subtract off the proper bubble velocity. Adjustment of the coordinate system and elimination of images with particle clusters from the ensemble did not yield a better match between experimental and computational data. Studies to increase the local resolution of the bubble tip without sacrificing reliability of the whole field is a subject for further research. Fig. 7-(b) provides a comparison of the radial velocity profiles of the axial velocity component at four different axial positions (z/R=0.0, 0.2, 0.5, and 1.0) for Ca=0.02. It reveals a good agreement between experiment and simulation, except in the region near the tube wall (0.9<r/R<1.0), where the seeding density and size of the interrogation window are not sufficient to properly resolve such steep velocity gradients (Meinhart et al., 1999). This opportunity to relate experimental measurements to computational simulations on such a detailed, micro-scale level provides an invaluable first step to allowing researchers to finally verify the accuracy of their simulations of local flow dynamics.
Fig. 6.
Experimentally determined streamlines (in the bubble tip frame of reference) in the fluid surrounding a steadily propagating semi-infinite bubble calculated from ensemble-averaged velocity fields for the glycerol/Si-oil system with Ca=±0.02. The bubble is propagating at a constant velocity in the (a) positive or (b) negative direction. Dashed lines represent the location of the interface. Converging stagnation points (in the bubble tip frame of reference) are denoted by filled circles (●), diverging stagnation points are indicated by open circles (○). See Fig. 10 for complementary images.
Fig. 10.
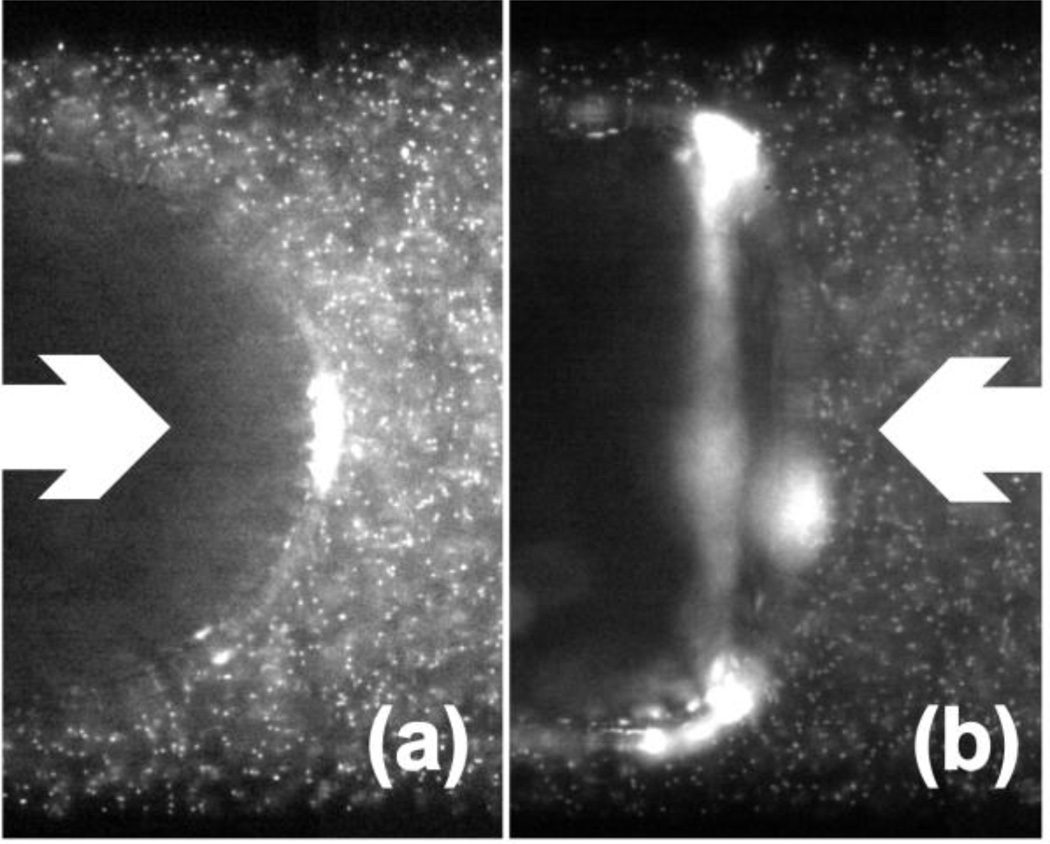
Bubble tip images of the glycerol/Si-oil experiment. White arrows indicate the direction of mean flow, with (a) representing forward flow and (b) representing reverse flow. Particle accumulations on the converging stagnation points are visible as bright white spots in the images. See Fig. 6 for complementary flow patterns.
Fig. 7.
(a) Centerline velocity profiles for various values of Ca. (b) Radial velocity profiles at different axial locations for Ca=0.02. Ucl is the centerline velocity, Ubbl is the bubble tip velocity, and Umean is the mean velocity of the corresponding fully developed region. r/R and z/R are the radial and the axial positions normalized by the capillary tube radius. Points are the z-vector component of experimentally derived ensemble velocities, error bar indicate standard deviation of instantaneous values, and the lines are taken from the computational simulations (Smith and Gaver III, 2008).
A pulsed laser light source provides clear, sharp images of the residual film. From these images, we measure the film thickness at z/R=−1 by radially scanning the pixel intensity values of each image over an axial width of 64 pixels. Local averages were calculated over areas 8 pixels in the radial direction and the 64-pixel width to create an intensity profile that was then examined to identify the location of the fluid surface from which the corresponding film thickness was determined. Finally, values in the same experimental run were averaged to represent a single film thickness. Fig. 8 shows that the fluorescent particle images provide values for film thickness comparable to predictions and measurements from prior studies over a wide range of Ca. The results agree well with the Smith and Gaver (2008) computational simulations, show smooth transition to the experimental values from Goldsmith and Mason (1963), and Cassidy et al. (1999), and fall well within the bounds established analytically by Fairbrother and Stubbs (1935) and Bretherton (1961). Fig. 9 shows the bubble tip velocity as a function of Ca, demonstrating the agreement between the μ-PIV data and computational simulation of Smith and Gaver (2008). Within the three sets of fluid combinations the greatest errors in the measurement of Ubbl are found in the water/air system at low Ca. This we attribute to the confounding issues addressed in following section.
Particle accumulation
We observed two kinds of particle accumulations in the capillary tube near the bubble tip that potentially affect the accuracy of vector interrogations and ensemble averages. As shown in Fig. 10-(a), a cluster of fluorescent particles accumulates on the interface at the tip of the forward moving bubble (a converging stagnation point) that grows larger with subsequent oscillations. This accumulation eventually distracts from the detection of the precise bubble tip position and hinders accurate evaluation of the bubble tip velocity (see Fig. 6 for a depiction of the locations of stagnation points). Fig. 10-(a) is a sample image portraying the beginning of cluster formation and accumulation during forward migration. This image demonstrates some blurring of the interface (10–20 pixels); however, with careful adjustment, the entire bubble shape is not difficult to acquire at this point. In contrast, Fig. 10-(b) shows the bubble tip during the subsequent reverse flow. It shows two fluorescent clusters on the converging stagnation points in the thin film region. Because of cylindrical nature of the system, stagnation points are actually part of a stagnation ‘ring’ surrounding the bubble cap, which appears as a thick white band in the figure. Flow reversal causes the cluster formed during forward propagation to be pushed away from the bubble tip along the interface to merge somewhere in the ring on the backward-moving bubble. During the next cycle the ring will merge onto the single converging stagnation point at the tip of the forward-moving bubble, causing the aggregation to grow with each subsequent cycle.
Eventually the stagnation point cluster will accumulate to such an extent that inter-particle forces can no longer resist shear forces, and it will be fragmented into a number of smaller clusters that are pulled into the occluding fluid downstream of the bubble tip. Repetition of this phenomenon with each cycle increases the local particle concentration and the number of broken clusters along the capillary tube centerline. As shown in Fig. 10, this increases the difficulty of performing accurate vector inter-rogations.
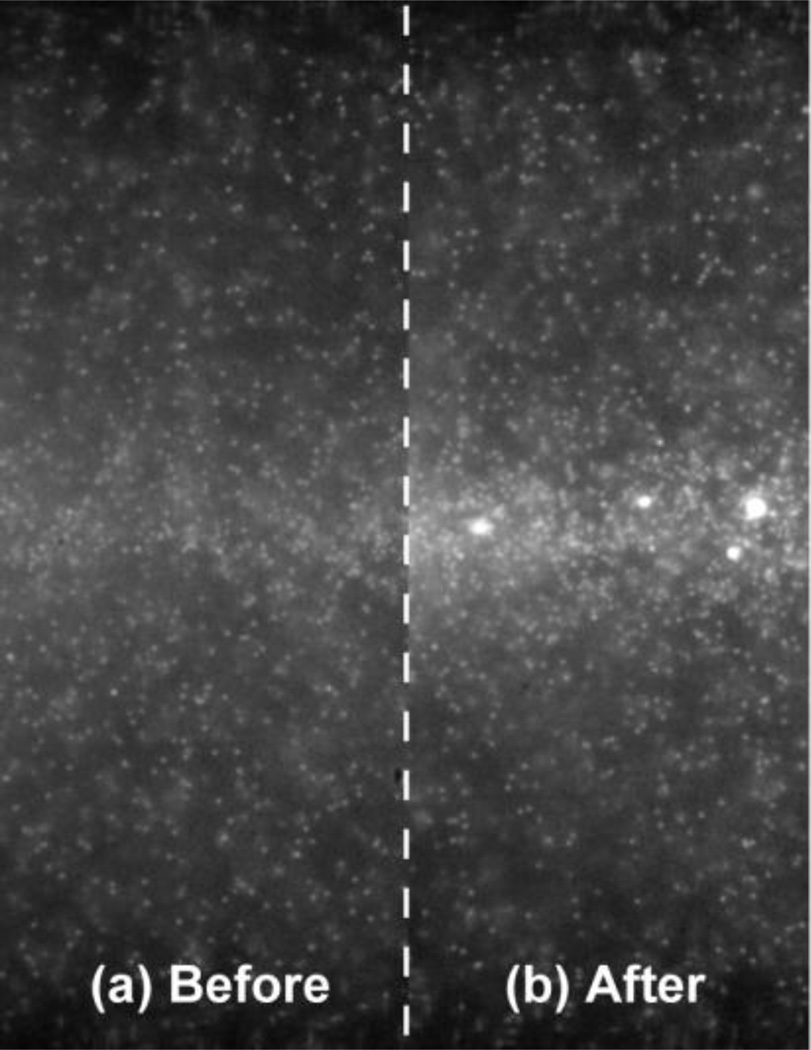
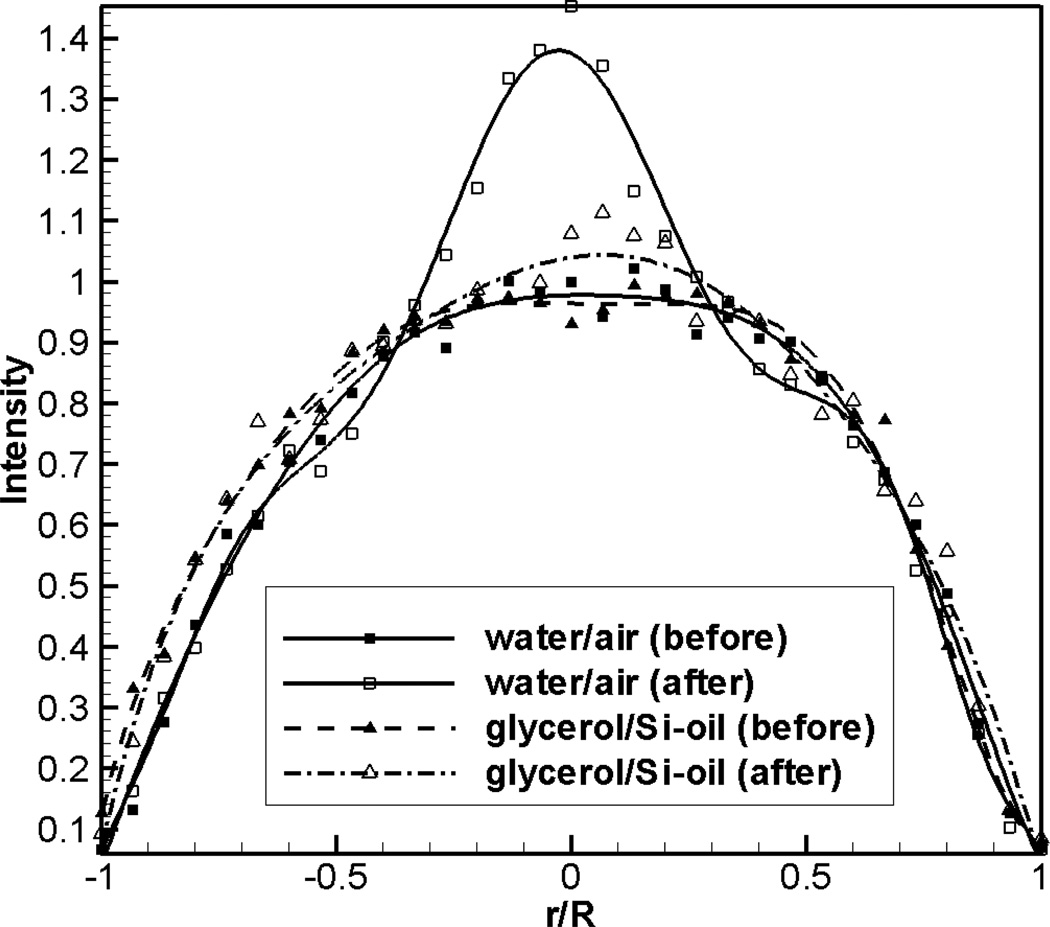
Fig. 11 shows an image comparison of the particle concentration before and after a minimum of 100 cycles of oscillation. The result of particle migration and cluster formation and fragmentation are clearly shown in Fig. 11-(b). The images shown in Fig. 10 are taken from the glycerol/Si-oil experiments to best display the sharp interface as it is overcome at specific points by bright accumulations of fluorescent particles. On the other hand, the particle migration and cluster formation results presented in Fig. 11 are taken from water/air experiments as the downstream accumulation phenomenon is not clearly visible in glycerol/Si-oil system. Quantitative evaluation of the image intensity profiles near the bubble tip, at z/R=0.1, is portrayed in Fig. 12. The water/air system clearly displays a larger degree of particle migration after the same number of oscillation cycles than observed in the glycerol/Si-oil system. From our studies, we hypothesize that particle accumulation, detachment and streaming effects are related to convection-field focusing, a solidification of the interface in regions of accumulation (similar to that created by Marangoni effects), and colloidal interactions between particles. Clearly, in all of the fluid systems examined, particle accumulation occurred at converging stagnation points. However, since the downstream steaming phenomenon is more evident in the air/water system than the Si-oil/glycerol system, it appears likely that colloidal interactions are stronger in Si-oil/glycerol. This leads to a substantial reduction of the observed streaming phenomena ahead of the bubble tip. We find this observation to be very interesting, and it is likely to be related to simulation results presented in Fig. 12c of Ghadiali and Gaver (2003) wherein surfactant accumulation at a bubble tip causes an increased concentration of surfactant downstream. While it is conceivable that particle aggregation could result in modification of the effective surface tension and induce Marangoni stresses, such a response would distribute (not aggregate) the particles by removing the converging stagnation points (Ghadiali and Gaver, 2003). Therefore, our observations are inconsistent with Marangoni stress as the driving force for aggregation. While further analysis of these phenomena extends beyond the scope of this paper, pattern formation, migration and mixing in microfluidic multi-phase flows have been investigated extensively in wide range of biomedical and chemical engineering applications (Gunther and Jensen, 2006). Recently,Zoueshtiagh et al. (2008) has reported experimental study of micro granular ripple pattern formation in oscillating two-phase flow.
Fig. 11.
Images of a section of the capillary tube around z/R=0.1 for the water/air system. (a) is an image before the experiments, and (b) is an image after at least 100 oscillations with the effects of particle migration, cluster formation, and fragmentation clearly visible along the central axis of the tube.
Fig. 12.
Intensity profiles across the diameter of the tube at z/R=0.1. Filled symbols are values prior to oscillations, and corresponding empty symbols are values after at least 100 oscillations. Intensity is normalized by the value at r/R=0 taken prior to the oscillations. Lines are polynomial fits.
This μ-PIV experimental investigation provides a robust and versatile tool for studying interfacial flow phenomena. The agreement of our data with previous experimental (Cassidy et al., 1999; Goldsmith and Mason, 1963), computational (Smith and Gaver III, 2008), and analytical results (Bretherton, 1961; Fairbrother and Stubbs, 1935) validates the utility of this method for the analysis flows over a wide range of capillary numbers. In addition, the detailed streamlines and bubble surface profiles generated by the experimental system allow investigators to verify the accuracy of their computational simulations of micro-scale flow dynamics.
Acknowledgements
This research is supported by NIH R01-HL81266. The authors would like to thank Dr. David Halpern and Anne-Marie Jacob for scientific discussion and advice.
Reference
- Adrian RJ. Particle-imaging techniques for experimental fluid mechanics. Annual Reviews of Fluid Mechanics. 1991;23:261–304. [Google Scholar]
- Adrian RJ. Twenty years of particle image velocimetry. Experiments in Fluids. 2005;39:159–169. [Google Scholar]
- Agostini B, Revelin R, Thome JR. Elongated bubbles in microchannels. Part I: Experimental study and modeling of elongated bubble velocity. International Journal of Multiphase Flow. 2007;34:590–601. [Google Scholar]
- Bilek AM, Dee KC, Gaver DP., III Mechanisms of surface-tension-induced epithelial cell damage in a model of pulmonary airway reopening. Journal of Applied Physiology. 2003;94:770–783. doi: 10.1152/japplphysiol.00764.2002. [DOI] [PubMed] [Google Scholar]
- Bretherton FP. The motion of long drops and bubbles in tubes. Journal of Fluid Mechanics. 1961;10:166–188. [Google Scholar]
- Cassidy KJ, Gavriely N, Grotberg JB. Liquid plug flow in straight and bifurcating tubes. Journal of Biomechanical Engineering. 2001;123:580–589. doi: 10.1115/1.1406949. [DOI] [PubMed] [Google Scholar]
- Cassidy KJ, Halpern D, Ressler BG, Grotberg JB. Surfactant effects in model airway closure experiments. Journal of Applied Physiology. 1999;87(1):145–427. doi: 10.1152/jappl.1999.87.1.415. [DOI] [PubMed] [Google Scholar]
- Chen JD. Measuring the film thickness surrounding a bubble inside a capillary. Journal of Colloid and Interface Science. 1986;109:341–349. [Google Scholar]
- Clements JA, Avery ME. Lung surfactant and neonatal respiratory distress syndrome. American Journal of Respiratory ad Critical Care Medicine. 1998;157:S55–S66. doi: 10.1164/ajrccm.157.4.nhlb1-1. [DOI] [PubMed] [Google Scholar]
- Fairbrother F, Stubbs AE. Studies in electro-endosmosis VI. The bubble tube method of measurement. Journal of Chemical Society. 1935;1:527–529. [Google Scholar]
- Gaver DP, III, Halpern D, E JO, Grotberg JB. The steady motion of a semiinfinite bubble through a flexible-walled channel. Journal of Fluid Mechanics. 1996;319:25–65. [Google Scholar]
- Gaver DP, III, Jacob AM, Bilek AM, Dee KC. The significance of air-liquid interfacial stresses on low-volume ventilator-induced lung injury. In: Dreyfuss D, Saumon G, Hubmayr RD, editors. Ventilator-induced lung injury. vol 215. New York: Taylor & Francis Group; 2006. pp. 157–203. [Google Scholar]
- Gaver DP, III, Samsel RW, Solway J. Effects of surface tension and viscosity on airway reopening. Journal of Applied Physiology. 1990;69:74–85. doi: 10.1152/jappl.1990.69.1.74. [DOI] [PubMed] [Google Scholar]
- Ghadiali SN, Gaver DP. The Influence of non-equilibrium surfactant dynamics on the flow of a semi-infinite bubble in a rigid cylindrical capillary tube. Journal of Fluid Mechanics. 2003;478:165–196. [Google Scholar]
- Ghadiali SN, Gaver DP., III The influence of non-equilibrium surfactant dynamics on the flow of a semi-infinite bubble in a rigid cylindrical capillary tube. Journal of Fluid Mechanics. 2003;478:165–196. [Google Scholar]
- Ghadiali SN, Halpern D, Gaver DP., III A dual-reciprocity boundary element method for evaluating bulk convective transport of surfactant in free-surface flows. Journal of Computational Physics. 2001;171:534–559. [Google Scholar]
- Goldsmith HL, Mason SG. The flow of suspensions through tubes II. Single large bubbles. Journal of Colloid Science. 1963;18:237–261. [Google Scholar]
- Gunther A, Jensen KF. Multiphase microfluidics: from flow characteristics to chemical and material synthesis. Lab on a Chip. 2006;6:1487–1503. doi: 10.1039/b609851g. [DOI] [PubMed] [Google Scholar]
- Halpern D, Gaver DP., III Boundary element analysis of the time-dependent motion of a semi-infinite bubble in a channel. Journal of Computational Physics. 1994;115:366–375. [Google Scholar]
- Hazel AL, Heil M. Three-dimensional airway reopening: the steady propagation of a semi-infinite bubble into a buckled elastic tube. Journal of Fluid Mechanics. 2003;478:47–70. [Google Scholar]
- Hazel AL, Heil M. Finite-Reynolds-number effects in steady, three-dimensional airway reopening. Trans. ASME K: J. Biomed. Engng. 2006;128:573–578. doi: 10.1115/1.2206203. [DOI] [PubMed] [Google Scholar]
- Heil M. Finite Reynolds number effects in the propagation of an air finger into a liquid-filled flexible-walled channel. Journal of Fluid Mechanics. 2000;424:21–44. [Google Scholar]
- Hodges SR, Jensen OE, Rallison JM. The motion of a viscous drop through a cyrindrical tube. Journal of Fluid Mechanics. 2004;501:279–301. [Google Scholar]
- Huh D, Fujioka H, Tung Y-C, Futai N, Paine R, III, Grotberg JB. Acoustically detectable cellular-level lung injury induced by fluid mechanical stress in microfluidic airway systems. Proceedings of the National Academy of Science. 2007;104(48):18886–18891. doi: 10.1073/pnas.0610868104. [DOI] [PMC free article] [PubMed] [Google Scholar]
- Jacob AM, Gaver DP., III An investigation of the influence of cell topography on epithelial mechanical stresses during pulmonary airway reopening. Physics of Fluids. 2005;17:031502. doi: 10.1063/1.1862642. [DOI] [PMC free article] [PubMed] [Google Scholar]
- Juel A, Heap A. The reopening of a collapsed fluid-filled elastic tube. Journal of Fluid Mechanics. 2006;572:287–310. [Google Scholar]
- Kay SS, Bilek AM, Dee KC, Gaver DP., III Pressure gradient, not exposure duration, determines the extent of epithelial cell damage in a model of pulmonary reopening. Journal of Applied Physiology. 2004;97:269–276. doi: 10.1152/japplphysiol.01288.2003. [DOI] [PubMed] [Google Scholar]
- Meinhart CD, Wereley ST, Santiago JG. PIV measurements of a microchannel flow. Experiments in Fluids. 1999;27:414–419. [Google Scholar]
- Meinhart CD, Wereley ST, Santiago JG. A PIV algorithm for estimating time-averaged velocity fields. Journal of Fluid Engineering. 2000;122:285–289. [Google Scholar]
- Mielink MM, Saetran LR. Selective seeding for micro-PIV. Experiments in Fluids. 2006;41:155–159. [Google Scholar]
- Muradoglu M, Gunther A, Stone HA. A computational study of axial dispersion in segmented gas-liquid flow. Physics of Fluids. 2007;19:072109. [Google Scholar]
- Natrajan VK, Yamaguchi E, Christensen KC. Statistical and structural similarities between micro- and macroscale wall turbulence. Microfluid Nanofluid. 2007;3:89–100. [Google Scholar]
- Nogueira S, Sousa RG, Pinto AMFR, Riethmuller ML, Campos JBLM. Simultaneous PIV and pulsed shadow technique in slug flow: a solution for optical problems. Experiments in Fluids. 2003;35:598–609. [Google Scholar]
- Olsen MG, Adrian RJ. Out-of-focus effects on particle image visibility and correlation in microscopic particle image velocimetry. Experiments in Fluids. 2000;(Suppl.):S166–S174. [Google Scholar]
- Park CM, Homsy GW. Two-phase displacement in hele-shaw cells: theory. Journal of Fluid Mechanics. 1984;139:291–308. [Google Scholar]
- Perun ML, Gaver DP., III An experimental model investigation of the opening of a collapsed untethered pulmonary airway. Trans. ASME K: J. Biomed. Engng. 1995a;117:245–253. doi: 10.1115/1.2794177. [DOI] [PubMed] [Google Scholar]
- Perun ML, Gaver DP., III The interaction between airway lining fluid forces and parenchymal tethering during pulmonary airway reopening. Journal of Applied Physiology. 1995b;75:1717–1728. doi: 10.1152/jappl.1995.79.5.1717. [DOI] [PubMed] [Google Scholar]
- Ratulowski J, Chang H-C. Marangoni effects of trace impurities on the motion of long gas bubbles in capillaries. Journal of Fluid Mechanics. 1990;210:303–328. [Google Scholar]
- Santiago JG, Wereley ST, Meinhart CD, Beebe DJ, Adrian RJ. A Particle image velocimetry system for microfluidics. Experiments in Fluids. 1998;25:316–319. [Google Scholar]
- Smith BJ, Gaver DP., III The pulsatile propagation of a finger of air within a fluid-occluded cylindrical tube. Journal of Fluid Mechanics. 2008;601:1–23. doi: 10.1017/S0022112008000360. [DOI] [PMC free article] [PubMed] [Google Scholar]
- Soares EJ, Carvalho MS, Souza Mendes PR. Immiscible liquid-liquid displacement in capillary tubes. Journal of Fluid Engineering. 2005;127:24–31. [Google Scholar]
- Stebe KJ, Barthes-Biesel D. Marangoni effects of adsorption-desorption controlled surfactants on the leading edge of an infinitely long bubble in a capillary. Journal of Fluid Mechanics. 1995;286:25–48. [Google Scholar]
- Stebe KJ, Maldarelli C. Remobilizing surfactant retarded fluid particle interfaces ii. controlling the surface mobility at intefaces of solutions containing surface active components. Journal of Colloid and Interface Science. 1994;163:177–189. [Google Scholar]
- Taha T, Cui ZF. Hydrodynamics of slug flow inside capillaries. Chemical Engineering Science. 2004;59:1181–1190. [Google Scholar]
- Thulasidas TC, Abraham MA, Cerro RL. Flow patterns in liquid slugs during bubble-train inside capillaries. Chemical Engineering Science. 1997;52(17):2947–2962. [Google Scholar]
- Yalcin HC, Perry SF, Ghadiali SN. Influence of airway diameter and cell confluence on epithelial cell injury in an in vitro model of airway reopening. Journal of Applied Physiology. 2007;103:1796–1807. doi: 10.1152/japplphysiol.00164.2007. [DOI] [PubMed] [Google Scholar]
- Yap DYK, Gaver DP., III The influence of surfactant on two-phase flow in a flexible-walled channel under bulk equilibrium conditions. Physics of Fluids. 1998;10:1846–1863. [Google Scholar]
- Yap DYK, Liebkemann WD, Solway J, Gaver DP., III The influence of parenchymal tethering on the reopening of closed pulmonary airways. Journal of Applied Physiology. 1994;76:2095–2105. doi: 10.1152/jappl.1994.76.5.2095. [DOI] [PubMed] [Google Scholar]
- Zoueshtiagh F, Thomas PJ, Thomy V, Merlen A. Micrometric granular ripple patterns in a capillary tube. Physical Review Letters. 2008;100(5):054501. doi: 10.1103/PhysRevLett.100.054501. [DOI] [PubMed] [Google Scholar]


