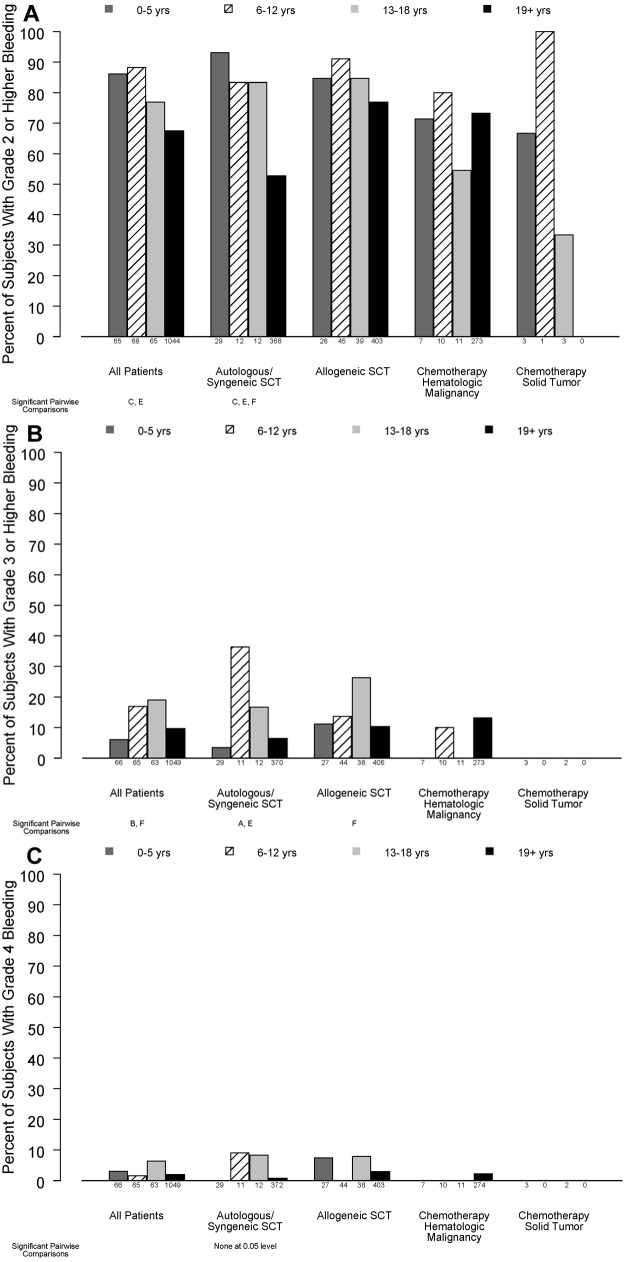
Figure 1.
Relation between age group and percentage of patients experiencing bleeding of various grades, in all patients and stratified by disease treatment category. Age group comparisons with pairwise P values < .05 are noted (A: 0-5 years vs 6-12 years; B: 0-5 years vs 13-18 years; C: 0-5 years vs ≥ 19 years; D: 6-12 years vs 13-18 years; E: 6-12 years vs ≥ 19 years; F: 13-18 years vs ≥ 19 years). (A) At least 1 day with grade 2 or higher bleeding (overall test for age group, P < .001; interaction of age group with disease treatment category, P = .04), (B) ≥ 1 day with grade 3 or higher bleeding (overall test for age group, P = .02; P for interaction = .13), (C) ≥ 1 day with grade 4 bleeding (P = .12, P for interaction not estimable).

