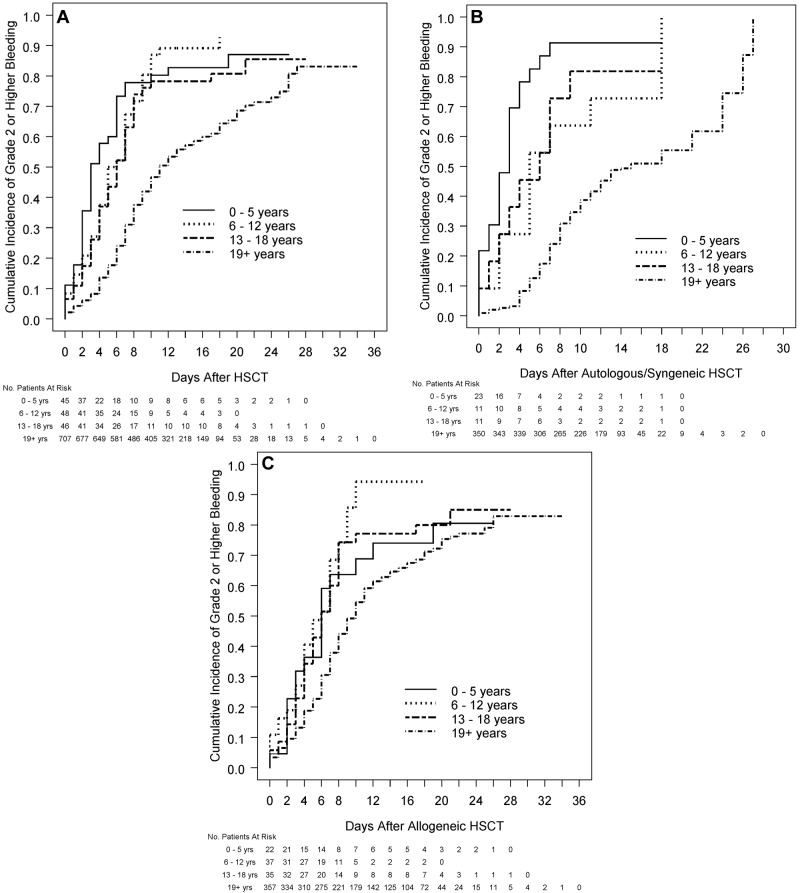
Figure 2.
Relation between age group and time from HSCT to grade 2 or higher bleeding in all patients who received HSCT and by type of HSCT. (A) All patients who received HSCT (overall test for age group, P < .001, each pediatric age group significantly different from adults; interaction of age group with type of transplantation, P < .001). (B) Patients who receive autologous/syngeneic HSCT (overall test for age group, P < .001, each pediatric age group significantly different from adults). (C) Patients who received allogeneic HSCT (overall test for age group, P < .001, 6-12 and 13-18 years significantly different from adults).

