Abstract
Continuous analysis of two dyes loaded into single mammalian cells using laser-based lysis combined with electrophoretic separation was developed and characterized on microfluidic chips. The devices employed hydrodynamic flow to transport cells to a junction where they were mechanically lysed by a laser-generated cavitation bubble. An electric field then attracted the analyte into a separation channel while the membranous remnants passed through the intersection towards a waste reservoir. Phosphatidylcholine (PC)-supported bilayer membrane coatings (SBMs) provided a weakly negatively charged surface and prevented cell fouling from interfering with device performance. Cell lysis using a picosecond-pulsed laser on-chip did not interfere with concurrent electrophoretic separations. The effect of device parameters on performance was evaluated. A ratio of 2 : 1 was found to be optimal for the focusing-channel : flow-channel width and 3 : 1 for the flow-channel : separation-channel width. Migration times decreased with increased electric field strengths up to 333 V cm−1, at which point the field strength was sufficient to move unlysed cells and cellular debris into the electrophoretic channel. The migration time and full width half-maximum (FWHM) of the peaks were independent of cell velocity for velocities between 0.03 and 0.3 mm s−1. Separation performance was independent of the exact lysis location when lysis was performed near the outlet of the focusing channel. The migration time for cell-derived fluorescein and fluorescein carboxylate was reproducible with <10% RSD. Automated cell detection and lysis were required to reduce peak FWHM variability to 30% RSD. A maximum throughput of 30 cells min−1 was achieved. Device stability was demonstrated by analyzing 600 single cells over a 2 h time span.
Introduction
Chemical cytometry, the chemical analysis of single cells on a cell-by-cell basis rather than as an average of many cells, has the potential to yield unparalleled insights into mechanisms of cellular function.1,2 Lab-on-a-chip technology, which has cell-sized volumes and laminar flow, is a promising tool for these challenging analyses.3–7 Microfluidic chemical cytometry finds its roots in microelectrophoretic methods originally developed with capillary electrophoresis (CE).8–11 In CE-based cytometry, single cells are lysed by physical or chemical means and the cellular contents measured with fluorescent detection limits of as little as 1000 molecules.
Cell lysis is a crucial first step in the process. The simplest, but often slowest, method (on the order of seconds to tens of seconds) uses detergents to break up the membrane.12–15 Wu and co-workers developed an impressive series of valves and reactors on chip with picolitre volumes to isolate a cell and lyse it in a small volume, followed by electrophoretic separation of the contents.12 Some biological processes, especially cell signaling, are extremely rapid16 (subsecond time scale) and may be exquisitely sensitive to chemical or electrical changes in the cell’s environment. In order to take a snapshot of cellular contents under normal conditions, lysis must be so rapid that it is complete before the signaling network is perturbed. A more rapid alternative to chemical lysis is to use an electric field to induce pore formation in the cell membrane.17–20 Ramsey and co-workers reported a continuous analysis chip in which cells transported by hydrodynamic flow traversed an AC electric field for lysis.19 Addition of a detergent to the cell solution near the point of lysis also acted to disrupt the cell in less than 30 ms. While this design achieved the best performance to-date for overall performance, the location of cell lysis was limited to the intersection of the separation channel with the flow channel. Over 30 min, the high electric field needed to lyse cells in this intersection leads to fouling of the separation channel walls and a 25% change in migration times, making it necessary to add a viscous emulsification agent (3% v/v P84).
An alternative method to achieve cell lysis is laser-mediated lysis, in which a high intensity, short pulse duration laser is used to generate a cavitation bubble that mechanically lyses the cell in less than 1 ms.21 Laser-based lysis has been applied with capillary electrophoresis22,23 and both static24 and continuous25 microchip electrophoresis of individual mammalian cells, but a robust and well-characterized continuous format (>100 cells and >1 h chip operation times) has not been demonstrated. Continuous microchip CE with laser-based lysis has been hindered to date by several key challenges. First, two optical interrogation points are needed very close together. One location is used for cell detection and laser-mediated cell lysis. The other point is used for laser-induced fluorescence detection of analytes from the cells. Additionally, hydrodynamic fluid flow to move the cells prior to lysis must be combined with electrophoretic flow on the same microfluidic chip. This balance of forces presents challenges that can only be overcome by purposeful design followed by further optimization of the surface properties, fluid flow rates, and microchannel architecture. Issues such as channel biofouling by cellular debris as well as Joule heating due to the presence of the high-salt physiological buffer further complicate this process. The successful combination of laser-mediated cell lysis with continuous microelectrophoretic separation is important because the combination offers the potential for high speed analysis rates as well as low dispersion of cell contents during lysis.21 Further, the pulsed beam used for cell lysis can be positioned at any location in the transparent microfluidic channels. Thus cells can be lysed at any point on the device enabling full optimization of chip operation and cell analysis.
In this work, a new microchip format was developed to couple laser lysis with continuous electrophoretic separation of cell contents. A hybrid PDMS/glass device was used in order to speed the prototyping of different channel designs. The substrates were also inexpensive and disposable when compared with etched glass devices. Although the separation efficiency was lower than that obtained on a glass device, the efficiency was sufficient to separate the chemically similar small molecules, fluorescein (FL) and fluorescein carboxylate (FL(COOH)). A unique feature of the devices was the supported bilayer membrane (SBM) coating throughout that prevented cell adhesion to and biofouling of the channel walls.26 This coating has previously been demonstrated to yield high reproducibility and excellent separation efficiency for biological analytes in capillary27 and microchip28 electrophoresis. Because SBMs are similar to the cell membrane, they are ideal for coating microfluidic devices that utilize living cells.29,30 Their very nature also provides them with resistance to nonspecific adsorption of cell components released during lysis.31 A key limitation in many single-cell cytometry chips has been the use of non-physiological or isotonic buffers.12,18,32,33 While these buffers serve well for proof-of-concept testing, the device should be capable of operating with higher salt physiological buffers in order to minimize cell perturbation prior to analysis. SBM-coated microchips were recently shown to provide sufficient resolution of peptide substrates in a high-salt physiological buffer.28 These robust coatings and easily fabricated chips combined with laser-based lysis simplify device manufacture and improve reliability. The architecture of the SBM-coated chips was also optimized with regards to channel width and placement. Separations of single cells’ contents were compared with standards separated on a conventional cross microchip. The effects of separation voltage, laser energy, cell flow speed, and lysis location on device performance were then characterized. An improved automated cell targeting system was developed and shown to improve the reproducibility of the results. Finally, the microfluidic chips were tested to determine the maximum analysis throughput and evaluate the microchip durability during analysis of large numbers of cells.
Experimental
Materials
Egg phosphatidylcholine (PC) was obtained from Avanti (Alabaster, AL). Influx pinocytic cell-loading reagent, fluorescein diacetate and fluorescein carboxylate diacetate were acquired from Invitrogen (Carlsbad, CA). The dyes were cleaved intracellularly to form the fluorescent species, fluorescein (FL) and fluorescein carboxylate (FL(COOH)). Tris-ves buffer was composed of 10 mM tris and 150 mM NaCl and adjusted to pH 7.4. Tris-sep buffer was prepared with 25 mM Tris at pH 8.4. ECB-Glu buffer (ECB) was defined as 135 mM NaCl, 5 mM KCl, 10 mM HEPES, 1 mM MgCl2, 1 mM CaCl2 and 10 mM glucose at pH 7.4. F-ABL was synthesized by Anaspec, Inc. (San Jose, CA) with an amidated C-terminus. The peptide sequence was fluorescein-Glu-Ala-Ile-Tyr-Ala-Ala-Pro-Phe-Ala-Lys-Lys-Lys. The peptide was also obtained in the phosphorylated form with the phosphate on the side chain of the tyrosine residue (pF-ABL). For microchip fabrication, two-component PDMS (Sylgard 184 PDMS elastomer) was purchased from Dow-Corning. Tubing (3.2 mm id and 6.4 mm od silastic) was obtained from Cole-Parmer (Vernon Hills, IL). Oxidation of tubing and PDMS was performed with the Harrick PDC-001 plasma cleaner (Ithaca, NY). All optical filters were Semrock (Rochester, NY) and fiber optics were from Oz (Ottawa, Canada).
Cell preparation
Just prior to use, BA/F3 cells (mouse leukemic cells) were washed twice with ECB, loaded with fluorescein diacetate (10 nM) or fluorescein carboxylate diacetate (10 nM) in ECB by incubating for 30 min at room temperature, washed 2 times in ECB, incubated for 30 min in ECB in a CO2 incubator at 37 °C, and rinsed 2× with ECB.
Vesicle preparation
PC vesicles were prepared from chloroform stocks in Tris-ves buffer as previously described.28 Vesicles were stored up to 2 weeks at 4 °C.
Chip fabrication
Devices were constructed from PDMS using soft lithography, plasma oxidized and bonded irreversibly to a No. 1 glass coverslip. The master mold used for the channels was a silicon wafer fabricated in the UNC CHANL cleanroom facility using conventional photolithography with a SU-8 3000 photoresist. The cell loading channel (Fig. 1) was 60 μm in width and the separation channel was 20 μm in width. The focusing channel was 120 μm wide and intersected the loading channel 50 μm away from the separation channel (on the cell loading reservoir side). The cell loading channel and focusing channel were tapered out at the ends to 240 μm width. The widths of the focusing channel and cell loading channel were varied for optimization experiments as described in the Results and discussion. After assembly, reservoirs were attached with a rapid plasma-based method,25 and the channels were filled with PC vesicles for 30 min, followed by 10 min of rinsing with Tris-sep buffer.
Fig. 1.
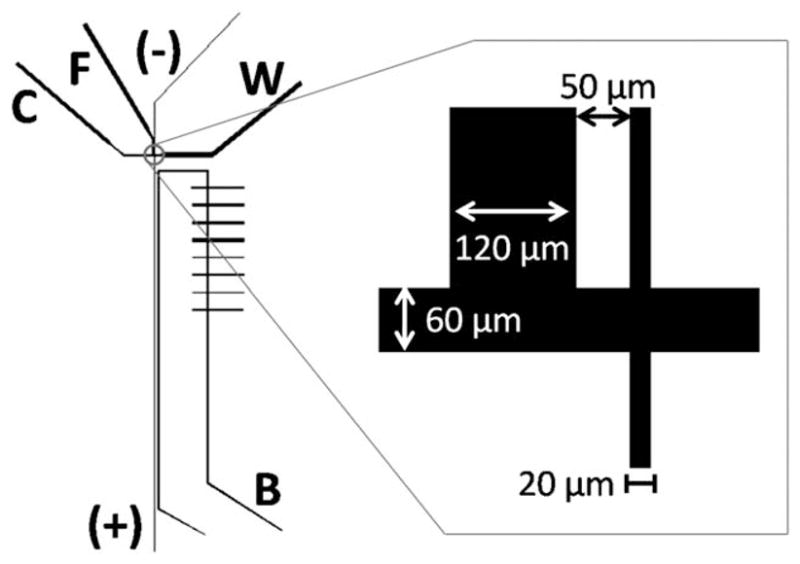
Schematic of the cytometric chip. C: cell-loading channel, F: focusing channel, (−)/(+) separation channel, W: waste outlet, B: reference channel used for LIF alignment. Inset shows sizes of critical dimensions.
Single cell cytometry
A volume difference was established between the cell reservoir (C) and waste (W) so that cells traveled at a rate of 0.1 mm s−1 past the separation channel. Before reaching the separation channel, the cells were lysed with a single laser pulse from a 532 nm picosecond pulsed laser (Artic Photonics) that was focused in the vertical center of the channel, and the fluorescent contents were electrophoresed into the separation channel towards the positive electrode. The remaining debris from the semi-intact cell structure was visually observed to be carried by the flow towards the waste reservoir. The electrophoretic voltage, pulsed laser, and data collection were all controlled by a National Instruments interface card with a custom program using Lab-View software. Automated cell lysis was controlled by a second National Instruments interface card with customized software written in LabView.
On-chip detection
Laser-based lysis was achieved by placing a microscope objective below the fluidic chip to focus the pulsed laser beam while fluorescence excitation and detection of cellular analytes was achieved using a second objective located above the chip. Delivery of the pulsed laser beam for cell lysis has been described previously.24 For fluorescence excitation of analytes, an argon ion laser (488 nm, JDS Uniphase) was coupled as described previously through a custom laser-induced-fluorescence module.24 A Nikon 40 ×/0.75 NA air objective delivered the excitation beam and was centered over the electrophoretic separation channel on a custom-built support utilizing an xyz micropositioner. Fluorescence was collected with the same objective, filtered with a long-pass fluorescein filter and collected by a fiber optic cable that delivered the emitted light to a photomultiplier tube (R9110, Hamamatsu, Bridgewater, NJ). A reference fluidic channel (RB) was located 200 μm from the separation channel and was filled with fluorescent beads in order to assist with the location of the separation channel.
Results and discussion
Microchip design
Recent developments in rapid fabrication and SBM-surface coating of hybrid glass/PDMS devices25 enabled inexpensive and convenient testing of a large number of different channel configurations similar to those of McClain et al. (Fig. 1).19 Cells were loaded into a reservoir attached to the cell loading channel (C) (Fig. 1). This channel was tapered, to prevent clogging with debris, before intersecting the separation channel (labelled as −/+). After cell lysis, large-sized, cellular debris moved toward the waste reservoir (W). To focus the cells, a second focusing channel (F) intersected the cell loading channel (on the cell-loading, reservoir side of the separation channel intersection). The depth of all channels was 30 μm which permitted the Ba/F3 cells to move unobstructed through the channels. A reference channel (B) adjacent to but not intersecting the separation channel was filled with fluorescent beads and used as a guide in locating the separation channel for fluorescence detection. It was necessary to optimize several dimensional parameters before the SBM-coated PDMS/glass hybrid device worked as intended. These included the widths of the flow channel, focusing channel, and separation channel, and the gap between the focusing channel and the separation channel.
For experiments to optimize the chip architecture, a simplified screening strategy that enabled rapid assessment of different chip dimensions was utilized. A mixture of intact cells and a solution of fluorescein in ECB was flowed (0.1 mm s−1) through the cell-loading channel. The intact cell served as a marker for the plasma membrane and large organelles following cell lysis and the free fluorescein was a marker for intracellular analyte. The channel intersection was imaged with a fluorescence microscope to identify the direction traveled by the intact cells and extracellular fluorescein. An electric field strength of 333 V cm−1 was applied across the reservoirs of the separation channel and a cell flow rate of 0.1 mm s−1 was employed. The ratio of the cell-loading channel width to the separation channel width (near the intersection) was the first key parameter that was varied. A ratio of 1 : 1 (30 : 30 μm) permitted complete transfer of fluorescein along with the intact cells into the separation channel. Under these conditions the electroosmotic flow (0.6 mm s−1) into the separation channel towards the (+) electrode dominated the hydrodynamic flow towards the waste reservoir. Using a cell-loading channel to separation channel ratio of 5 : 1 (50 : 10 μm), both the cells and extracellular fluorescein traveled past the separation channel and into the waste channel. At a ratio of 3 : 1 (60 μm : 20 μm) the fluorescein was transferred into the separation channel while the cells continued onto the waste channel. The 20 μm diameter of the separation channel on these devices provided a greater resistance to hydrodynamic fluid flow and presented a smaller entry way to prevent whole cells from entering the separation channel. The smaller channels also yielded lower currents for the same voltage, minimizing Joule heating. All subsequent work utilized a 60 : 20 μm for the cell-loading to separation channel ratio, 0.1 mm s−1 hydrodynamic flow in the cell-loading channel and an electric field strength of 333 V cm−1 across the separation channel.
The performance of the focusing channel was found to be important for several reasons. First, the channel provided a low-salt buffer (Tris-sep) that intersected with the high-salt ECB in the cell-loading channel. This acted to decrease the salt content in the separation channel. The Tris-sep buffer also prevented debris build-up in the channels which occurred when ECB was used in the focusing channel. Second, the fluid flow from the focusing channel positioned the cells at a reproducible location near the separation-channel entryway. Thus all cells moving through the device could be lysed at nearly the same point in the channel. Finally, by focusing the stream of cells, the cell speed was increased by 3-fold, transporting the lysed contents more quickly through the intersection and providing less time for diffusional dispersion. To optimize the focusing channel, its width was varied (60 μm, 120 μm, and 240 μm) and the location of the intact cells and extracellular fluorescein observed. The flow rate of the focusing channel was 0.02 mm s−1 and the ratio of flow rates between the two channels was constant so long as the same volume was used in both reservoirs and the ratio of the channel widths was the same. A ratio of focusing channel width to cell-loading channel width of 2 permitted a narrowed cell stream without stopping the cell flow. Ratios greater than 2 almost completely pinched off flow from the cell loading channel whereas smaller ratios resulted in an insufficient flow of the Tris-sep buffer with resulting accumulation of debris at the channel intersections. The ratio of 2 was similar to that used by McClain and colleagues in a glass device and was employed in all subsequent chip designs.19
The gap between the focusing channel and the separation channel was evaluated for distances of 25, 50 and 100 μm under identical experimental conditions. The 25 μm gap resulted in a highly focused stream of fluorescein traveling past the separation channel without entry into the separation channel. With the 100 μm gap, the fluorescein was no longer tightly focused at the separation channel intersection. The gap of 50 μm yielded a good compromise localizing cells to the channel edge with free fluorescein entering the separation channel. Although the gap is smaller than that used by McClain and coauthors,19 the flow of cells in that work was driven by a syringe pump, resulting in a faster 1 mm s−1 flow rate and thus the need for a greater transition distance between the channels. For all subsequent devices, the distance between the focusing channel and the separation channel was 50 μm.
Analysis of single-cell contents on-chip
Cells possessing intracellular FL and FL(COOH) were placed into the cell-loading channel and moved by hydrodynamic flow (0.1 mm s−1) to the intersection of the channels. As the cells approached the separation channel, a pulsed laser was manually triggered delivering a single-focused pulse. Cells within a micron of the beam were mechanically lysed.24 To determine whether the contents of a lysed cell entered the separation channel, and could be separated and detected, the fluorescence of the separation channel was measured 2.5 mm from the channel intersection.
Two peaks were readily visible for each lysed cell (Fig. 2A). When the cells were not loaded with fluorescent dyes or when the laser was triggered in the absence of a cell, no peaks were evident on the electropherogram. When FL and FL(COOH) standards were separated on a cross-chip under similar electrophoretic conditions, the FL(COOH) migrated at a faster rate than FL. Thus it was likely that the initial peak was due to FL(COOH) and the 2nd peak due to FL. To verify the identity of the peaks, cells loaded with only FL(COOH) or only FL were lysed and their contents separated and detected. In each of these cases, only a single peak was present on the electropherogram (Fig. 2B). Cells loaded with FL(COOH) displayed a peak at 3.88 ± 0.26 s (FWHM of 0.42 ± 0.11 s, n = 14 cells, 1 device), migrating at a faster rate than the single peak at 6.96 ± 0.11 s (FWHM of 0.49 ± 0.04 s, n = 14 cells, 1 device) obtained from cells loaded with FL. Similar results were obtained on a second device. It was also noted that under the conditions used to load the cells with the two fluorescent dyes, the relative peak height and migration time were consistent throughout all experiments over several months. These attributes were used to identify FL(COOH) and FL from lysed cells co-loaded with the dyes.
Fig. 2.
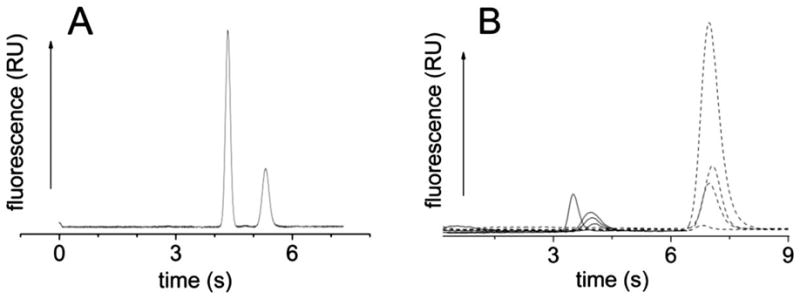
Electrophoresis of FL(COOH) and FL from single cells. (A) A single cell was lysed and the contents FL(COOH) (3.89 s) and FL (5.49 s) separated (235 V cm−1). (B) Electropherograms from single cells loaded with FL(COOH) (solid traces) or with FL (dashed traces). For both (A) and (B) time zero was the time at which the laser pulse was triggered to lyse the cell.
The device was then tested for its ability to serially lyse, separate, and detect the contents of single cells in a flowing stream. In the prior experiment, no cell was lysed while another’s contents were undergoing separation, greatly decreasing the analysis rate for the cells. For these next experiments, the cells were lysed during the ongoing separation of the contents of previously lysed cells (Fig. 3A).
Fig. 3.
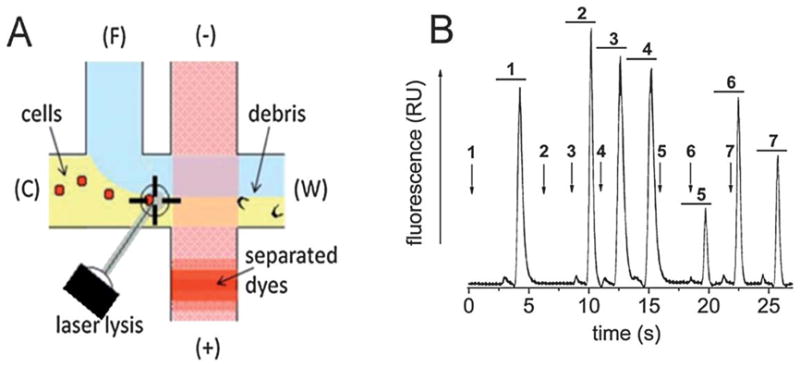
Simultaneous cell lysis and separation of cell contents in the microchip. (A) Schematic showing the process of continuous cell lysis followed by separation and detection of the cellular contents on the microchip. Yellow represents the ECB buffer while blue the Tris-sep buffer. The red crosshatch depicts the separation channel and the solid red band is an analyte band. (B) Electropherogram from continuous separation of the contents of 7 individual cells. The arrows mark the times when the laser was triggered. The numbers above the laser trigger times are matched to the peak pairs (horizontal bars) obtained from the lysed cell. For all peak sets, the first (small) peak is FL(COOH) and the second (large) peak is FL.
Under these conditions, two peaks were observed from each cell lysed (Fig. 3B). The peak shapes and FWHM (0.38 ± 0.11 s for FL(COOH) and 0.40 ± 0.10 s for FL, n = 3) were similar to those when cell separation and lysis were not simultaneous. Thus the mechanical impulse and transient bubbles generated by the focused laser beam did not disrupt the separation of analytes from other cells. These data suggest that the minimal time between the lysis of two sequentially analyzed cells will be determined by the migration times of the fastest migrating peak of one cell and the slowest migrating peak of the prior cell. Once the analyte peaks of one cell overtake those of the prior cell, it may be difficult to accurately determine the source and identity of the peaks.
Optimization of the chip operating parameters
Influence of voltage on migration time
Single cells loaded with FL and FL(COOH) were placed in the cell loading channel, lysed and their contents separated using different electric field strengths on the microchip with the optimized channel design. As expected from the theory, the analyte migration times decreased with increasing voltage applied across the separation channel (Fig. 4). Since the recorded migration time included the time between cell lysis and lysate entry into the separation channel in addition to the time traveled in the separation channel, the curve was nonlinear in shape flattening out at higher voltages. The shortest migration time yielding an acceptable resolution is desirable not only to achieve higher throughput, but also to minimize band broadening due to diffusion.34 While the resolution remained acceptable at voltages greater than 350 V cm−1, unlysed cells entered the separation channel rather than the waste channel. Intact cells within the separation resulted in clogging of the narrow channel. Thus the highest electric field strength that yielded reliable device operation was 333 V cm−1.
Fig. 4.
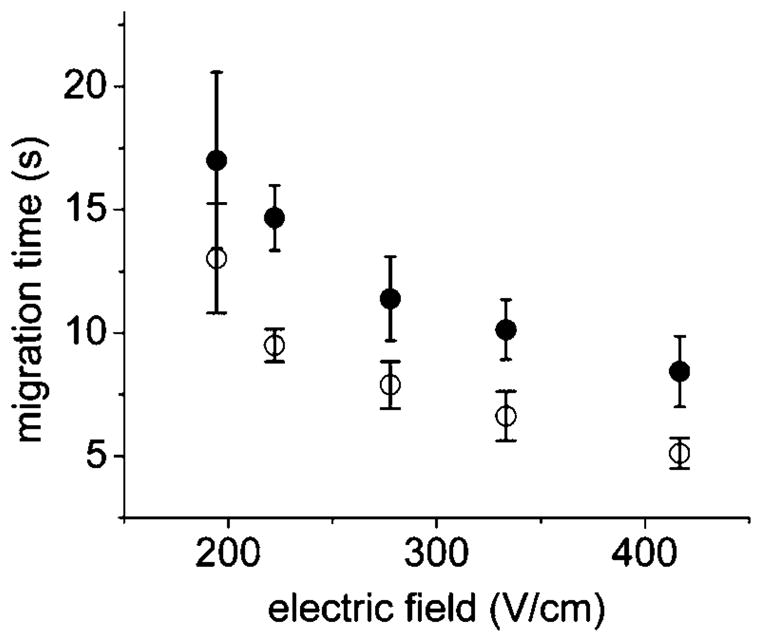
Effect of electric field on the migration time of cell contents. Filled circles are FL and open circles are FL(COOH). Symbols represent the average of the data points and the error bars depict the standard deviation.
Effect of hydrodynamic flow on performance
Conventional CE is highly efficient since analytes move with a flat rather than a parabolic flow profile flow during separation.34 While the separation channel possessed a high resistance to fluid flow relative to the other channels on the chip, some pressurized fluid flow occurred within the separation channel. It was important to understand the influence of this hydrodynamic flow on device performance. In chips with an optimized channel design and operating parameters as described above, a series of single-cell analyses were performed with cells traveling at different flow rates. To vary the cell’s velocity, the volume of liquid added to the waste reservoir was altered. The cell velocity just prior to lysis was measured using a video camera. For each lysed cell, its velocity was plotted against the analyte FWHM and migration time (Fig. 5). At a velocity of 0.1 mm s−1, the average migration time for FL(COOH) was 6.7 ± 0.3 s and for FL was 10.8 ± 0.7 s. The average FWHM for FL(COOH) was 0.4 ± 0.1 s and for FL was 0.5 ± 0.0 s. When the cell velocity was varied from 0.03 to 0.3 mm s−1, neither the FWHM nor the migration times were substantially altered. The unchanged FWHM and migration times suggested that for these conditions, pressure-driven fluid flow in the separation channel was minimal.
Fig. 5.
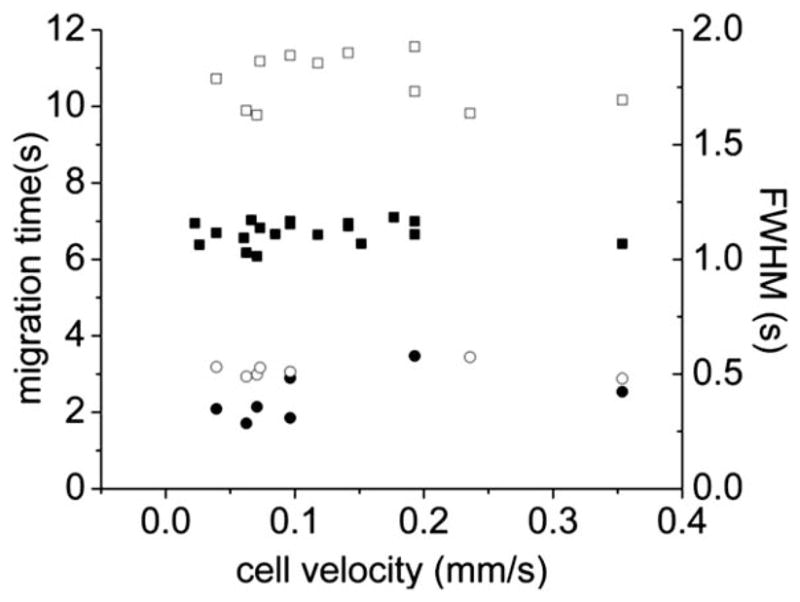
Effect of cell velocity on the migration time (squares) and FWHM (circles) of FL(COOH) (solid symbols) and FL (open symbols). Each point represents data from a single cell. Two chips showed similar results.
Effect of laser energy and beam position on separation performance
The laser pulse energy used to lyse cells loaded with FL and FL(COOH) was varied (5, 6, 10 μJ) using the optimized chip design and parameters. The average value of the migration time, peak height and peak FWHM obtained for the fluorophores did not depend significantly on the laser pulse energy (Fig. S1†). However, the reproducibility of the peak height was reduced at higher energies suggesting that the more turbulent forces generated by the higher energies might lead to a greater dispersion of the cell contents. Consequently, 5 μJ was used to lyse cells in all subsequent experiments.
An advantage of optical lysis is the ability to readily move the beam to any desired location on the chip. Superimposition of multiple video image cells demonstrated a consistent path for cells moving through the device (Fig. 6A). Three locations along the cell path were selected to assess the best location for cell lysis: the front edge of the focusing channel (F, nearest the separation channel), the middle of the focusing channel (M), and the back edge of the focusing channel (B). Cells loaded with FL(COOH) and FL were placed into a chip and lysed at either B, M or F followed by separation of the cellular contents. Sequential video images were also analyzed to measure the velocity of a cell at points B, M and F. The velocity of cells at point B was 0.06 mm s−1, at M 0.08 mm s−1, and at F 0.19 mm s−1. The migration time and peak FWHM were independent of the laser lysis location (Fig. 6B and C). For all subsequent experiments, the laser was fired at position F. The best separation efficiency obtained with the optimized parameters for FL was 449 000 ± 209 000 plates m−1. Although this is less than the 1.3 million plates m−1 obtained on a glass device by McClain,19 it was more than sufficient to separate the two chemically similar small molecules used in this work. Similar efficiencies have been shown to be sufficient for separation of peptides and proteins on hybrid glass/PDMS SBM-coated cross microchips.25
Fig. 6.
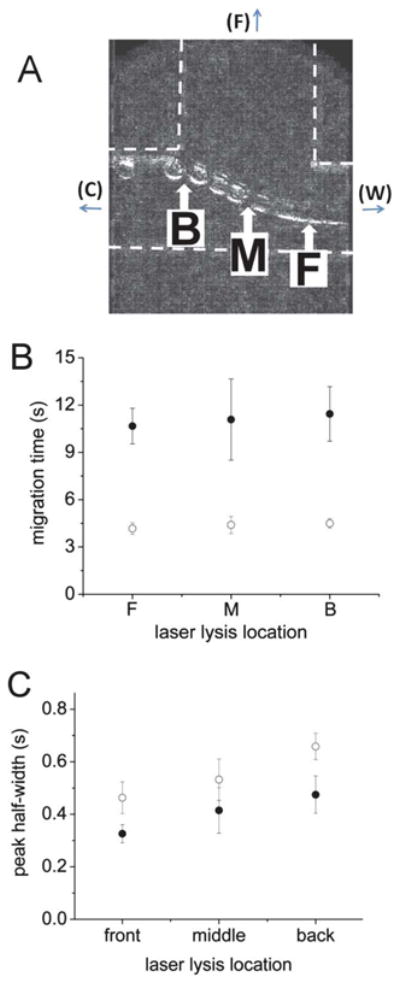
Optimization of cell-lysis location. (A) Shown are superimposed images of single cells traveling past the focusing channel. F: front lysis location, M: middle lysis location, and B: back lysis location. The distances from the separation channel were 200 μm (F), 260 μm (M) and 320 μm (B) respectively. Effect of lysis location on (B) migration time and (C) separation efficiency of single cell contents. Open circles are FL and closed circles are FL(COOH). The symbols represent the average of the data points and the error bars depict the standard deviation.
Automatic cell targeting and lysis
While the migration times of the cellular analytes were reproducible on the chip, a large variability in peak FWHM was present. This was partially due to the large differences in cell size but also to the manual triggering of the laser pulse for cell lysis. This human element resulted in a lack of reproducibility in the distance between the cell and laser beam position. To improve the uniformity of cell lysis, cell recognition followed by automated laser firing was implemented. The light intensity at the laser location was monitored using a video camera. An alteration in the video signal intensity occurred as a cell moved through that region of the channel. The intensity change was used to initiate the laser pulse. To determine whether the automated cell recognition and firing improved the peak FWHM reproducibility, cells loaded with FL and FL(COOH) were analyzed in the chip. The RSD for the resolution of FL and FL(COOH) and peak FWHM of FL(COOH) was improved by a factor of 2 (Fig. 7). The RSD for FL peak FWHM was enhanced 1.7-fold. The migration time reproducibility also improved for both fluorophores and was similar to that attained using a capillary-based system and a glass microchip for serial analysis of cell contents.35,18
Fig. 7.
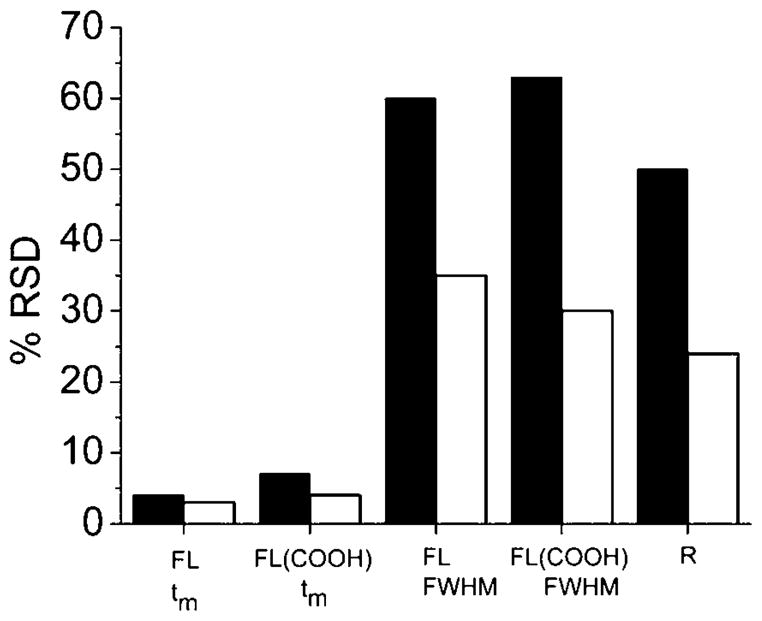
Comparison of manual and automated cell recognition and lysis. Single cells loaded with FL and FL(COOH) were analyzed using either manual (black bars) or automated (white bars) recognition and laser triggering. Shown is the RSD of the migration time (tm), FWHM and resolution (R) (n = 18).
Maximum throughput and operational stability
The application of a single cell cytometric device in a research or clinical environment puts stringent demands on throughput and durability to achieve analysis of sufficiently large numbers of cells. The chip developed in this work was tested to determine the limits of throughput and the maximum number of cells that could be analyzed before the data quality deteriorated. Cells loaded with FL and FL(COOH) were loaded into the device and their contents analyzed with automated cell recognition and lysis. The rate at which the laser fired was adjusted to achieve the maximal cell analysis rate i.e. without peak overlap between adjacent cells (Fig. 8A). At this rate 4 cells could be lysed and their contents separated in 8 s equivalent to a throughput of 30 cells min−1. Due to limitations in the instrumental setup, the minimal distance from the separation channel intersection to the detection zone was 2.5 mm. A goal for future designs of the platform will be to decrease this distance further enhancing throughput.
Fig. 8.
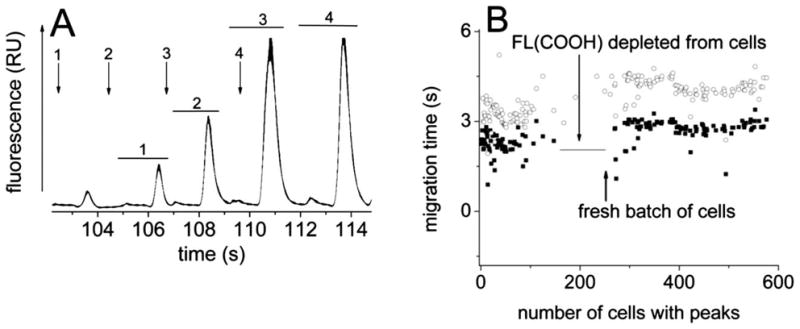
Fast serial analysis of cell contents. (A) Elecropherogram showing the maximal rate of cell analysis. The arrows indicate the times at which cells were lysed. The numbered arrows mark the times when the laser was triggered to lyse a cell. The numbered horizontal lines mark the peak pairs matched to the laser pulse/cell-lysis event of the same number. (B) On a single chip, 600 cells were lysed and the contents separated over 2 h. Migration times for intermittently analyzed FL (open circles) and FL(COOH) (closed squares) peaks are plotted. Each symbol represents the data from a single cell. A new batch of cells was loaded onto the chip at the time marked by the arrow.
To investigate the chip durability during cell analysis, cells loaded with FL and FL(COOH) were placed into a device and the chip operated for over 2 h with a throughput of over 600 cells (Fig. 8B). The cells were lysed at a speed less than the maximal rate so that analyte peaks could be easily identified manually. The migration times of the fluorophores were measured at periodic intervals to track the separation quality of the cellular analytes. To simplify analysis and easily evaluate chip performance, the properties of only clearly resolved FL/FL(COOH) peak pairs were measured. For these long analysis times the peaks of some cells overlapped when cells close together were lysed. At 1 h, the cells no longer possessed a peak attributable to FL(COOH) suggesting that this fluorophore was excreted from the cell. Cells newly loaded with the two fluorophores were then placed into the chip. As the new cells replaced the older cells in the channel, peaks attributable to both FL(COOH) and FL were apparent. These cells were analyzed on the chip for another hour. In total, over 600 cells were analyzed without failure of the device. The fluorophores from the newly loaded cells possessed a slightly longer migration time relative to those of the initially loaded cells. This was likely due to small differences in the ion concentration surrounding the newer cells. Throughout the 2 h analysis time the fluorophore peaks remained well resolved. Similar results were obtained for multiple other devices.
Conclusion
The combination of laser-based cell lysis and microelectrophoresis in the microfluidic device achieved excellent throughput, stability, and separation performance for Ba/F3 cells loaded fluorescent dyes. Key features of this device were the hybrid glass/PDMS composition, the SBM surface coating, the optimized channel layout, and the balanced hydrodynamic flow, electrophoretic mobility and electroosmotic flow on the chip. Further the design possessed a high tolerance for variation in these forces so that a small change in cell speed or focusing flow resulted in only a small change in the cell path and separation parameters rather than a loss of device functionality. This stability permitted long-term use and cell analysis with the devices. In addition to the data shown here, new devices for experiments were made each day over a period of 1 year and were routinely utilized for 1–2 h with analysis of hundreds of cells for the optimization studies, further illustrating the robust and reproducible fabrication methods and device design.
The extensive characterization of physical parameters enabled the production of a device with similar separation results to prior published devices but on an easily coated PDMS/glass hybrid chip. Migration time reproducibility and peak FWHM were similar to conventional cross-chip based separations. Remarkably the focused laser pulses did not interfere with concurrent separations, permitting 1 cell to be lysed while the contents of another were undergoing separation. A range of laser energies over that required for plasma formation was tolerated with little effect on the migration time, analyte recovery, or separation performance. The use of hydrodynamic flow simplified device operation and, surprisingly, variations as large as 10-fold in the flow rate yielded little effect on the migration time or separation performance. Finally the automated cell recognition used to trigger the laser significantly improved the large cell-to-cell variation in peak FWHM.
Future work will involve both simulations and experiments with device parameters to improve the capture of cell contents so that less mobile analytes, other cell types, and lower concentrations of analytes can be analyzed. Further separation/throughput performance gains for additional analytes might be obtained by tailoring the membranes with immobile charged dopants.36 Improvements in the focusing design and flow rate stability over longer times are also needed to improve the actual cell throughput. In this work a maximal rate of 300 cells h−1 was demonstrated which is significant considering that the current best rate using capillaries is 108 cells h−1.35 The theoretical maximal analysis rate on the current device is 1800 cells h−1 which may be attainable with the improvements discussed above. For microfluidic devices, the highest throughput data reported for cells in a physiologic buffer was 420 cells h−1.19 However throughputs of thousands of cells per hour may not be useful if the device performance degrades after 100 cells due to surface fouling. Thus a focus on the long term stability and robustness of the devices is required for these systems to reach their true potential.
Acknowledgments
This work was supported by grants from the NIH (F32CA126258 to K.S.P., R01EB004436 to N.L.A.).
Footnotes
Electronic supplementary information (ESI) available. See DOI: 10.1039/c0lc00370k
References
- 1.Borland LM, Kottegoda S, Phillips KS, Allbritton NL. Annu Rev Anal Chem. 2008;1:191–227. doi: 10.1146/annurev.anchem.1.031207.113100. [DOI] [PubMed] [Google Scholar]
- 2.Cohen D, Dickerson JA, Whitmore CD, Turner EH, Palcic MM, Hindsgaul O, Dovichi NJ. Annu Rev Anal Chem. 2008;1:165–190. doi: 10.1146/annurev.anchem.1.031207.113104. [DOI] [PubMed] [Google Scholar]
- 3.Culbertson CT. Methods Mol Biol. 2006;339:203–216. doi: 10.1385/1-59745-076-6:203. [DOI] [PubMed] [Google Scholar]
- 4.El-Ali J, Sorger PK, Jensen KF. Nature. 2006;442:403–411. doi: 10.1038/nature05063. [DOI] [PubMed] [Google Scholar]
- 5.Dittrich PS, Tachikawa K, Manz A. Anal Chem. 2006;78:3887–3907. doi: 10.1021/ac0605602. [DOI] [PubMed] [Google Scholar]
- 6.Sims CE, Allbritton NL. Lab Chip. 2007;7:423–440. doi: 10.1039/b615235j. [DOI] [PubMed] [Google Scholar]
- 7.Roman GT, Chen Y, Viberg P, Culbertson AH, Culbertson CT. Anal Bioanal Chem. 2007;387:9–12. doi: 10.1007/s00216-006-0670-4. [DOI] [PubMed] [Google Scholar]
- 8.Hogan BL, Yeung ES. Anal Chem. 1992;64:2841–2845. doi: 10.1021/ac00046a031. [DOI] [PubMed] [Google Scholar]
- 9.Kennedy RT, Oates MD, Cooper BR, Nickerson B, Jorgenson JW. Science. 1989;246:57–63. doi: 10.1126/science.2675314. [DOI] [PubMed] [Google Scholar]
- 10.Wallingford RA, Ewing AG. Anal Chem. 1988;60:1972–1975. doi: 10.1021/ac00169a027. [DOI] [PubMed] [Google Scholar]
- 11.Dovichi NJ, Hu S. Curr Opin Chem Biol. 2003;7:603–608. doi: 10.1016/j.cbpa.2003.08.012. [DOI] [PubMed] [Google Scholar]
- 12.Wu H, Wheeler A, Zare RN. Proc Natl Acad Sci U S A. 2004;101:12809–12813. doi: 10.1073/pnas.0405299101. [DOI] [PMC free article] [PubMed] [Google Scholar]
- 13.Sun Y, Yin XF. J Chromatogr, A. 2006;1117:228–233. [Google Scholar]
- 14.Hellmich W, Greif D, Pelargus C, Anselmetti D, Ros A. J Chromatogr, A. 2006;1130:195–200. doi: 10.1016/j.chroma.2006.06.008. [DOI] [PubMed] [Google Scholar]
- 15.Huang B, Wu HK, Bhaya D, Grossman A, Granier S, Kobilka BK, Zare RN. Science. 2007;315:81–84. doi: 10.1126/science.1133992. [DOI] [PubMed] [Google Scholar]
- 16.Gorre ME, Mohammed M, Ellwood K, Hsu N, Paquette R, Rao PN, Sawyers CL. Science. 2001;293:876–880. doi: 10.1126/science.1062538. [DOI] [PubMed] [Google Scholar]
- 17.Han FT, Wang Y, Sims CE, Bachman M, Chang RS, Li GP, Allbritton NL. Anal Chem. 2003;75:3688–3696. doi: 10.1021/ac0341970. [DOI] [PubMed] [Google Scholar]
- 18.Kleparnik K, Horky M. Electrophoresis. 2003;24:3778–3783. doi: 10.1002/elps.200305667. [DOI] [PubMed] [Google Scholar]
- 19.McClain MA, Culbertson CT, Jacobson SC, Allbritton NL, Sims CE, Ramsey JM. Anal Chem. 2003;75:5646–5655. doi: 10.1021/ac0346510. [DOI] [PubMed] [Google Scholar]
- 20.Gao J, Yin XF, Fang ZL. Lab Chip. 2004;4:47–52. doi: 10.1039/b310552k. [DOI] [PubMed] [Google Scholar]
- 21.Quinto-Su PA, Lai HH, Yoon HH, Sims CE, Allbritton NL, Venugopalan V. Lab Chip. 2008;8:408–414. doi: 10.1039/b715708h. [DOI] [PMC free article] [PubMed] [Google Scholar]
- 22.Sims CE, Meredith GD, Krasieva TB, Berns MW, Tromberg BJ, Allbritton NL. Anal Chem. 1998;70:4570–4577. doi: 10.1021/ac9802269. [DOI] [PubMed] [Google Scholar]
- 23.Meredith GD, Sims CE, Soughayer JS, Allbritton NL. Nat Biotechnol. 2000;18:309–312. doi: 10.1038/73760. [DOI] [PubMed] [Google Scholar]
- 24.Lai HH, Quinto-Su PA, Sims CE, Bachman M, Li GP, Venugopalan V, Allbritton NL. JR Soc, Interface. 2008;5:S113–S121. doi: 10.1098/rsif.2008.0177.focus. [DOI] [PMC free article] [PubMed] [Google Scholar]
- 25.Phillips KS, Kang KM, Licata L, Allbritton NL. Lab Chip. 2010;10:864–870. doi: 10.1039/b921817c. [DOI] [PMC free article] [PubMed] [Google Scholar]
- 26.Phillips KS, Cheng Q. Anal Chem. 2005;77:327–334. doi: 10.1021/ac049356+. [DOI] [PubMed] [Google Scholar]
- 27.Cunliffe JM, Baryla NE, Lucy CA. Anal Chem. 2002;74:776–783. doi: 10.1021/ac015627u. [DOI] [PubMed] [Google Scholar]
- 28.Phillips KS, Kottegoda S, Kang KM, Sims CE, Allbritton NL. Anal Chem. 2008;80:9756–9762. doi: 10.1021/ac801850z. [DOI] [PMC free article] [PubMed] [Google Scholar]
- 29.Castellana ET, Cremer PS. Surf Sci Rep. 2006;61:429–444. doi: 10.1016/j.surfrep.2006.06.001. [DOI] [PMC free article] [PubMed] [Google Scholar]
- 30.Stroumpoulis D, Zhang HN, Rubalcava L, Gliem J, Tirrell M. Langmuir. 2007;23:3849–3856. doi: 10.1021/la062375p. [DOI] [PubMed] [Google Scholar]
- 31.Malmsten M. J Colloid Interface Sci. 1995;172:106–115. [Google Scholar]
- 32.Hellmich W, Pelargus C, Leffhalm K, Ros A, Anselmetti D. Electrophoresis. 2005;26:3689–3696. doi: 10.1002/elps.200500185. [DOI] [PubMed] [Google Scholar]
- 33.Wang HY, Lu C. Chem Commun. 2006:3528–3530. doi: 10.1039/b605722e. [DOI] [PubMed] [Google Scholar]
- 34.Jorgenson JW, Lukacs KD. Science. 1983;222:266–272. doi: 10.1126/science.6623076. [DOI] [PubMed] [Google Scholar]
- 35.Jiang D, Sims CE, Allbritton NL. Electrophoresis. 31:2558–2565. doi: 10.1002/elps.201000054. [DOI] [PMC free article] [PubMed] [Google Scholar]
- 36.Phillips KS, Dong Y, Carter D, Cheng Q. Anal Chem. 2005;77:2960–2965. doi: 10.1021/ac0500481. [DOI] [PubMed] [Google Scholar]


