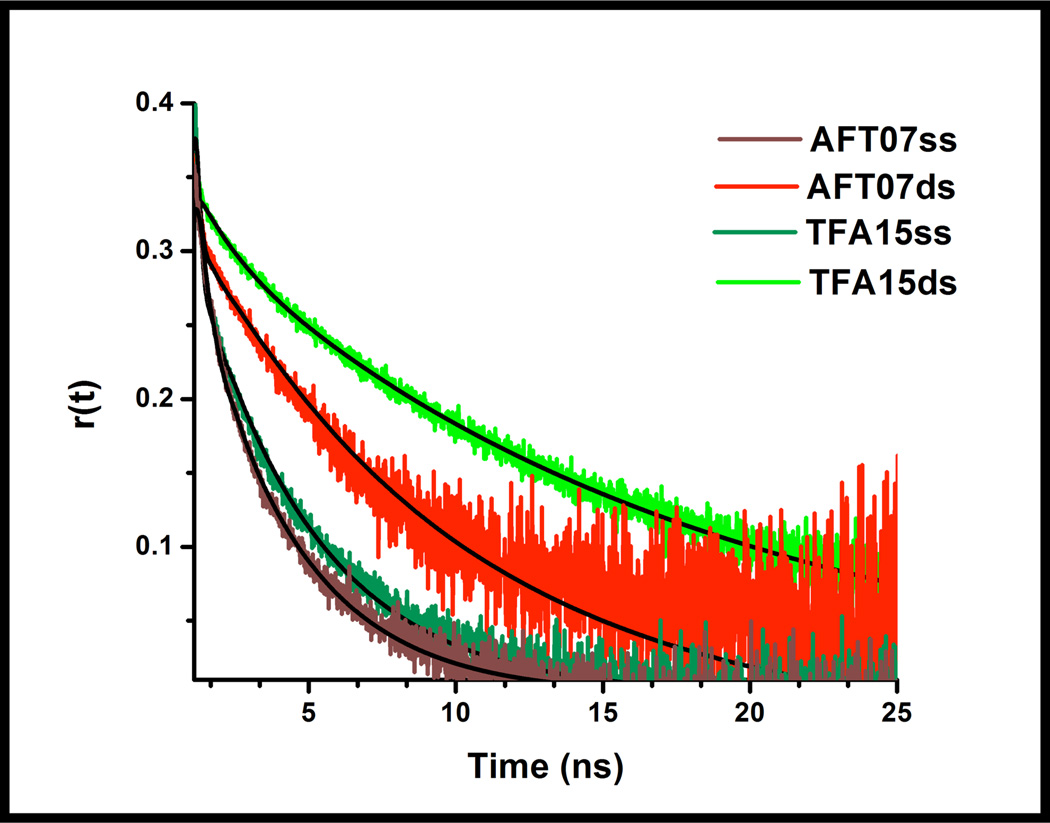
Figure 6.
Time-resolved fluorescence anisotropy decay curves of 6-MI-containing ssDNA and dsDNA molecules. The local motion of 6-MI in the duplex containing the ATFAA sequence (TFA15ds-green) is reduced compared to the AFT07 duplex (red). In general, duplex formation (green, red) leads to slower overall motion of the DNA. The time-resolved anisotropy of ssDNA (dark green, brown) exhibits a bi-exponential decay consisting of significant local motion of 6-MI (~200ps) and overall tumbling of the DNA (~4 ns) (Table 3).

