Abstract
In this manuscript, we have reported a novel 2D fingerprint-based artificial neural network QSAR (FANN-QSAR) method in order to effectively predict biological activities of structurally diverse chemical ligands. Three different types of fingerprints, namely ECFP6, FP2 and MACCS, were used in FANN-QSAR algorithm development, and FANN-QSAR models were compared to known 3D and 2D QSAR methods using five data sets previously reported. In addition, the derived models were used to predict GPCR cannabinoid ligand binding affinities using our manually curated cannabinoid ligand database containing 1699 structurally diverse compounds with reported cannabinoid receptor subtype CB2 activities. To demonstrate its useful applications, the established FANN-QSAR algorithm was used as a virtual screening tool to search a large NCI compound database for lead cannabinoid compounds and we have discovered several compounds with good CB2 binding affinities ranging from 6.70 nM to 3.75 μM. To the best of our knowledge, this is the first report for a fingerprint-based neural network approach validated with a successful virtual screening application in identifying lead compounds. The studies proved that the FANN-QSAR method is a useful approach to predict bioactivities or properties of ligands and to find novel lead compounds for drug discovery research.
Keywords: QSAR, Artificial neural networks, molecular fingerprints, bioactivity prediction, cannabinoid, CB2, virtual screening
Introduction
Quantitative structure-activity/property relationship (QSAR/QSPR) studies correlate chemical or structural features of compounds with their bioactivities or physicochemical properties. Molecular descriptors are used to encode such features and a QSAR model defines mathematical relationships between a set of descriptors and biological endpoints or other properties of known ligands to predict those of unknown ligands. QSAR studies can reduce the costly failures of drug candidates by identifying promising lead compounds and reducing the number of costly experiments. They are regarded as essential tools in pharmaceutical industries to identify and generate high quality leads in the early stages of drug discovery.1–3
Several QSAR methodologies have been developed since the concept was first introduced by Free, Wilson, Hansch and Fujita.4, 5 Traditional 2D-QSAR methods such as Free-Wilson and Hansch-Fujita models use the presence and absence of molecular fragments or ligands' physicochemical properties to perform quantitative predictions. Recently, fragment-based QSAR methods6–8 were introduced to improve and overcome the limitation of traditional QSAR methods. Such fragment-based methods have attracted interests because using molecular fragments in predicting bioactivities or physicochemical properties is simple, fast and robust.1, 6 In addition to 2D QSAR methods, multidimensional (nD) QSAR methods were developed over the past few decades. The first 3D QSAR method, known as comparative molecular field analysis or CoMFA, was introduced by Cramer et al.9 to improve the prediction accuracies of 2D methods. While 3D QSAR methods generally have better predictive power than 2D QSAR methods, their predictive accuracies depend on several factors such as the quality of molecular alignments and information on ligand bioactive conformations. Various methods such as CoMSIA10, SOMFA11, 4D QSAR12, 5D QSAR13 and 6D QSAR14 have been introduced to overcome 3D QSAR problems but many of them still require manual intervention and superimpositions,15, 16 which limits in silico design and virtual screening of large chemical databases.
Artificial neural networks (ANN) have been shown to be an effective tool in solving non-linear problems in several case studies ranging from engineering to biological applications.17–23 ANN have several unique attributes which make them robust for non linear generalization problems with multidimensional inputs. For instance, the networks have adaptive learning behaviors in which they learn from previous examples and adapt to changes in input parameters. In addition, they possess good generalization and pattern recognition property for unseen data. Several studies have used ANN to predict physicochemical and biological properties of chemical analogs. 2D and 3D molecular descriptors of molecular physical properties were used as neural network inputs to predict molecular properties or biological endpoints in several case studies such as anti-diabetes, anti-cancer and anti-HIV research.24–26 However, to the best of our knowledge, there are no studies which use molecular fingerprints as descriptors in developing ANN-QSAR models to predict biological activities (such as pIC50 or pKi) of chemical ligands although there are a few studies reported to predict ligand classes.27, 28 In this work, we used three types of molecular fingerprints to train ANN-QSAR models, namely fingerprint-based ANN-QSAR (FANN-QSAR), and the results were compared to known 2D and 3D QSAR methods using five data sets. As a case study, the FANN-QSAR approach was used to predict cannabinoid receptor binding activities using a large and structurally diverse cannabinoid ligand data set. In fact, cannabinoid drug research is experiencing a great challenge as the first CB1 antagonist drug, Rimonabant, launched in 2006 as an anorectic/anti-obesity drug, was recently withdrawn from the European market due to the complications of suicide and depression side effects.29 As we know, structure-based design of novel CB2 ligands that do not confer psychotropic side effects is hindered because of a lack of information about experimental 3D receptors structures, which is true, in general, for all drug discovery research involving G-protein coupled receptors (GPCRs). Thus, developing ligand-based QSAR approaches has its advantage for new CB2 ligand design and discovery. To prove one of useful applications of the FANN-QSAR model, we have applied it as a virtual screening tool to find new cannabinoid ligands from a large NCI database containing over 200,000 compounds, and we found three compounds with good cannabinoid receptor binding affinities. Our study demonstrated that combination of molecular fingerprints and ANN can lead to a reliable and robust high-throughput virtual screening method which can be a useful tool in computational chemogenomics and computer-aided drug discovery research.
Methods
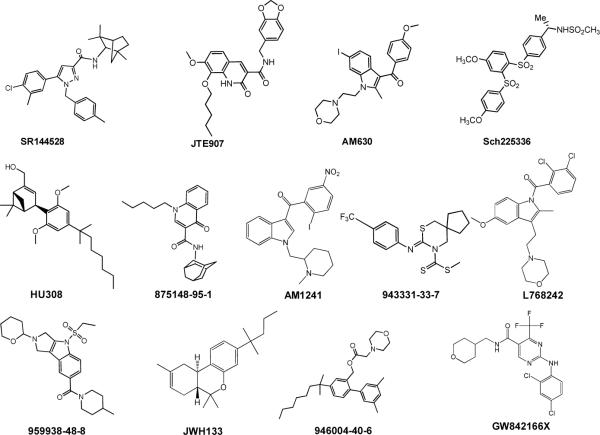
QSAR Data Sets. A total of six data sets were used in this study. Five of them were compiled by Sutherland et al.30 and were downloaded from their supplemental data. The sixth data set was curated by our lab. Data sets are: (1) A set of 114 angiotensin-converting enzymeangiotensis converting enzyme (ACE) inhibitors31 with pIC50 values ranging from 2.1 to 9.9. (2) A set of 111 acetylcholinesterase (AchE) inhibitors32, 33 with pIC50 values ranging from 4.3 to 9.5. (3) A set of 147 ligands for the benzodiazepine receptor (BZR)34 with pIC50 values ranging from 5.5 to 8.9 after removal of 16 inactive compounds with a single pIC50 value of 5.0. (4) A total of 282 cyclooxygenase-2 (COX2) inhibitors35–44 with pIC50 values ranging from 4.1 to 9.0 after removal of 40 inactive COX2 compounds with a single pIC50 value of 4.0. (5) A total of 361 dihydrofolate reductase inhibitors (DHFR) from the work of Queener et al.45–49 with pIC50 ranging from 3.3 to 9.8 after removal of 36 ligands with a single pIC50 value of 3.3. Figure 1 contains representative structures from the above 5 data sets. (6) A set of cannabinoid receptor subtype 2 (CB2) ligands50 with pKi values ranging from 3.9 to 10.8. For the cannabinoid ligand (CBID) dataset, ligand structures and their bioactivities (Ki) were curated by our lab. If there were more than one reported CB2 activity for a ligand, an average activity was used. Figure 2 contains representative CB2 ligands displaying the structural diversity of the data set. For the ACE, AchE, BZR, COX2 and DHFR datasets, we used the same training and testing data sets provided by Sutherland et al. for direct comparisons of FANN-QSAR models to 3D and 2D QSAR models reported by Sutherland et al. For each dataset, 10% of randomly selected compounds from the training set were used as a validation set. For the cannabinoid data set, the training and test sets were randomly divided. The training set contained 80% of compounds while the test set contains 10%. The other 10% were used as a validation set. Numbers of compounds found in each training, validation and test sets for each data set are summarized in Table 1. The training set was used to train the model while the validation set was used to prevent over-fitting of the model. The test set was used as an external set to evaluate the generalization ability of the trained FANN-QSAR models. For statistical modeling, the process was repeated five times resulting in five different pairs of randomly divided training and test sets.
Figure 1.
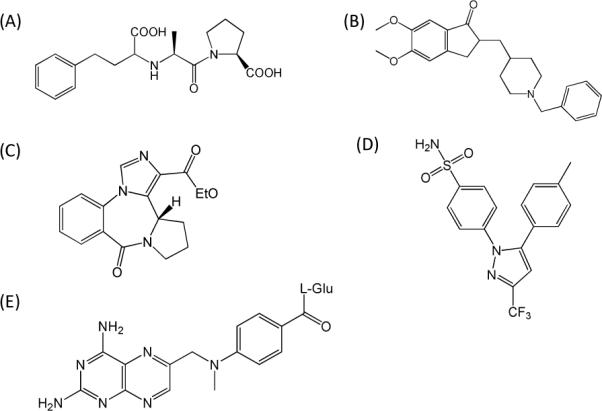
Representative compounds from five QSAR data sets: (A) enalaprat (ACE); (B) E2020 (AchE); (C) Ro14-5974 (BZR); (D) celecoxib (COX2); (E) methotrexate (DHFR).
Figure 2.
Representative CB2 compounds from CBID data set, reflecting the structural diversity of the data set.
Table 1.
Numbers of training, validation and test set compounds in each data set.
| ACE | AchE | BZR | COX2 | DHFR | CB2 | |
|---|---|---|---|---|---|---|
| Training size | 69 | 67 | 89 | 170 | 214 | 1361 |
| Validation size | 7 | 7 | 9 | 18 | 23 | 169 |
| Test size | 38 | 37 | 49 | 94 | 124 | 169 |
|
| ||||||
| Total | 114 | 111 | 147 | 282 | 361 | 1699 |
Fingerprint generation
Three different types of molecular fingerprints, namely FP251, 52, MACCS53 and Extended-Connectivity Fingerprint (ECFP6)54, were used in this study. FP2 is a path-based fingerprint which indexes molecular fragments and MACCS is a key-based fingerprint which uses 166 predefined keys whereas ECFP6 is a circular topological fingerprint which is derived using a variant of the Morgan algorithm.55 FP2 and MACCS fingerprints were generated using the `babel' command from the OpenBabel program51, 52 while ECFP6 fingerprints were generated using the `generatemd' command from the ChemAxon program.56 Ligand chemical structures stored in SDF format were used as inputs to generate fingerprints. For each ligand, polar hydrogens were added using the OpenBabel program51 before fingerprint generations. All fingerprints are fixed-length binary representations with 1024 bits for both ECFP6 and FP2, and 256 bits for MACCS fingerprint. Fingerprints were generated for each ligand in the datasets and used as inputs to train the FANN-QSAR models.
Fingerprint-based Artificial Neural Network QSAR (FANN-QSAR)
A feed-forward back-propagation neural network method was implemented using MATLAB® R2007b Neural Network Toolbox.57 As shown in Figure 3, there are three layers in the network: an input layer, a hidden layer and an output layer. The number of input layer neurons is equal to the size of fingerprint. For example, FP2 and ECFP6 fingerprints have 1024 bits and therefore, the number of input neurons is equal to 1024. Similarly, there are 256 input neurons for MACCS fingerprint. The number of hidden layer neurons was varied between 100 and 1000. The networks were trained using the gradient descent with momentum training function (traingdm) to update weights and biases, the tangent sigmoid transfer function (tansig) for the hidden layer and the linear transfer function (purelin) for the output layer. 10% randomly selected compounds from the training data was used as a validation set to decide when to stop training and to control over-fitting of the model. The model training was stopped after 4000 epochs (iterations) or if the mean-square-error (MSE) of prediction on the training set had reached the minimum value of 0.1. In addition, an early stopping was enabled when the prediction error on the validation set kept increasing for 300 epochs and the weights and biases at the minimum of the validation error were returned. The optimal number of hidden neurons was selected via cross-validation experiments in which the model was trained using different number of hidden neurons and an average of training set and validation set mean squared errors (MSE) was calculated. The number of hidden neurons which gave the lowest average MSE was used as the optimal number for subsequent model testing on the test set. The mean square error (MSE) is defined as:
where T is the total number of training samples; t(i) is the target value of ith sample and p(i) is the predicted value of ith sample.
Figure 3.
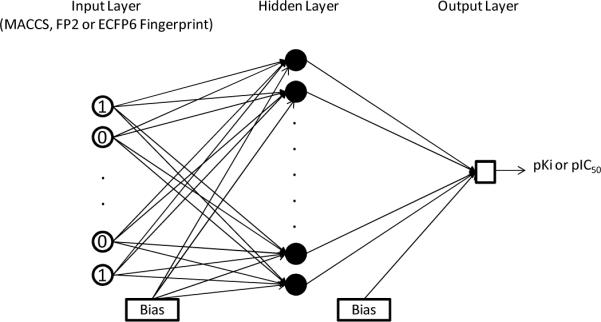
The architecture of fingerprint-based ANN-QSAR (FANN-QSAR) model.
Radioligand competition binding assay
In order to evaluate CB2 binding activity of virtually screened ligands, competition binding assays were performed by displacing radioactive [3H]CP-55940 radioligand. The experimental protocol has been established based on previously reported procedures58–60 and is described briefly below.
Perkin Elmer 96-well TopCounter is used in our laboratory to measure the CB receptor binding affinity (Ki) of the in-silico screened ligands by displacing [3H]CP-55940. In competition binding experiments, ligands were diluted in dilution buffer (50 mM Tris, 5 mM MgCl2, 2.5 mM EGTA) containing 0.1% (w/v) fatty acid free bovine serum albumin (BSA), 10% dimethyl sulfoxide and 0.4% methyl cellulose). Various concentrations of ligands/samples are added in the same volume to 2.5 nM [3H]CP-55940. Incubation buffer (50 mM Tris, 2.5 mM EGTA, 5 mM MgCl2, 0.1% (w/v) fatty acid free BSA) and cell membrane preparations from CHO cells that expressing CB2 receptors (5 μg per well) are added to a final volume of 200 μL. For the saturation binding experiments, varying concentrations of [3H]CP-55940 (0.05–4 nM) with or without 5 μM of an unlabeled known ligand (CP-55940) are incubated with the receptor membrane preparations to determine Kd and nonspecific binding. After the binding suspensions are incubated at 30 °C for 1 hr, the reaction is terminated by rapid filtration through microfiltration plates (Unifilter GF/B filterplate, Perkin Elmer) followed by 5 washes with ice cold TME buffer containing 0.1% BSA on a Packard Filtermate Harvester (Perkin Elmer). The plates are then dried overnight and 30 μl MicroScint 0 scintillation liquid are added to each well of the dried filter plates. Then the bound radioactivity is counted using a Perkin Elmer 96 well TopCounter. The Ki is calculated by using nonlinear regression analysis (Prism 5; GraphPad Software Inc., La Jolla, CA), with the Kd values for [3H]CP-55940 determined from saturation binding experiments. This assay is used for determining binding affinity parameters (Ki) of ligand receptor interactions between the CB2 receptor and ligands.
Results and Discussions
The FANN-QSAR models were first compared to known QSAR methods and then it was used to predict cannabinoid receptor binding activity on structurally diverse data set. Moreover, the generalization ability of the FANN-QSAR model was also examined by predicting activities of newly reported cannabinoid ligands. In addition, it was used as a virtual screening tool to screen large NCI compound database for potential cannabinoid lead ligands and virtual hits were also validated by radioligand competition binding assays.
Comparisons with other 3D and 2D QSAR methods
The performances of the derived FANN-QSAR models were evaluated and compared to the reported 3D and 2D QSAR methods, including CoMFA,9 CoMSIA,10 Hologram QSAR (HQSAR),7, 61 QSAR by eigenvalue analysis (EVA),62 back-propagation feed-forward neural network implemented in Cerius2 using 2.5D descriptors (NN 2.5D) and ensemble neural network63 (NN-ens) using 2.5D descriptors which were implemented and tested by Sutherland et al.30 For an objective comparison, we trained and tested the FANN-QSAR models on the same training and test data sets provided by Sutherland et al. Three different fingerprints were used as inputs for FANN-QSAR models and each model was trained separately for each fingerprint type. During each training process, a cross-validation experiment (see Method section) was performed to decide the optimal number of hidden neurons which was used subsequently on the test set prediction. Cross-validation results can be found in the supplemental information (Figures SF1–SF5).
Final correlation coefficient (r2 train and r2 test) values of each dataset are listed in Table 2. Comparisons of r2 (test) values across all data sets show that ECFP6 fingerprint-based ANN-QSAR model (ECFP6-ANN-QSAR) performed better than FP2 and MACCS fingerprint-based models for all data sets. For ACE, AchE and COX2 data sets, the CoMFA model performed better than ECFP6-ANN-QSAR model but by a small margin. The ECFP6-ANN-QSAR model performed better for the DHFR and BZR datasets. The CoMSIA model performed similarly as the ECFP6-ANN-QSAR model. It is important to note that CoMFA and CoMSIA are field-based 3D QSAR methods which require similar scaffolds and high quality molecular alignments to make effective predictions.64 On the other hand, ECFP6-ANN-QSAR is a fingerprint-based method which works on structurally diverse data sets and requires no alignment during the model training process which makes it more robust in terms of computations required and high-throughput in virtual screening. However, different fingerprints can produce different results and, in our work, ECFP6 produced an overall better result across different data sets compared to FP2 and MACCS fingerprints. In addition to 3D QSAR methods, we also compared ANN-QSAR to another 2D QSAR method known as Hologram QSAR (HQSAR) which is based on molecular holograms containing counts of molecular fragments similar to fingerprints. It can be observed that ECFP6-ANN-QSAR performed consistently better than HQSAR in all datasets except for DHFR dataset resulting in the same r2 test value (0.63). Moreover, we compared our FANN-QSAR approach to other neural network approaches which used 2.5D descriptors as reported by Sutherland et al. ECFP6-ANN-QSAR model performed better than NN (2.5D) method in 3 out of 5 datasets and an ensemble of 10 neural networks (NN-ens) approach using 2.5D descriptors performed slightly better than ECFP6-ANN-QSAR model in 3 out of 5 data sets. It is important to note that all QSAR models failed for COX2 and BZR data sets (r2 test < 0.34) and had moderate performances (r2 test < 0.64) for the other three datasets. Such performances can be explained by the presence of outlier compounds in each test set as reported by Sutherland et al.30 For example, in our ECFP6-ANN-QSAR model we also found two outliers for BZR data set and the r2 test improved to 0.49 after removal of such outliers. Overall, ECFP6-ANN-QSAR model performed consistently across all datasets and its performance was comparable to other 3D, 2D, and neural networks QSAR methods previously reported.
Table 2.
FANN-QSAR performance comparisons with other reported QSAR methods.*
| ECFP6-ANN-QSAR | FP2-ANN-QSAR | MACCS-ANN-QSAR | CoMFA | CoMSIA basic | HQSAR | EVA | NN (2.5D) | NN-ens (2.5D) | |
|---|---|---|---|---|---|---|---|---|---|
| ACE | |||||||||
| r2 train | 0.75 | 0.93 | 0.23 | 0.80 | 0.76 | 0.84 | 0.84 | 0.78 | 0.84 |
| r2 test | 0.41 | 0.20 | 0.08 | 0.49 | 0.52 | 0.30 | 0.36 | 0.39 | 0.51 |
| AchE | |||||||||
| r2 train | 0.94 | 0.57 | 0.62 | 0.88 | 0.86 | 0.72 | 0.96 | 0.68 | 0.63 |
| r2 test | 0.43 | 0.13 | 0.04 | 0.47 | 0.44 | 0.37 | 0.28 | −0.04 | 0.21 |
| BZR | |||||||||
| r2 train | 0.76 | 0.78 | 0.78 | 0.61 | 0.62 | 0.64 | 0.51 | 0.62 | 0.66 |
| r2 test | 0.31 | 0.08 | 0.06 | 0.00 | 0.08 | 0.17 | 0.16 | 0.39 | 0.34 |
| COX2 | |||||||||
| r2 train | 0.73 | 0.76 | 0.89 | 0.70 | 0.69 | 0.70 | 0.68 | 0.65 | 0.65 |
| r2 test | 0.28 | 0.22 | 0.23 | 0.29 | 0.03 | 0.27 | 0.17 | 0.31 | 0.32 |
| DHFR | |||||||||
| r2 train | 0.94 | 0.72 | 0.84 | 0.79 | 0.76 | 0.81 | 0.81 | 0.78 | 0.79 |
| r2 test | 0.63 | 0.43 | 0.48 | 0.59 | 0.52 | 0.63 | 0.57 | 0.42 | 0.54 |
CoMFA, CoMSIA basic, HQSAR, EVA, NN (2.5D) and NN-ens (2.5D) performance indicators were taken from the work of Sutherland et al.30 FANN-QSAR models were trained and tested on the identical training and test sets provided by Sutherland et al. for comparison purposes.
Prediction of Cannabinoid (CB2) receptor binding activity using FANN-QSAR method
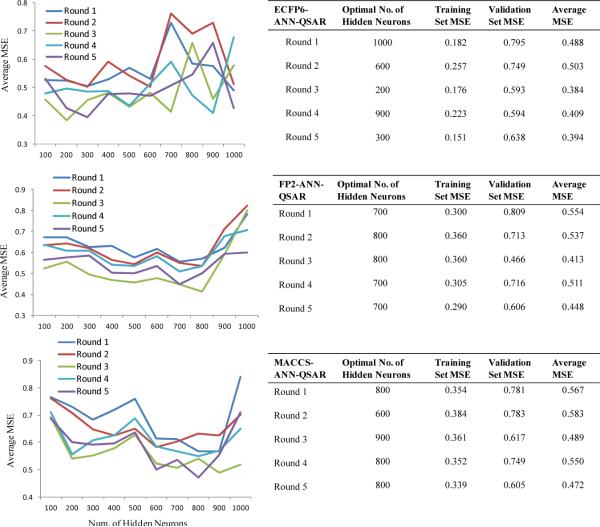
A total of 1699 structurally diverse cannabinoid ligands with reported CB2 binding affinities were used. The ligands were randomly divided into training and test sets. FANN-QSAR models using different fingerprints were trained on training sets and the optimal numbers of hidden neurons were selected via cross-validation. Figure 4 contains a summary of cross-validation results for all three FANN-QSAR models. It can be observed that different training and test sets as well as different types of fingerprints resulted in different optimal number of hidden neuron which suggested that cross-validation experiments are necessary to train neural networks for the best results.
Figure 4.
Cross-validation results of each FANN-QSAR method on CB2 ligand data set.
After such training and parameters tuning, the predictive accuracy of the final model on the test set was evaluated. The process was repeated 5 times and a summary of r2 values from each round of experiment can be seen in Table 3. Within each round, the same training and test compounds were used across all three FANN-QSAR models. As shown in the table, ECFP6-ANN-QSAR model consistently outperformed FP2- and MACCS-ANN-QSAR models in all five rounds of experiments. The ECFP6-ANN-QSAR model achieved an average r2 test value of 0.56 (r = 0.75) across all repeat experiments while 0.48 (r = 0.69) and 0.45 (r = 0.67) for FP2- and MACCS-ANN-QSAR models respectively. Results showed that ECFP6 fingerprint was better than FP2 and MACCS fingerprints for the cannabinoid data set as well as other five data sets. In fact, it has been also reported that circular fingerprints such as ECFP6 fingerprints are found to be more useful in virtual screening and ADMET properties prediction studies.65, 66 Our results suggested that ECFP6 fingerprint-based ANN-QSAR model can be used in virtual screening of chemical ligands in high throughput manner since it only requires 2D fingerprints as inputs instead of 3D molecular alignments and bioactive conformations as in other 3D QSAR methods.
Table 3.
A summary of the performance of each FANN-QSAR model on CB2 ligand data set.
| Round | r2 training | r2 test |
|---|---|---|
| ECFP6-ANN-QSAR | ||
| 1 | 0.86 | 0.55 |
| 2 | 0.81 | 0.63 |
| 3 | 0.87 | 0.53 |
| 4 | 0.84 | 0.56 |
| 5 | 0.89 | 0.54 |
| FP2-ANN-QSAR | ||
| 1 | 0.78 | 0.55 |
| 2 | 0.74 | 0.60 |
| 3 | 0.74 | 0.38 |
| 4 | 0.77 | 0.46 |
| 5 | 0.79 | 0.40 |
| MACCS-ANN-QSAR | ||
| 1 | 0.74 | 0.48 |
| 2 | 0.72 | 0.53 |
| 3 | 0.74 | 0.37 |
| 4 | 0.74 | 0.47 |
| 5 | 0.75 | 0.41 |
Generalization ability of FANN-QSAR method on newly reported cannabinoid ligands
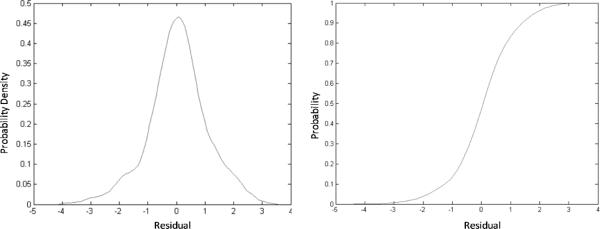
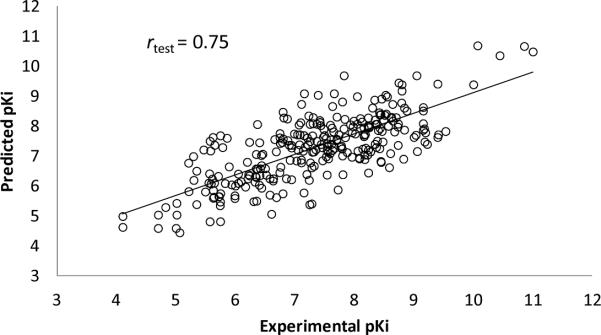
To test the predictive ability of FANN-QSAR method on new cannabinoid compounds which are not in our cannabinoid ligand training data set, we downloaded the most recently reported cannabinoid ligands and associated CB2 binding affinity data from ChEMBL database.67 These compounds were not found in our training (CBID) data set and were collected to be used as a new test set in order to evaluate the FANN-QSAR performance. The new test data set consists of 295 compounds with reported CB2 Ki values which were then converted to pKi values. 41.55% of new CB2 ligands were less than 80% similar (2D Tanimoto similarity) and 25.34% were less than 70% similar to the training compounds. This similarity analysis indicated that the newly reported CB2 compounds contained a good mixture of similar and dissimilar compounds to the training database. As discussed in the Method section, an ECFP6-ANN-QSAR model was trained accordingly using the 1699 CB2 ligand (CBID) data set. 20 independent rounds of training and testing were performed. For each round, randomly selected 90% of the database was used for training and 10% was used for validation. During this exercise, we applied more training rounds, compared to 5 rounds in the previous section, in order to have a better coverage on the diversity of training molecules since the models would be tested on molecules which were not found in our training CBID data set. A summary of training and cross-validation results can be seen in the supplemental table (Table ST1). After 20 rounds of predictions, an average predicted value for each test compound was calculated. Probability density function and cumulative distribution function plots of residual values of test compounds can be seen in Figure 5 indicating the values fall under the Gaussian distribution with the average residual value of 0.046 and standard deviation of 1.03. 17 outlier compounds with residuals more than 2 standard deviations away from the average residual were removed. Figure 6 shows a scatter plot of experimental and predicted pKi values of 278 test compounds after such outlier removal. The linear regression of these 278 data points provided an r of 0.75, slope of 0.686, and Y intercept of 2.249. A plot of these data shown in Figure 7 indicated that there was a good correlation between experimental and predicted values given the fact that many of these test compounds have novel structures and were not included in the model training and validation process. The result suggested that the FANN-QSAR possessed good generalization ability for newly reported cannabinoid ligands.
Figure 5.
Probability density function (left) and cumulative distribution function (right) plots of residual values of 295 newly reported cannabinoid compounds.
Figure 6.
Scatter plot between experimental pKi and predicted pKi values of 278 test cannabinoid ligands after the removal of 17 outliers.
Figure 7.
Experimental and predicted pKi values of 278 test cannabinoid ligands.
An application of FANN-QSAR: virtual screening of NCI compound database for CB2 ligands
To further illustrate a possible application of FANN-QSAR in drug discovery research, we performed a virtual screening experiment on NCI compound database68 to search for CB2 lead ligands. For consistency, we used the same 20 trained models in the previous section. As a test set, compounds from NCI database was used for each round of prediction. Before testing, the database was filtered to remove duplicate compounds, isotopes, metals and mixtures using the Tripos Selector program.61 The NCI database contained 329,089 compounds and after such filtrations it was reduced to 211,782 compounds. For each compound, the ECFP6 fingerprint was generated and used as network inputs to predict the CB2 activity (pKi). After 20 rounds of predictions, an average predicted value for each compound was calculated. The distribution of such predicted values and that of training compounds' activity values were provided in the supplemental data (Figure SF6). Top ranked 50 compounds were selected, but only 10 compounds were available from NCI via material transfer agreement (MTA) and tested for CB2 activities using [3H]CP-55940 competition binding assay experiments as a validation of the method.
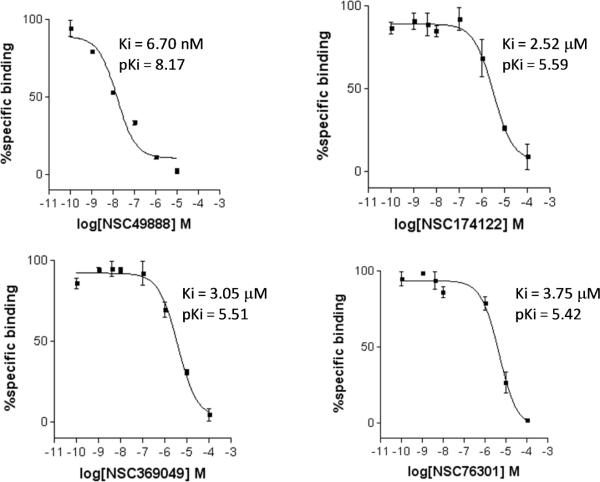
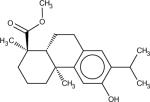
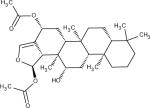
Among 10 tested NCI compounds, four compounds (NSC49888, NSC174122, NSC369049 and NSC76301) had CB2 Ki between 6.70 nM (pKi = 8.17) and 3.80 mM (pKi = 5.42). One compound, which has a similar chemical scaffold as the well-known cannabinoid ligand, delta-9-tetrahydrocannabinol, is found to be a high affinity compound with an average CB2 Ki value of 6.70 nM (pKi = 8.17). These four compounds and other similar compounds (70% 2D Tanimoto similarity threshold was used)69 were not found in the training database which was used to train the model. Among top 50 ligands, there was one NCI compound (NSC768843) which was more than 90% similar (Tanimoto coefficient ≥ 0.9 using FP2 fingerprint) to a known classical cannabinoid ligand (CAS ID: 112830-95-2 or HU210), an analog of delta-9-tetrahydrocannabinol, reported in the literature.70 These findings proved that FANN-QSAR method can find not only novel compounds with good CB2 binding affinities but also compounds similar to known ligands from a testing database containing thousands of compounds with diverse scaffolds. Hit ligands with novel scaffolds can be used as lead compounds for further medicinal chemistry optimization and SAR studies while hits similar to known ligands provide additional information for scaffold hopping and R-group variations which may be useful for medicinal chemists. Table 4 contains molecular structures of NCI hit compounds and their experimental pKi as well as predicted values. Except for one compound (NSC746843) that was not available from NCI, the other four compounds were experimentally tested in our lab and competition binding curves are shown in Figure 8.
Table 4.
ANN-QSAR predicted and experimentally validated hit compounds with CB2 binding activities.
| Structure | NSC ID | MW | ClogP | Predicted pKi | Experimental pKi |
|---|---|---|---|---|---|

|
746843 | 400.55 | 6.61 | 8.66 | 8.81* |
|
49888 | 330.46 | 5.59 | 8.28 | 8.17** |
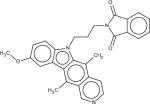
|
174122 | 463.52 | 4.76 | 8.41 | 5.59*** |
|
369049 | 488.66 | 4.00 | 8.48 | 5.51*** |

|
76301 | 354.44 | 3.99 | 8.21 | 5.42*** |
An average literature reported Ki value of a known cannabinoid compound (HU210) which is more than 90% similar to 746843.
An average Ki value of two independent experiments performed in duplicate.
An experimental Ki value of one experiment performed in duplicate.
Figure 8.
CB2 receptor binding affinity Ki values of four NCI hit compounds measured by [3H]CP-55940 radioligand competition binding assay using human CB2 receptors harvested from transfected CHO-CB2 cells.
It should be noted that predicted pKi correlated well with experimental pKi for two of five hit ligands but not for the other three ligands. It could be attributed to the experimental variability of the reported CB2 binding activities of training compounds among different research labs or a possible limitation of 2D fingerprint descriptors which considers individual fragment contributions but sometimes may not be as effective as other 3D descriptors when considering an overall structure of a ligand. However, fingerprints such as ECFP6 have been found to be useful in this study as well as other several cheminformatic studies,65, 66 and they are known to be robust and time efficient for high throughput virtual screening applications. Nevertheless, it is often true that ANN models are harder to interpret compared to other 3D-QSAR models and our ANN model is no exception; however, the strength of our novel approach of combining molecular fingerprints and ANN modeling is that the model can handle hundreds of thousands of ligands with different molecular structures and can perform virtual screening of large databases in less computational time compared to other more computationally intensive 3D-QSAR methods which often are not suitable for virtual screening of large databases since they often require similar scaffolds and molecular alignments for robust predictions. To conclude, results from the virtual screening exercise which was validated experimentally demonstrated that the derived FANN-QSAR model is capable of successfully identifying lead CB2 compounds with good CB2 binding affinities as well as compounds similar to known cannabinoid ligands, and providing additional insights for R-group and scaffold hopping of known ligands.
Conclusions
In this work, we introduced a novel molecular fingerprint-based QSAR algorithm using artificial neural networks approach. Five data sets were used in our studies to compare our developed FANN-QSAR approach to known 3D and 2D QSAR models. The results obtained by FANN-QSAR are comparable to both 3D CoMFA and CoMSIA, and better than HQSAR method for all five data sets. It should be noted that 3D CoMFA and CoMSIA requires knowledge of ligand bioactive conformations and high quality molecule alignments for predictive models whereas the FANN-QSAR model requires only two-dimensional structures for molecular fingerprint generations. The model performance was comparable to other reported QSAR methods such as EVA and neural network approaches using 2.5D descriptors. In addition, we applied the FANN-QSAR model to a large structurally diverse cannabinoid ligand data set to predict CB2 binding activities and achieved an average r (test) value of 0.75. To further evaluate the generalization ability of FANN-QSAR method on unseen cannabinoid ligands, it was tested on a set of 278 newly reported cannabinoid ligands not presented in the training data set and achieved good prediction accuracy. Moreover, to show a useful application of the FANN-QSAR method, it was used to virtually screen NCI compound database and top hits were experimentally validated. We found 4 out of 10 available compounds with good CB2 binding affinities. The lead compounds are currently subjected for further lead chemistry optimization and SAR studies. To conclude, the FANN-QSAR method can be a useful application in computer-aided drug discovery research to predict biological activities or properties of unknown ligands and screen large structurally diverse databases for novel lead discovery.
Supplementary Material
Acknowledgements
The authors from the University of Pittsburgh gratefully acknowledge the financial support for our laboratory from the NIH R01DA025612, R21HL109654 (Xie) and P50GM067082 (Wipf).
K-Z Myint is a predoctoral trainee supported by NIH T32 training grant T32 EB009403 as part of the HHMI-NIBIB Interfaces Initiative under the Joint CMU-Pitt Computational Biology Ph.D. program at the Carnegie Mellon University and University of Pittsburgh.
Footnotes
Supporting Information Cross-validation results and other supplemental data are available free of charge via the Internet at http://pubs.acs.org.
References
- 1.Myint KZ, Xie X-Q. Recent Advances in Fragment-Based QSAR and Multi-Dimensional QSAR Methods. International Journal of Molecular Sciences. 2010;11:3846–3866. doi: 10.3390/ijms11103846. [DOI] [PMC free article] [PubMed] [Google Scholar]
- 2.Perkins R, Fang H, Tong W, Welsh W. Quantitative structure activity relationship methods: perspectives on drug discovery and toxicology. Environ Toxicol Chem. 2003;22:1666–79. doi: 10.1897/01-171. [DOI] [PubMed] [Google Scholar]
- 3.Salum L, Andricopulo A. Fragment-based QSAR: perspectives in drug design. Molecular Diversity. 2009;13:277. doi: 10.1007/s11030-009-9112-5. [DOI] [PubMed] [Google Scholar]
- 4.Free SJ, Wilson J. A mathematical contribution to structure-activity studies. J Med Chem. 1964;7:395–9. doi: 10.1021/jm00334a001. [DOI] [PubMed] [Google Scholar]
- 5.Hansch C, Fujita T. r-s-p Analysis. A method for the correlation of biological activity and chemical structure. J Am Chem Soc. 1964;86:1616–1626. [Google Scholar]
- 6.Myint K-Z, Ma C, Wang L, Xie XQ. Fragment-Similarity-Based QSAR (FS-QSAR) Algorithm for Ligand Biological Activity Predictions. SAR and QSAR in Environmental Research. 2010;22:1–26. doi: 10.1080/1062936X.2011.569943. [DOI] [PubMed] [Google Scholar]
- 7.Lowis D. HQSAR: A New, Highly Predictive QSAR Technique. Tripos Technical Notes. 1997;1:17. [Google Scholar]
- 8.Du Q-S, Huang R-B, Yu-Tuo W, Pang Z-W, Du L-Q, Chou K-C. Fragmentbased quantitative structure-activity relationship (FB QSAR) for fragment based drug design. Journal of Computational Chemistry. 2009;30:295–304. doi: 10.1002/jcc.21056. [DOI] [PubMed] [Google Scholar]
- 9.Cramer R, Patterson D, Bunce J. Comparative molecular field analysis (CoMFA). 1. Effect of shape on binding of steroids to carrier proteins. J Am Chem Soc. 1988;110:5959–5967. doi: 10.1021/ja00226a005. [DOI] [PubMed] [Google Scholar]
- 10.Klebe G. 3D QSAR in Drug Design. 1998. Comparative Molecular Similarity Indices Analysis: CoMSIA; pp. 87–104. [Google Scholar]
- 11.Robinson DD, Winn PJ, Lyne PD, Richards WG. Self-Organizing Molecular Field Analysis: A Tool for Structure-Activity Studies. Journal of Medicinal Chemistry. 1999;42:573–583. doi: 10.1021/jm9810607. [DOI] [PubMed] [Google Scholar]
- 12.Hopfinger AJ, Wang S, Tokarski JS, Jin B, Albuquerque M, Madhav PJ, Duraiswami C. Construction of 3D-QSAR Models Using the 4D-QSAR Analysis Formalism. Journal of the American Chemical Society. 1997;119:10509–10524. [Google Scholar]
- 13.Vedani A, Dobler M. 5D-QSAR: The Key for Simulating Induced Fit? Journal of Medicinal Chemistry. 2002;45:2139–2149. doi: 10.1021/jm011005p. [DOI] [PubMed] [Google Scholar]
- 14.Vedani A, Dobler M, Lill MA. Combining Protein Modeling and 6D-QSAR. Simulating the Binding of Structurally Diverse Ligands to the Estrogen Receptor. Journal of Medicinal Chemistry. 2005;48:3700–3703. doi: 10.1021/jm050185q. [DOI] [PubMed] [Google Scholar]
- 15.Hillebrecht A, Klebe G. Use of 3D QSAR Models for Database Screening: A Feasibility Study. J. Chem. Inf. Model. 2008;48:384–396. doi: 10.1021/ci7002945. [DOI] [PubMed] [Google Scholar]
- 16.Matter H, Potter T. Comparing 3D Pharmacophore Triplets and 2D Fingerprints for Selecting Diverse Compound Subsets. Journal of Chemical Information and Computer Sciences. 1999;39:1211. [Google Scholar]
- 17.Amescua G, Miller D, Alfonso EC. What is causing the corneal ulcer? Management strategies for unresponsive corneal ulceration. Eye. 2011 doi: 10.1038/eye.2011.316. [DOI] [PMC free article] [PubMed] [Google Scholar]
- 18.Cheng F, Yu Y, Shen J, Yang L, Li W, Liu G, Lee PW, Tang Y. Classification of Cytochrome P450 Inhibitors and Noninhibitors Using Combined Classifiers. Journal of Chemical Information and Modeling. 2011;51:996–1011. doi: 10.1021/ci200028n. [DOI] [PubMed] [Google Scholar]
- 19.Jack DA, Schache B, Smith DE. Neural network based closure for modeling short-fiber suspensions. Polymer Composites. 2010;31:1125–1141. [Google Scholar]
- 20.Jung E, Choi S-H, Lee N, Kang S-K, Choi Y-J, Shin J-M, Choi K, Jung D. Machine learning study for the prediction of transdermal peptide. Journal of Computer-Aided Molecular Design. 2011;25:339–347. doi: 10.1007/s10822-011-9424-2. [DOI] [PubMed] [Google Scholar]
- 21.Kaiserman I, Rosner M, Pe'er J. Forecasting the Prognosis of Choroidal Melanoma with an Artificial Neural Network. Ophthalmology. 2005;112:1608.e1–1608.e6. doi: 10.1016/j.ophtha.2005.04.008. [DOI] [PubMed] [Google Scholar]
- 22.Meyer B, Hansen T, Nute D, Albersheim P, Darvill A, York W, Sellers J. Identification of the 1H-NMR spectra of complex oligosaccharides with artificial neural networks. Science. 1991;251:542–544. doi: 10.1126/science.1990429. [DOI] [PubMed] [Google Scholar]
- 23.Parhizgar H, Dehghani MR, Khazaee a., Dalirian M. Application of Neural Networks in Prediction of Surface Tensions of Binary Mixtures. Industrial & Engineering Chemistry Research. 2012 [Google Scholar]
- 24.Vilar S, Santana L, Uriarte E. Probabilistic Neural Network Model for the In Silico Evaluation of Anti-HIV Activity and Mechanism of Action. Journal of Medicinal Chemistry. 2006;49:1118–1124. doi: 10.1021/jm050932j. [DOI] [PubMed] [Google Scholar]
- 25.González Díaz H, Bonet I, Terán C, De Clercq E, Bello R, Garcìa MM, Santana L, Uriarte E. ANN-QSAR model for selection of anticancer leads from structurally heterogeneous series of compounds. European Journal of Medicinal Chemistry. 2007;42:580–585. doi: 10.1016/j.ejmech.2006.11.016. [DOI] [PubMed] [Google Scholar]
- 26.Patra JC, Chua BH. Artificial neural network-based drug design for diabetes mellitus using flavonoids. Journal of Computational Chemistry. 2011;32:555–567. doi: 10.1002/jcc.21641. [DOI] [PubMed] [Google Scholar]
- 27.Molnár L, Keserű GM. A neural network based virtual screening of cytochrome P4503A4 inhibitors. Bioorganic & Medicinal Chemistry Letters. 2002;12:419–421. doi: 10.1016/s0960-894x(01)00771-5. [DOI] [PubMed] [Google Scholar]
- 28.Muresan S, Sadowski J. “In-House Likeness”: Comparison of Large Compound Collections Using Artificial Neural Networks. Journal of Chemical Information and Modeling. 2005;45:888–893. doi: 10.1021/ci049702o. [DOI] [PubMed] [Google Scholar]
- 29.Peng Y, Wang L, Xie X-Q. Latest advances in novel cannabinoid CB(2) ligands for drug abuse and their therapeutic potential. Future Medicinal Chemistry. 2012;4:187–204. doi: 10.4155/fmc.11.179. [DOI] [PMC free article] [PubMed] [Google Scholar]
- 30.Sutherland JJ, O'Brien LA, Weaver DF. A Comparison of Methods for Modeling Quantitative Structure–Activity Relationships. Journal of Medicinal Chemistry. 2004;47:5541–5554. doi: 10.1021/jm0497141. [DOI] [PubMed] [Google Scholar]
- 31.DePriest SA, Mayer D, Naylor CB, Marshall GR. 3D-QSAR of angiotensin converting enzyme and thermolysin inhibitors: a comparison of CoMFA models based on deduced and experimentally determined active site geometries. Journal of the American Chemical Society. 1993;115:5372–5384. [Google Scholar]
- 32.Sugimoto H, Tsuchiya Y, Sugumi H, Higurashi K, Karibe N, Iimura Y, Sasaki A, Araki S, Yamanishi Y, Yamatsu K. Synthesis and structure-activity relationships of acetylcholinesterase inhibitors: 1-benzyl-4-(2-phthalimidoethyl)piperidine, and related derivatives. Journal of Medicinal Chemistry. 1992;35:4542–4548. doi: 10.1021/jm00102a005. [DOI] [PubMed] [Google Scholar]
- 33.Sugimoto H, Tsuchiya Y, Sugumi H, Higurashi K, Karibe N, Iimura Y, Sasaki A, Kawakami Y, Nakamura T. Novel piperidine derivatives. Synthesis and antiacetylcholinesterase activity of 1-benzyl-4-[2-(N-benzoylamino)ethyl]piperidine derivatives. Journal of Medicinal Chemistry. 1990;33:1880–1887. doi: 10.1021/jm00169a008. [DOI] [PubMed] [Google Scholar]
- 34.Haefely W, Kyburz E, Gerecke M, Mohler H. Recent advances in the molecular pharmacology of benzodiazepine receptors and in the structure-activity relationships of their agonists and antagonists. Adv. Drug Res. 1985;14:165–322. [Google Scholar]
- 35.Chavatte P, Yous S, Marot C, Baurin N, Lesieur D. Three-Dimensional Quantitative Structure–Activity Relationships of Cyclo-oxygenase 2 (COX-2) Inhibitors: A Comparative Molecular Field Analysis. Journal of Medicinal Chemistry. 2001;44:3223–3230. doi: 10.1021/jm0101343. [DOI] [PubMed] [Google Scholar]
- 36.Talley JJ, Brown DL, Carter JS, Graneto MJ, Koboldt CM, Masferrer JL, Perkins WE, Rogers RS, Shaffer AF, Zhang YY, Zweifel BS, Seibert K. 4-[5-Methyl-3-phenylisoxazol-4-yl]- benzenesulfonamide, Valdecoxib: A Potent and Selective Inhibitor of COX-2. Journal of Medicinal Chemistry. 2000;43:775–777. doi: 10.1021/jm990577v. [DOI] [PubMed] [Google Scholar]
- 37.Huang H-C, Li JJ, Garland DJ, Chamberlain TS, Reinhard EJ, Manning RE, Seibert K, Koboldt CM, Gregory SA, Anderson GD, Veenhuizen AW, Zhang Y, Perkins WE, Burton EG, Cogburn JN, Isakson PC, Reitz DB. Diarylspiro[2.4]heptenes as Orally Active, Highly Selective Cyclooxygenase-2 Inhibitors: Synthesis and Structure–Activity Relationships. Journal of Medicinal Chemistry. 1996;39:253–266. doi: 10.1021/jm950664x. [DOI] [PubMed] [Google Scholar]
- 38.Penning TD, Talley JJ, Bertenshaw SR, Carter JS, Collins PW, Docter S, Graneto MJ, Lee LF, Malecha JW, Miyashiro JM, Rogers RS, Rogier DJ, Yu SS, Anderson GD, Burton EG, Cogburn JN, Gregory SA, Koboldt CM, Perkins WE, Seibert K, Veenhuizen AW, Zhang YY, Isakson PC. Synthesis and Biological Evaluation of the 1,5-Diarylpyrazole Class of Cyclooxygenase-2 Inhibitors: Identification of 4-[5-(4-Methylphenyl)-3- (trifluoromethyl)-1H-pyrazol-1-yl]benzenesulfonamide (SC-58635, Celecoxib) Journal of Medicinal Chemistry. 1997;40:1347–1365. doi: 10.1021/jm960803q. [DOI] [PubMed] [Google Scholar]
- 39.Li JJ, Norton MB, Reinhard EJ, Anderson GD, Gregory SA, Isakson PC, Koboldt CM, Masferrer JL, Perkins WE, Seibert K, Zhang Y, Zweifel BS, Reitz DB. Novel Terphenyls as Selective Cyclooxygenase-2 Inhibitors and Orally Active Anti-inflammatory Agents. Journal of Medicinal Chemistry. 1996;39:1846–1856. doi: 10.1021/jm950878e. [DOI] [PubMed] [Google Scholar]
- 40.Li JJ, Anderson GD, Burton EG, Cogburn JN, Collins JT, Garland DJ, Gregory SA, Huang H-C, Isakson PC. 1,2-Diarylcyclopentenes as Selective Cyclooxygenase-2 Inhibitors and Orally Active Anti-inflammatory Agents. Journal of Medicinal Chemistry. 1995;38:4570–4578. doi: 10.1021/jm00022a023. [DOI] [PubMed] [Google Scholar]
- 41.Reitz DB, Li JJ, Norton MB, Reinhard EJ, Collins JT, Anderson GD, Gregory SA, Koboldt CM, Perkins WE. Selective Cyclooxygenase Inhibitors: Novel 1,2-Diarylcyclopentenes Are Potent and Orally Active COX-2 Inhibitors. Journal of Medicinal Chemistry. 1994;37:3878–3881. doi: 10.1021/jm00049a005. [DOI] [PubMed] [Google Scholar]
- 42.Khanna IK, Yu Y, Huff RM, Weier RM, Xu X, Koszyk FJ, Collins PW, Cogburn JN, Isakson PC, Koboldt CM, Masferrer JL, Perkins WE, Seibert K, Veenhuizen AW, Yuan J, Yang D-C, Zhang YY. Selective Cyclooxygenase-2 Inhibitors: Heteroaryl Modified 1,2-Diarylimidazoles Are Potent, Orally Active Antiinflammatory Agents. Journal of Medicinal Chemistry. 2000;43:3168–3185. doi: 10.1021/jm0000719. [DOI] [PubMed] [Google Scholar]
- 43.Khanna IK, Weier RM, Yu Y, Xu XD, Koszyk FJ, Collins PW, Koboldt CM, Veenhuizen AW, Perkins WE, Casler JJ, Masferrer JL, Zhang YY, Gregory SA, Seibert K, Isakson PC. 1,2-Diarylimidazoles as Potent, Cyclooxygenase-2 Selective, and Orally Active Antiinflammatory Agents. Journal of Medicinal Chemistry. 1997;40:1634–1647. doi: 10.1021/jm9700225. [DOI] [PubMed] [Google Scholar]
- 44.Khanna IK, Weier RM, Yu Y, Collins PW, Miyashiro JM, Koboldt CM, Veenhuizen AW, Currie JL, Seibert K, Isakson PC. 1,2-Diarylpyrroles as Potent and Selective Inhibitors of Cyclooxygenase-2. Journal of Medicinal Chemistry. 1997;40:1619–1633. doi: 10.1021/jm970036a. [DOI] [PubMed] [Google Scholar]
- 45.Gangjee A, Vidwans AP, Vasudevan A, Queener SF, Kisliuk RL, Cody V, Li R, Galitsky N, Luft JR, Pangborn W. Structure-Based Design and Synthesis of Lipophilic 2,4-Diamino-6-Substituted Quinazolines and Their Evaluation as Inhibitors of Dihydrofolate Reductases and Potential Antitumor Agents1. Journal of Medicinal Chemistry. 1998;41:3426–3434. doi: 10.1021/jm980081y. [DOI] [PubMed] [Google Scholar]
- 46.Rosowsky A, Mota CE, Wright JE, Queener SF. 2,4-Diamino-5-chloroquinazoline Analogs of Trimetrexate and Piritrexim: Synthesis and Antifolate Activity. Journal of Medicinal Chemistry. 1994;37:4522–4528. doi: 10.1021/jm00052a011. [DOI] [PubMed] [Google Scholar]
- 47.Rosowsky A, Cody V, Galitsky N, Fu H, Papoulis AT, Queener SF. Structure-Based Design of Selective Inhibitors of Dihydrofolate Reductase: Synthesis and Antiparasitic Activity of 2,4-Diaminopteridine Analogues with a Bridged Diarylamine Side Chain. Journal of Medicinal Chemistry. 1999;42:4853–4860. doi: 10.1021/jm990331q. [DOI] [PubMed] [Google Scholar]
- 48.Graffner-Nordberg M, Kolmodin K, Åqvist J, Queener SF, Hallberg A. Design, Synthesis, Computational Prediction, and Biological Evaluation of Ester Soft Drugs as Inhibitors of Dihydrofolate Reductase from Pneumocystis carinii. Journal of Medicinal Chemistry. 2001;44:2391–2402. doi: 10.1021/jm010856u. [DOI] [PubMed] [Google Scholar]
- 49.Gangjee A, Elzein E, Queener SF, McGuire JJ. Synthesis and Biological Activities of Tricyclic Conformationally Restricted Tetrahydropyrido Annulated Furo[2,3-d]pyrimidines as Inhibitors of Dihydrofolate Reductases1. Journal of Medicinal Chemistry. 1998;41:1409–1416. doi: 10.1021/jm9705420. [DOI] [PubMed] [Google Scholar]
- 50.Wang L, Xie XQ. Cannabinoid Ligand Database. 2011 Nov; www.cbligand.org/cbid.
- 51.Open Babel. (version 2.3.0) 2011 Nov; http://openbabel.org.
- 52.O'Boyle N, Banck M, James C, Morley C, Vandermeersch T, Hutchison G. Open Babel: An open chemical toolbox. Journal of Cheminformatics. 2011;3:33. doi: 10.1186/1758-2946-3-33. [DOI] [PMC free article] [PubMed] [Google Scholar]
- 53.Durant JL, Leland BA, Henry DR, Nourse JG. Reoptimization of MDL Keys for Use in Drug Discovery. Journal of Chemical Information and Computer Sciences. 2002;42:1273–1280. doi: 10.1021/ci010132r. [DOI] [PubMed] [Google Scholar]
- 54.Rogers D, Hahn M. Extended-Connectivity Fingerprints. Journal of Chemical Information and Modeling. 2010;50:742–754. doi: 10.1021/ci100050t. [DOI] [PubMed] [Google Scholar]
- 55.Morgan HL. The Generation of a Unique Machine Description for Chemical Structures-A Technique Developed at Chemical Abstracts Service. Journal of Chemical Documentation. 1965;5:107–113. [Google Scholar]
- 56.ChemAxon. 2011 Nov; http://www.chemaxon.com.
- 57.Matlab. (Version 7.5.0.342) (R2007b); http://www.mathworks.com/products/matlab/
- 58.Gertsch J, Leonti M, Raduner S, Racz I, Chen J-Z, Xie X-Q, Altmann K-H, Karsak M, Zimmer A. Beta-caryophyllene is a dietary cannabinoid. Proceedings of the National Academy of Sciences. 2008;105:9099–9104. doi: 10.1073/pnas.0803601105. [DOI] [PMC free article] [PubMed] [Google Scholar]
- 59.Raduner S, Majewska A, Chen J-Z, Xie X-Q, Hamon J, Faller B, Altmann K-H, Gertsch J. Alkylamides from Echinacea Are a New Class of Cannabinomimetics: cannabinoid type 2 receptor-dependent and -independent immunomodulatory effects. Journal of Biological Chemistry. 2006;281:14192–14206. doi: 10.1074/jbc.M601074200. [DOI] [PubMed] [Google Scholar]
- 60.Zhang Y, Xie Z, Wang L, Schreiter B, Lazo JS, Gertsch J, Xie X-Q. Mutagenesis and computer modeling studies of a GPCR conserved residue W5.43(194) in ligand recognition and signal transduction for CB2 receptor. International Immunopharmacology. 2011;11:1303–1310. doi: 10.1016/j.intimp.2011.04.013. [DOI] [PMC free article] [PubMed] [Google Scholar]
- 61.SYBYL-X 1.2. South Hanley Rd.; St. Louis, Missouri: USA: 1699. 63144. www.tripos.com. [Google Scholar]
- 62.Ferguson AM, Heritage T, Jonathon P, Pack SE, Phillips L, Rogan J, Snaith PJ. EVA: A new theoretically based molecular descriptor for use in QSAR/QSPR analysis. Journal of Computer-Aided Molecular Design. 1997;11:143–152. doi: 10.1023/a:1008026308790. [DOI] [PubMed] [Google Scholar]
- 63.Agrafiotis DK, Cedeño W, Lobanov VS. On the Use of Neural Network Ensembles in QSAR and QSPR. Journal of Chemical Information and Computer Sciences. 2002;42:903–911. doi: 10.1021/ci0203702. [DOI] [PubMed] [Google Scholar]
- 64.Chen J-Z, Han X-W, Liu Q, Makriyannis A, Wang J, Xie X-Q. 3D-QSAR Studies of Arylpyrazole Antagonists of Cannabinoid Receptor Subtypes CB1 and CB2. A Combined NMR and CoMFA Approach. Journal of Medicinal Chemistry. 2005;49:625–636. doi: 10.1021/jm050655g. [DOI] [PubMed] [Google Scholar]
- 65.Bender A, Jenkins JL, Scheiber J, Sukuru SCK, Glick M, Davies JW. How Similar Are Similarity Searching Methods? A Principal Component Analysis of Molecular Descriptor Space. Journal of Chemical Information and Modeling. 2009;49:108–119. doi: 10.1021/ci800249s. [DOI] [PubMed] [Google Scholar]
- 66.Glem R, Bender A, Arnby C, Carlsson L, Boyer S, Smith J. Circular fingerprints: flexible molecular descriptors with applications from physical chemistry to ADME. IDrugs. 2006;9:199–204. [PubMed] [Google Scholar]
- 67.Bellis LJ, Akhtar R, Al-Lazikani B, Atkinson F, Bento AP, Chambers J, Davies M, Gaulton A, Hersey A, Ikeda K, Kruger FA, Light Y, McGlinchey S, Santos R, Stauch B, Overington JP. Collation and data-mining of literature bioactivity data for drug discovery. Biochem Soc Trans. 2011;39:1365–70. doi: 10.1042/BST0391365. [DOI] [PubMed] [Google Scholar]
- 68.Drug Synthesis and Chemistry Branch, Developmental Therapeutics Program (DTP), Division of Cancer Treatment and Diagnosis, National Cancer Institute; http://dtp.nci.nih.gov/ [Google Scholar]
- 69.Xie X-Q, Chen J-Z. Data Mining a Small Molecule Drug Screening Representative Subset from NIH PubChem. Journal of Chemical Information and Modeling. 2008;48:465–475. doi: 10.1021/ci700193u. [DOI] [PubMed] [Google Scholar]
- 70.Huffman JW, Yu S, Showalter V, Abood ME, Wiley JL, Compton DR, Martin BR, Bramblett RD, Reggio PH. Synthesis and Pharmacology of a Very Potent Cannabinoid Lacking a Phenolic Hydroxyl with High Affinity for the CB2 Receptor. Journal of Medicinal Chemistry. 1996;39:3875–3877. doi: 10.1021/jm960394y. [DOI] [PubMed] [Google Scholar]
Associated Data
This section collects any data citations, data availability statements, or supplementary materials included in this article.


