

Summary
Carbohydrate-binding antibodies play a critical role in basic and clinical research. Monoclonal antibodies that bind glycans are used to measure carbohydrate expression, and serum antibodies to glycans can be important elements of the immune response to pathogens and vaccines. Carbohydrate antigen arrays, or glycan arrays, have emerged as powerful tools for the high-throughput analysis of carbohydrate-protein interactions. Our group has focused on the development and application of neoglycoprotein arrays, a unique array format wherein carbohydrates are covalently attached to a carrier protein prior to immobilization on the surface. The neoglycoprotein format permits variations of glycan structure, glycan density, and neoglycoprotein density on a single array. The focus of this study was on the effects of neoglycoprotein density on antibody binding. First, we evaluated binding of five monoclonal antibodies (81FR2.2, HE-195, HE-193, B480, and Z2A) to the blood group A antigen and found that neoglycoprotein density had a substantial effect on recognition. Next, we profiled serum antibodies in 15 healthy individuals and showed that inclusion of multiple neoglycoprotein densities helps distinguish different subpopulations of antibodies. Finally, we evaluated immune responses induced by a prostate cancer vaccine and showed that variations in neoglycoprotein density enable one to detect antibody responses that could not be detected otherwise. Neoglycoprotein density is a useful element of diversity for evaluating antibody recognition and, when combined with variations in glycan structure and glycan density, provides multidimensional glycan arrays with enhanced performance for monoclonal antibody development, biomarker discovery, and vaccine optimization.
Keywords: Carbohydrate microarray, glycan array, multivalency, antibody, cancer vaccine
Introduction
Antibodies are a key element of the immune response, and serum antibody levels are frequently used for the diagnosis of diseases, such as HIV and autoimmune diseases. In addition, antibody responses are critical for most vaccines, and they are routinely monitored to assess the effectiveness of vaccines and optimize their performance. In basic research, monoclonal and polyclonal antibodies have become indispensable tools for studying biology. For these reasons, methods to measure antibody levels in serum and evaluate affinity and specificity of antibody reagents are critical for both basic research and clinical applications.
Antigen arrays provide a high-throughput approach to examine binding to numerous potential antigens in parallel.1, 2 These arrays contain many different molecules, such as proteins, peptides, and carbohydrates, immobilized on a solid support in a spatially-defined arrangement. Antigen arrays have become valuable tools for profiling the repertoire of antibodies in serum and this technology has been applied to basic research, antigen discovery, and vaccine development. Although the large number of antigens included on the arrays can detect many binding events, serum contains a complex mixture of antibodies, and many of them have overlapping specificities. As a result, the observed signal for any antigen on the array is a composite value from an ensemble of molecularly distinct antibodies that bind the same antigen. Therefore, potentially important changes may not be apparent when increased levels of a particular antibody or subpopulation are offset by a decrease in another subpopulation. A high concentration of a competing antibody, moreover, may mask changes in clinically significant, but rare, subpopulations. Methods that discriminate between different antibodies or antibody subpopulations that bind the same antigen would expand the information provided by antibody profiling and make antigen arrays more useful for vaccine development and biomarker discovery.
One form of antigen array that has become increasingly important are glycan arrays.3–7 Our group has focused on the development and application of neoglycoprotein arrays, a specialized glycan array format.8–10 Prior to immobilization on the array surface, glycans are covalently attached to a carrier protein, such as albumin, to form neoglycoproteins. Neoglycoproteins have been used for many years as reagents to study carbohydrate recognition, as multivalent inhibitors of carbohydrate-protein interactions, and as immunogens.11 In addition, the neoglycoprotein format allows one to vary glycan presentation in novel ways. By varying glycan structure and presentation, one can produce arrays with multiple dimensions of diversity, or multidimensional glycan arrays. We have previously described methods to vary both the glycan density and the neoglycoprotein density on the array surface.12, 13 In this paper, we evaluate the effects of neoglycoprotein density on antibody binding. We show that different monoclonal antibodies that bind the same carbohydrate antigen are affected by neoglycoprotein density in unique ways. In addition, we show that variations in neoglycoprotein density reveal distinct subpopulations of serum antibodies and, importantly, are required for detecting the full spectrum of antibody responses to a cancer vaccine.
Results and Discussion
Antibodies possess multiple binding sites and are capable of forming high avidity, multivalent complexes with antigens. To obtain a multivalent complex, however, the spacing and orientation of the antigens/epitopes is critical. Therefore, both the ligand structure and the mode of multivalent presentation contribute to recognition. Multivalency is especially important for certain classes of antigens, such as carbohydrates, which typically are bound only weakly in a monovalent interaction.14 Presentation, however, does not affect all antibodies equally. For example, IgM antibodies are much larger than IgG antibodies and are capable of spanning a larger distance between epitopes. In addition, different antibodies can recognize distinct epitopes on an antigen or different orientations of the same epitope. Therefore, we reasoned that variations in antigen presentation might be used to distinguish different antibodies that bind the same antigen. Features of presentation, such as ligand density and multivalent architecture, are known to have a significant effect on affinity and specificity of carbohydrate-protein interactions (for some examples, see15–21). Therefore, variations in antigen presentation might be especially useful for distinguishing unique subpopulations of glycan-binding antibodies.
Our early versions of the neoglycoprotein array primarily contained variations in glycan structure. More recently, we have developed several methods for varying presentation of neoglycoproteins on a glycan array surface. Glycan density can be varied by modulating the average number of glycans per molecule of albumin.12 Neoglycoprotein density can be varied by mixing neoglycoproteins with differing amounts of unmodified BSA and printing these mixtures on the array surface.13 As the proportion of BSA increases, the neoglycoproteins become spaced farther apart (see Figure 1). The focus of this study was to evaluate the effects of neoglycoprotein density on antibody binding.
Figure 1.
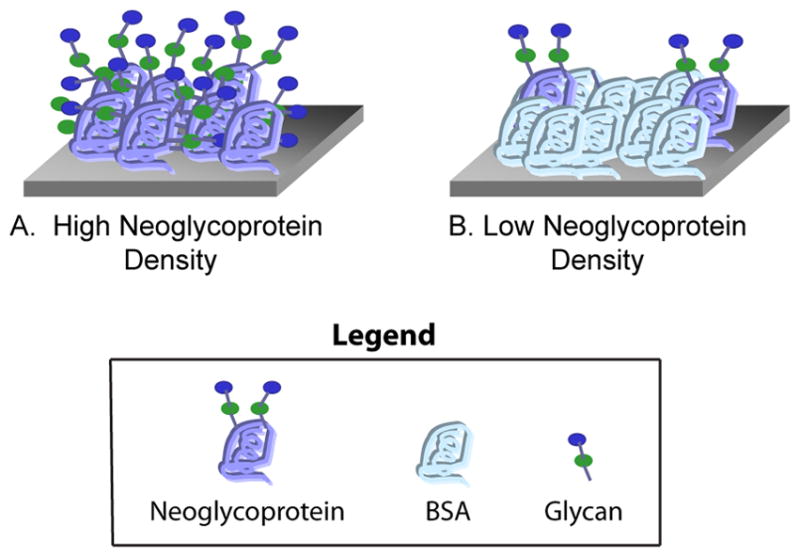
Depiction of High and Low Neoglycoprotein Density on the Array Surface. Neoglycoproteins are combined with varying amounts of unmodified bovine serum albumin (BSA) and then printed on the array surface. A) The highest neoglycoprotein density contains no added BSA. B) As the proportion of BSA increases, the neoglycoproteins are spaced farther apart on the surface.
The neoglycoprotein array used in this study was fabricated as previously described.12, 13, 22 Briefly, 147 different neoglycoproteins and glycoproteins were mixed with BSA at ratios of 1:0 (no BSA), 1:1, 1:3, and 1:7 to give 588 combinations of neoglycoprotein structure and density. Three controls were included for a total of 591 array components. The array contained a variety of oligosaccharides derived from O-linked glycans, N-linked glycans, glycolipids, and milk oligosaccharides. Structures of selected glycans can be found in Figure 2, and a full list of array components can be found in the Supporting Information (Table S2). The protein solutions were printed on epoxide-coated glass microscope slides using a robotic microarrayer to produce the arrays.
Figure 2.
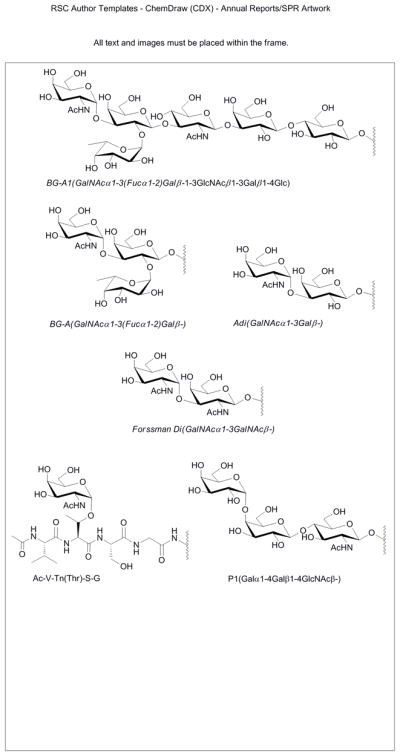
Structures of Selected Glycans.
Effects of neoglycoprotein density on monoclonal antibody binding
The blood group A antigen (BG-A; see Figure 2) is a carbohydrate structure found on the surface of red blood cells that is a key determinant of the ABO blood typing system. Antibodies to BG-A are present in the serum of individuals with type B and type O blood, and these antibodies cause complications when individuals with B and O blood types are transfused with type A blood. BG-A is also expressed on other tissues, and expression can be altered in certain disease states, such as cancer.23, 24 Evaluation of BG-A expression has primarily been achieved with the use of monoclonal antibodies, and a number of them are commercially available. Comprehensive information on antibody specificity is critical for proper interpretation of biological studies with these reagents. In particular, it is essential to know which glycans are recognized by the antibody and in what contexts. Glycan arrays offer a simple, high-throughput means to assess specificity, and a number of BG-A antibodies have been profiled on glycan arrays.8, 25 While these studies have provided extensive information on the selectivity of these antibodies with regards to carbohydrate structure, little is known about the effects of variations in presentation.
For this study, five commercially-available monoclonal antibodies to the BG-A antigen were studied: 81FR2.2, HE-195, HE-193, B480, and Z2A. These antibodies have been used in a number of biological studies (for some recent examples, see 26–29), but, to the best of our knowledge, the productions and characterizations have not be published. Some information on specificity is provided by the commercial suppliers, but additional information regarding specificity could be useful for interpreting previous results and future studies. Each antibody was evaluated on the array at a series of concentrations, and the apparent Kd values were determined (see Table 1). As expected, all of the antibodies were found to bind tightly to the BG-A and BG-A1 antigens (see Figure 2). Some differences between the antibodies could be observed without varying the neoglycoprotein density (i.e. without mixing in unmodified BSA). For example, additional reactivity for the BG-A disaccharide (Adi) was also observed for HE-195, Z2A, and B480. In addition, Z2A reacted with the terminal disaccharide of the Forssman antigen (Forssman Di), the clustered form of the Tn antigen, and BG-B (data not shown). These results were somewhat different than expected based on their known specificity. For example, reactivity of Z2A with the Forssman antigen and the clustered Tn antigen were not previously reported. These other reactivities could significantly influence results of immunohistochemical staining or other biological assays.
Table 1.
Apparent Kd values for the BG-A monoclonal antibodies.
| Ligand | Density ratio | 81FR2.2 | Apparent Kd values (nM)a | B480 | ||
|---|---|---|---|---|---|---|
| HE-193 | HE-195 | Z2A | ||||
| Adi-04 | 1:0 | - | - | - | 0.69±0.31 | 0.92±0.17 |
| 1:1 | - | - | - | 2.0±1.0 | NDa | |
| 1:3 | - | - | - | NDa | NDa | |
| 1:7 | - | - | - | NDa | NDa | |
| Adi-17 | 1:0 | - | NDa | 0.56±0.24 | 0.20±0.02 | 0.18±0.03 |
| 1:1 | - | - | 1.1±0.6 | 0.37±0.10 | 0.66±0.29 | |
| 1:3 | - | - | NDa | 0.78±0.30 | 1.8±0.4 | |
| 1:7 | - | - | NDa | 1.4±0.6 | NDa | |
| BG-A | 1:0 | 0.80±0.25 | 0.31±0.04 | 0.066±0.021 | 0.11±0.01 | 0.03±0.003 |
| 1:1 | 4.7±1.0 | 0.80±0.09 | 0.15±0.03 | 0.15±0.01 | 0.06±0.02 | |
| 1:3 | 8.3±2.6 | 1.9±0.5 | 0.18±0.05 | 0.22±0.03 | 0.11±0.02 | |
| 1:7 | 18±11 | 2.6±3.3 | 0.21±0.10 | 0.28±0.05 | 0.17±0.03 | |
| BG-A1 | 1:0 | 0.6±0.16 | 0.32±0.03 | 0.061±0.019 | 1.2±0.2 | 0.04±0.01 |
| 1:1 | 7.2±3.0 | 3.0±1.2 | 0.12±0.03 | 2.6±0.3 | 0.12±0.03 | |
| 1:3 | 3.1±2.7 | 1.1±0.4 | 0.12±0.05 | 4.6±1.0 | 0.39±0.11 | |
| 1:7 | 11±2 | NDa | 0.22±0.06 | 5.5±1.6 | 0.34±0.11 | |
| Forssman Di-04 | 1:0 | - | - | - | 0.42±0.14 | - |
| 1:1 | - | - | - | 0.95±0.44 | - | |
| 1:3 | - | - | - | 2.5±1.5 | - | |
| 1:7 | - | - | - | NDa | - | |
| Forssman Di-21 | 1:0 | - | - | - | 0.15±0.01 | - |
| 1:1 | - | - | - | 0.23±0.03 | - | |
| 1:3 | - | - | - | 0.35±0.06 | - | |
| 1:7 | - | - | - | 0.45±0.12 | - | |
ND indicates that the antibody did bind but the affinity was too weak to determine the app Kd. “-” = no binding.
Several additional differences were uncovered when antibody binding was compared at lower neoglycoprotein densities. For example, antibodies HE-195 and Z2A had almost no loss in avidity to BG-A as the neoglycoprotein density was decreased. In contrast, 82FR2.2 had a 22-fold loss in apparent avidity for BG-A at the lowest density (1:7). Thus, the presentation can have a significant effect on recognition. The effects of neoglycoprotein density were even larger for some of the cross-reactive glycans. For example, Z2A bound to Adi-17 at both low and high density (app Kd = 0.2 nM for 1:0; app Kd = 1.4 nM for 1:7). Antibody B480, however, only bound Adi-17 at high neoglycoprotein density; no binding was observed at low density. Interestingly, variations in neoglycoprotein density could have distinct effects for different antigens bound by the same antibody. For example, HE-195 bound tightly to BG-A at both low and high neoglycoprotein density. In contrast, it only bound to the high density spots of Adi-17 (app Kd = 0.56 nM for 1:0; no binding at 1:7). These results highlight the importance of antigen presentation for recognition, and they stress the need to consider antigen context when interpreting results in various biological assays, such as immunohistochemical staining of tissue samples. Although the neoglycoproteins contain non-natural linkages between the carbohydrate moieties and the protein core, they are similar in size, shape, and glycan content as many naturally-occurring glycoproteins. Therefore, the differences in binding observed on the array may reflect preferences for certain glycoprotein densities in natural systems, such as on a cell surface.
Effects of neoglycoprotein density on serum antibody profiles
The effects observed for the five BG-A antibodies suggested that neoglycoprotein density could be a critical feature of recognition for many other glycan-binding antibodies. If so, inclusion of multiple neoglycoprotein densities on the array surface could help distinguish different subpopulations of antibodies in complex mixtures, such as human serum. To evaluate this possibility, we profiled human serum samples from 15 healthy subjects at a dilution of 1:50, and antibody binding was detected using DyLight 549 conjugated goat anti-human IgM and DyLight 649 conjugated goat anti-human IgG. Using this approach, IgG and IgM could be detected separately in a single experiment.
Differences between individuals were clearly visible even without varying the neoglycoprotein density; however, inclusion of lower neoglycoprotein density spots on the array provided additional information that was not otherwise apparent. In general, antibody signals for a given array component were typically smallest at the lowest neoglycoprotein density. The decrease in signal intensity was not equally proportional for each individual, though. For example, subjects 6, 8, 9, and 10 all had similar IgM levels to AcV-Tn(Thr)-S-G-19 at high neoglycoprotein density. At low density, however, subjects 6, 8, and 9 had a large decrease in binding to the glycopeptide while subject 10 had only a modest decrease. As a result, subject 10 could easily be distinguished from the other three at low density (see Figure 3A, high vs low density). Although all four individuals have serum IgM antibodies that recognize the same glycopeptide, the binding requirements and preferences based on glycan presentation are quite distinct.
Figure 3.

Serum Antibody Binding to Selected Glycans. Serum antibodies were profiled in 15 healthy subjects (see Experimental for details). A) IgM signals to the glycopeptide, AcV-Tn(Thr)-S-G-19 (average of 19 glycopeptides per molecule of BSA) at high neoglycoprotein density (top) and low (bottom). B) IgG signals to the P1 antigen at high neoglycoprotein density (top) and low (bottom). Error bars represent the standard deviations over 4 spots on 2 different arrays.
Differences based on neoglycoprotein density were also observed for IgG antibodies. For example, subjects 10, 11, 14, and 15 each had similar signals for the P1 antigen at high neoglycoprotein density (see Figure 3B). At low density, however, subject 10 had significantly higher signals. It should be noted that these are just two of many examples where high and low neoglycoprotein densities showed distinct differences.
In addition to examining specific array components, the microarray data can also be viewed collectively to generate a profile for each individual. By comparing profiles, one can group individuals based on their overall degree of similarity and identify features that are shared within a group. One common method for evaluating microarray data is principal component analysis (PCA), a statistical tool for identifying patterns within a large database and representing data in a manner that highlights similarities and differences between samples. Briefly, PCA simplifies large amounts of data by describing data in terms of the strongest correlations among the observed variables (referred to as principal components). PCA was used to compare serum antibody profiles of healthy subjects obtained with high and low density arrays, and the results are shown in Figure 4. In the graphs, each sample is represented by a sphere whose three-dimensional position represents the entire array data for that sample. Distances between spheres are proportional to the similarity of the corresponding samples, with nearby spheres representing more similar samples, whereas distant spheres represent less similar samples.
Figure 4.

Principal Component Analysis (PCA) of Sera from Healthy Subjects. PCA provides a graphical overview of similarities and differences among serum antibody profiles of 15 healthy subjects. Analyses of IgG antibodies on high and low density antigen arrays are shown in panels A and B, respectively. Similarly, binding of IgM antibodies was also measured on high (C) and low (D) density antigen arrays. Graphs were generated by projecting array data onto the top three principal components (PC) that account for the most variation between samples for each experiment. Percentage values above each graph indicate the amount of variation between samples represented by the top three PCs.
As shown in Figure 4, the relationships between individuals were quite different when evaluated at high and low neoglycoprotein density. For example, the majority of individuals were grouped together when PCA was applied to the IgG signals at high density (see Figure 4A). In contrast, there was more dispersion of individuals at low neoglycoprotein density (Figure 4B). Specific individuals also showed considerable differences in relative positions. For example, subject 2 was found to be fairly similar to most other subjects at high density but was easily distinguished from the others at low density. Differences between high and low density were also observed for IgM antibody profiles. For example, subjects 9 and 10 were found to be similar at high density but were quite distinct at low density.
A second method for evaluating microarray profiles is hierarchical clustering. Since different information content causes samples to cluster differently, hierarchical clustering provides another way for visually comparing the information obtained with different array techniques. The results of hierarchical clustering are summarized by dendrograms in the Supporting Information (Figures S1 and S2). Like the principal component analysis, clustering produced different relationships when evaluated at high and low neoglycoprotein density. For example, the most similar individuals at high density based on IgG signals were subjects 6 and 7, followed by 12 and 15. At low density, subjects 4 and 6 were most similar, followed by 7 and 12. Taken together, the principal component analysis and hierarchical clustering show that the groupings and relative similarities between individuals are highly influenced by neoglycoprotein density, and the ability to examine profiles at multiple neoglycoprotein densities reveals relationships between individuals that could not have otherwise been detected.
Evaluation of antibody responses to a cancer vaccine
One of the most exciting applications for antigen arrays involves profiling immune responses induced by vaccination (for some examples, see30–33). Antibodies can play an important role in the effectiveness of vaccines, and the ability to detect the full spectrum of induced antibodies could be useful for improving antigen design, selecting an appropriate adjuvant, and optimizing doses and schedules of immunizations. Array technology allows one to measure changes in antibody levels to a wide variety of potential antigens. Based on the results for the monoclonal antibodies and serum, we postulated that inclusion of multiple neoglycoprotein densities on an array might provide a more comprehensive analysis of antibody responses to vaccines.
One cancer vaccine that shows tremendous promise for the treatment of prostate cancer is the PROSTVAC-VF vector-based vaccine. The vaccine is composed of an initial vaccination with a recombinant vaccinia virus containing the human genes for prostate specific antigen (PSA) and three co-stimulatory molecules (B7.1, LFA-3, and ICAM-1), followed by booster injections with a fowlpox virus with the same four transgenes.34, 35 The vaccine is designed to stimulate an immune response to prostate tumor cells, which express high levels of PSA. The vaccine has been evaluated in several phase I and phase II clinical trials with excellent results,36–42 and phase III trials are in preparation. Although the vaccine is not specifically a carbohydrate-based cancer vaccine, cancer vaccines to individual antigens can trigger broader responses to other cancer antigens, a process which is referred to as “antigen cascade” or “antigen spreading”.42–46 Antigen spreading has been correlated with improved survival for some vaccines,43–46 and a glycan array would provide an opportunity to evaluate responses to a broad range of potential antigens.
We evaluated serum from 6 patients prior to their first immunization and 3 months after immunization with the PROSTVAC-VF vaccine.36 We have previously found that human antibody levels within an individual are highly stable over periods of 3 months.22 Based on that study, we determined that changes greater than 2.6-fold were statistically significant (i.e. beyond what would be expected for experimental variability and temporal biological variability). Therefore, we focused on changes that were greater than 2.6-fold for this study. It should be noted, however, that our original study on temporal variability was conducted on healthy volunteers. Therefore, this threshold does not take into account changes that might occur as a result of generally improving or worsening health for cancer patients. Nevertheless, this was the most reasonable cutoff based on our information at the time.
A number of changes were detected using the glycan array, and many of these changes were much larger than the 2.6-fold threshold. The most frequent response was to the Forssman antigen. This glycan is a common structure found on mammalian cells, but expression in humans is a matter of debate. There is some evidence that it can be expressed on tumors, but a functioning Forssman synthase gene has not been identified. Therefore, these responses may be directed at glycans found on the vaccine components, which were produced in animal cells. Interestingly, neoglycoprotein density had a major effect on the observed responses. For example, patients 2 and 5 had increases in IgG to the Forssman disaccharide when measured at high density (see Figure 5A); however, many more changes were detectable when multiple neoglycoprotein densities were included in the analysis. For example, patients 2, 3, 4, and 5 all had significant increases in IgG to the Forssman antigen when all neoglycoproteins were considered (see Figure 5B). In addition to the number of patients with measurable changes, the magnitude of those changes was much larger. For example, patient 5 had an 11-fold increase in IgG when measured at high density but had a 108-fold increase when measured at low density. Similar trends were observed for IgM responses. More responses were detectable when all densities were included, and the magnitude of those changes was larger. For example, patient 2 had an 8-fold increase in IgM when measured at high density but a 72-fold increase when measured at low density. The differences measured at high and low density most likely reflect large increases in certain subpopulations of antibodies that bind the same antigen but have different presentation requirements. At high density, these changes are obscured by signals arising from other competing populations of antibodies. At low density, however, only select subsets are able to bind, and there are fewer competing antibodies.
Figure 5.

IgG Responses to the Forssman Disaccharide. Antibody levels were measured prior to and 3 months after vaccination with a prostate cancer vaccine. For the 6 patients, changes were graphed for a) the highest neoglycoprotein density, and b) all of the neoglycoprotein densities for Forssman Di – 04. Error bars represent the standard deviations over 4 spots on 2 different arrays.
Changes in antibody levels were observed for many other glycans, including tumor-associated carbohydrate antigens, but the responses varied considerably from person to person. As with the responses to the Forssman antigen, neoglycoprotein density had a major effect on the measured response. For example, patient 1 showed no significant change in IgM antibody levels to Man8D1D3 at high density (1:0) but showed a 28-fold increase in antibodies when evaluated at a density of 1:3. Interestingly, inclusion of multiple neoglycoprotein densities provided better detection of the immune responses to tumor antigens, too. For example, only patient 2 had a significant IgM response to the tumor-associated TF peptide, AcS-TF(Ser)-S-G-16, when measured at high density. In contrast, significant changes could also be detected in patients 1, 4, 5, and 6 when all neoglycoprotein densities were included in the analysis. Thus, the ability to vary neoglycoprotein density enables one to detect responses to tumor antigens that would not otherwise have been discovered.
Although the changes observed to various tumor antigens are consistent with antigen spreading, we cannot yet verify this. In particular, these responses could potentially be directed at glycans present on various components of the vaccine. In particular, the vaccinia and fowlpox viruses are both foreign vectors and could induce responses. Nevertheless, our results are encouraging and indicate that additional studies are warranted.
Experimental
General methods
Unless otherwise stated, reagents were purchased from commercial suppliers and used without purification. All aqueous solutions were prepared from Milli-Q water with a 0.2 μm filter. Bovine serum albumin (BSA) and human serum albumin (HSA, Cat. No. A8763) were purchased from Sigma (St. Louis, MO). Mouse anti-Blood A monoclonal antibodies, HE-193 (IgM) and HE-195 (IgM), were purchased from GeneTex (Irvine, CA). Mouse anti-Blood A monoclonal antibodies, Z2A (IgM) and B480 (IgG1), were purchased from Santa Cruz Biotechnology (Santa Cruz, CA). Mouse anti-Blood A monoclonal antibody 81FR2.2 (IgM) was purchased from Dako (Glostrup, Denmark). Cy3-labeled goat anti-mouse IgG+IgM (H+L), DyLight 549 conjugated affinipure goat anti-human IgM and DyLight 649 conjugated affinipure goat anti-human IgG were purchased from Jackson ImmunoResearch (West Grove, PA).
Carbohydrate Microarray Fabrication
The carbohydrate doping microarrays were printed following the previously described procedures.12, 22 Fluorophore-labeled BSA and neoglycoconjugates were diluted in printing buffer [1× phosphate buffered solution (PBS, 137 mM NaCl, 3 mM KCl, 10 mM Na2HPO4, 1.8 mM KH2PO4, pH 7.4), 2.5% glycerol, 0.006% Triton-X 100] to a concentration of 125 μg/mL. Then 15 μL of solution was transferred to wells of a 384-well V-bottom sample plate. Protein samples were printed on epoxide-coated ArrayIt SuperEpoxy 2 Protein microarray slides, purchased from TeleChem International, Inc. (Sunnyvale, CA), by a Biorobotics MicroGrid II 600/610, Genomic Solution robotic microarray (Ann Arbor, MI), using 946 Microspotting Pins (ArrayIt, Sunnyvale, CA). The printing spot size was 110 μm. The humidity level in the arraying chamber was maintained at ~40%–50% during the printing. Printed slides were stored at −20 °C until use.
For the large array, 147 neoglycoproteins and glycoproteins were mixed with BSA at ratios of 1:0, 1:1, 1:3, and 1:7 to give 588 combinations. BSA, Cy3-BSA, and Cy5-BSA were included as controls to give a total of 591 different array samples. Each sample was printed in duplicate. Six array pins were used to print eight replicate array blocks on each slide.
Analysis of monoclonal antibody binding on the doping array
Doping microarray slides were assembled with an 8-well slide holder (Grace Bio-Labs, Inc, Bend, OR). All slides were blocked with 3% BSA/PBS at r.t. for 2.0 h before experiments. Dilution series of monoclonal antibodies were prepared in 3% BSA/TMST0.05 (20 mM Tris, 150 mM NaCl, 2 mM CaCl2, 2 mM MgCl2, 0.05% Tween 20, pH 7.4) in a range from 1:20 to 1:10,240. 200 μL of the monoclonal antibodies solutions was added to each well, covered tightly with seal strips and incubated at 37 °C for 2.0 h. After washing unbound antibodies with 4×400 μL of TMST0.05, goat anti-mouse Cy3-IgG+IgM(H+L) in 1% BSA/TMS (1:200, 2.5 μg/mL, 200 μL/well) was added and incubated at r.t. for 2.0 h. All slides were washed with 4×400 μL of TMST0.05 and tapped dry, removed from the holder, and immersed into TMST0.05 buffer for 10 min. Slides were dried by centrifuging at 1000 rpm for 5 min.
Slides were scanned using a Genepix 4000A microarray scanner at 10 μm resolution (Molecular Devices Corporation, Union City, CA) at a PMT voltage setting of 440 at 532 nm and 632 nm. Images were analyzed with Genepix Pro 6.0 analysis software (Molecular Devices Corporation). Spots were defined as circular features of 100 μm. The features were resized manually as needed. The background-corrected mean (F532mean-B532) was used for data analysis. Fluorescence data for each spot for a given neoglycoprotein or glycoprotein was averaged. The apparent Kd values were determined following the method of MacBeath.47 The mean was plotted with the concentration of antibodies on a logarithmic scale and a nonlinear curve was fitted using Origin 8.0 (OriginLab, Northampton, MA) according to the equation below:
where Fc is the fluorescent intensity for the lectin binding at any specific concentration, Fmax is the maximum intensity, Kd is the apparent dissociation constant of the antibody for the neoglycoprotein on the array, and [A] is the concentration of antibody.
Analysis of human serum binding on the doping array
Doping microarray slides were assembled with an 8-well slide holder (Grace Bio-Labs, Inc, Bend, OR). All slides were blocked with 3% BSA/PBS at r.t. for 2.0 h before experiments. Human serum samples were prepared in 3% BSA/TMST0.05 in a dilution of 1:50. 200 μL of the human serum solutions was added to each well, covered tightly with seal strips and incubated at 37 °C for 2.0 h. After washing unbound antibodies with 4×400 μL of TMST0.05, DyLight 549 conjugated goat anti-human IgM and DyLight 649 conjugated goat anti-human IgG in 3% HSA and 1% BSA/TMS (1:1, 1:500, 200 μL/well) was added and incubated at r.t. for 2.0 h. All slides were washed with 4×400 μL of TMST0.05 and tapped dry, removed from the holder, and immersed into TMST0.05 buffer for 10 min. Slides were dried by centrifuging at 1000 rpm for 5 min.
Slides were scanned using a Genepix 4000A microarray scanner at 10 μm resolution (Molecular Devices Corporation, Union City, CA) at a PMT voltage setting of 440 at 532 nm and 632 nm. Images were analyzed with Genepix Pro 6.0 analysis software (Molecular Devices Corporation). Spots were defined as circular features of 100 μm. The features were resized manually as needed. The background-corrected mean (F532mean-B532) and (F632mean-B632) were used for data analysis. Fluorescence data from all spots for a given neoglycoprotein or glycoprotein was averaged.
Statistical Analysis
Principal component analysis and hierarchical clustering were performed in Partek Discovery Suite (Partek Inc., St. Louis Mo.) The correlation method was used as the dispersion method to generate figures summarizing PCA results. The Euclidean distance was used as similarity metric when clustering samples.
Conclusion
Antibodies and the majority of lectins possess multiple binding sites and are capable of forming high avidity, multivalent complexes with glycans. To form a multivalent interaction, however, the spacing and orientations of glycans must be appropriately matched to the binding sites. Therefore, both structure and presentation are critical features of recognition. In nature, glycans can be displayed in a variety of contexts. Glycolipids can be dispersed throughout a cell membrane or can be localized at higher densities, such as in lipid rafts. Glycoproteins can be found free in solution or associated with the cell membrane. When membrane bound, glycoproteins can be presented at high or low local densities. Currently, there are no methods available to control the expression of a specific glycan on a cell surface (without affected expression of others) or to control the local presentation of a glycan. In contrast, a higher degree of control over glycan structure and presentation can be asserted in model systems, such as a glycan array. These model systems, therefore, offer the opportunity to evaluate the effects of glycan structure and presentation on recognition in ways that cannot be accomplished with natural systems.
Our group has focused on the development of neoglycoprotein arrays for the high-throughput evaluation of carbohydrate-macromolecule interactions. In addition to varying glycan structure, the neoglycoprotein format provides unique approaches to vary glycan presentation. In this study, we show that neoglycoprotein density has a major impact on antibody recognition. With monoclonal antibodies, variations in neoglycoprotein density revealed differences in specificity for antibodies that were not apparent at a single density. These distinct binding properties can lead to different outcomes in various biological studies, such as immunohistochemical staining of tissue samples. Therefore, they should be taken into consideration when interpreting previously published studies and analyzing new results with these reagents.
Variations in neoglycoprotein density are also useful for distinguishing different subpopulations of antibodies in human serum. Thus, it provides a more comprehensive profile of the antibody repertoire, a feature that is useful for identifying antibody-based biomarkers and studying similarities and differences between individuals. The ability to discriminate between different subpopulations of serum antibodies is also valuable for monitoring immune responses induced by vaccines. Variations in neoglycoprotein density can uncover changes induced by a cancer vaccine that could not have been detected otherwise. In addition, the ability to evaluate binding at multiple neoglycoprotein densities allows one to better assess the true magnitude of the antibody response. For these reasons, variations of neoglycoprotein densities are a useful element of diversity to include on neoglycoprotein arrays. By combining variations in neoglycoprotein density with other diversity elements, such as glycan structure and glycan density, one can obtain multidimensional glycan arrays with enhanced performance for measuring antibody specificity, profiling serum antibodies, and detecting immune responses to vaccines.
Supplementary Material
Acknowledgments
We thank Dr. Jeffrey Schlom and Dr. James Gulley for the generous gift of serum samples. This research was supported by the Intramural Research Program of the NIH, NCI, and by the NIGMS through a Pharmacology Research Associate Training (PRAT) fellowship (CTC).
Footnotes
Supporting Information Available. Summary of the antibodies used in the study, full list of array components and their abbreviations, dendrograms of the hierarchical clustering, and full array data.
References
- 1.Casiano CA, Mediavilla-Varela M, Tan EM. Mol Cell Proteomics. 2006;5:1745–1759. doi: 10.1074/mcp.R600010-MCP200. [DOI] [PMC free article] [PubMed] [Google Scholar]
- 2.Robinson WH. Curr Opin Chem Biol. 2006;10:67–72. doi: 10.1016/j.cbpa.2005.12.028. [DOI] [PubMed] [Google Scholar]
- 3.Wu CY, Liang PH, Wong CH. Org Biomol Chem. 2009;7:2247–2254. doi: 10.1039/b902510n. [DOI] [PubMed] [Google Scholar]
- 4.Song EH, Pohl NLB. Curr Opin Chem Biol. 2009;13:626–632. doi: 10.1016/j.cbpa.2009.09.021. [DOI] [PubMed] [Google Scholar]
- 5.Oyelaran O, Gildersleeve JC. Curr Opin Chem Biol. 2009;13:406–413. doi: 10.1016/j.cbpa.2009.06.021. [DOI] [PMC free article] [PubMed] [Google Scholar]
- 6.Liu Y, Palma AS, Feizi T. Biol Chem. 2009;390:647–656. doi: 10.1515/BC.2009.071. [DOI] [PubMed] [Google Scholar]
- 7.Park S, Lee MR, Shin I. Chem Comm. 2008:4389–4399. doi: 10.1039/b806699j. [DOI] [PubMed] [Google Scholar]
- 8.Manimala JC, Roach TA, Li Z, Gildersleeve JC. Glycobiology. 2007;17:17C–23C. doi: 10.1093/glycob/cwm047. [DOI] [PubMed] [Google Scholar]
- 9.Manimala JC, Roach TA, Li ZT, Gildersleeve JC. Angew Chem Int Ed. 2006;45:3607–3610. doi: 10.1002/anie.200600591. [DOI] [PubMed] [Google Scholar]
- 10.Manimala J, Li Z, Jain A, VedBrat S, Gildersleeve JC. ChemBioChem. 2005;6:2229–2241. doi: 10.1002/cbic.200500165. [DOI] [PubMed] [Google Scholar]
- 11.Wong SYC. Curr Opin Struct Biol. 1995;5:599. doi: 10.1016/0959-440x(95)80050-6. [DOI] [PubMed] [Google Scholar]
- 12.Oyelaran OO, Li Q, Farnsworth DF, Gildersleeve JC. J Proteome Res. 2009;8:3529–3538. doi: 10.1021/pr9002245. [DOI] [PMC free article] [PubMed] [Google Scholar]
- 13.Zhang Y, Li Q, Rodriguez LG, Gildersleeve JC. 2010 submitted. [Google Scholar]
- 14.Mammen M, Choi SK, Whitesides GM. Angew Chem Int Ed Engl. 1998;37:2755. doi: 10.1002/(SICI)1521-3773(19981102)37:20<2754::AID-ANIE2754>3.0.CO;2-3. [DOI] [PubMed] [Google Scholar]
- 15.Gestwicki JE, Cairo CW, Strong LE, Oetjen KA, Kiessling LL. J Am Chem Soc. 2002;124:14922–14933. doi: 10.1021/ja027184x. [DOI] [PubMed] [Google Scholar]
- 16.Mortel KH, Weatherman RV, Kiessling LL. J Am Chem Soc. 1996;118:2297. [Google Scholar]
- 17.Gomez-Garcia M, Benito JM, Rodriguez-Lucena D, Yu JX, Chmurski K, Ortiz Mellet C, Gutierrez Gallego R, Maestre A, Defaye J, Garcia Fernandez JM. J Am Chem Soc. 2005;127:7970–7971. doi: 10.1021/ja050934t. [DOI] [PubMed] [Google Scholar]
- 18.Horan N, Yan L, Isobe H, Whitesides GM, Kahne D. Proc Natl Acad Sci USA. 1999;96:11782. doi: 10.1073/pnas.96.21.11782. [DOI] [PMC free article] [PubMed] [Google Scholar]
- 19.Basu A, Kahne D. Angew Chem Int Ed. 2003;42:2504–2506. doi: 10.1002/anie.200250859. [DOI] [PubMed] [Google Scholar]
- 20.Woller EK, Walter ED, Morgan JR, Singel DJ, Cloninger MJ. J Am Chem Soc. 2003;125:8820–8826. doi: 10.1021/ja0352496. [DOI] [PubMed] [Google Scholar]
- 21.Brewer CF, Miceli MC, Baum LG. Curr Opin Struct Biol. 2002;12:616–623. doi: 10.1016/s0959-440x(02)00364-0. [DOI] [PubMed] [Google Scholar]
- 22.Oyelaran O, McShane LM, Dodd L, Gildersleeve JC. J Proteome Res. 2009;8:4301–4310. doi: 10.1021/pr900515y. [DOI] [PMC free article] [PubMed] [Google Scholar]
- 23.Hakomori SI. Biochim Biophys Acta. 1999;1473:247–266. doi: 10.1016/s0304-4165(99)00183-x. [DOI] [PubMed] [Google Scholar]
- 24.Le Pendu J, Marionneau S, Cailleau-Thomas A, Rocher J, Le Moullac-Vaidye B, Clement M. APMIS. 2001;109:9–31. doi: 10.1111/j.1600-0463.2001.tb00011.x. [DOI] [PubMed] [Google Scholar]
- 25.Several BG-A mAbs, including HH4 and 2C9, have been screened by the Consortium for Functional Glycomics and binding data can be found at http://www.functionalglycomics.org/glycomics/publicdata/primaryscreen.jsp.
- 26.Cohen M, Hurtado-Ziola N, Varki A. Blood. 2009;114:3668–3676. doi: 10.1182/blood-2009-06-227041. [DOI] [PMC free article] [PubMed] [Google Scholar]
- 27.Gustafsson A, Kacskovics I, Breimer ME, Hammarstrom L, Holgersson J. Glycoconj J. 2005;22:109–118. doi: 10.1007/s10719-005-0356-8. [DOI] [PubMed] [Google Scholar]
- 28.Molne J, Bjorquist P, Andersson K, Diswall M, Jeppsson A, Strokan V, Rydberg L, Breimer ME. Transplantation. 2008;86:1407–1413. doi: 10.1097/TP.0b013e31818a6805. [DOI] [PubMed] [Google Scholar]
- 29.Chihara Y, Sugano K, Kobayashi A, Kanai Y, Yamamoto H, Nakazono M, Fujimoto H, Kakizoe T, Fujimoto K, Hirohashi S, Hirao Y. Lab Investigation. 2005;85:895–907. doi: 10.1038/labinvest.3700268. [DOI] [PubMed] [Google Scholar]
- 30.Davies DH, Wyatt LS, Newman FK, Earl PL, Chun S, Hernandez JE, Molina DM, Hirst S, Moss B, Frey SE, Felgner PL. J Virol. 2008;82:652–663. doi: 10.1128/JVI.01706-07. [DOI] [PMC free article] [PubMed] [Google Scholar]
- 31.Doolan DL, Mu Y, Unal B, Sundaresh S, Hirst S, Valdez C, Randall A, Molina D, Liang X, Freilich DA, Oloo JA, Blair PL, Aguiar JC, Baldi P, Davies DH, Felgner PL. Proteomics. 2008;8:4680–4694. doi: 10.1002/pmic.200800194. [DOI] [PMC free article] [PubMed] [Google Scholar]
- 32.Davies DH, Liang X, Hernandez JE, Randall A, Hirst S, Mu Y, Romero KM, Nguyen TT, Kalantari-Dehaghi M, Crotty S, Baldi P, Villarreal LP, Felgner PL. Proc Natl Acad Sci. 2005;102:547–552. doi: 10.1073/pnas.0408782102. [DOI] [PMC free article] [PubMed] [Google Scholar]
- 33.De Vegvar HEN, Amara RR, Steinman L, Utz PJ, Robinson HL, Robinson WH. J Virol. 2003;77:11125–11138. doi: 10.1128/JVI.77.20.11125-11138.2003. [DOI] [PMC free article] [PubMed] [Google Scholar]
- 34.Garnett CT, Greiner JW, Tsang KY, Kudo-Saito C, Grosenbach DW, Chakraborty M, Gulley JL, Arlen PM, Schlom J, Hodge JW. Curr Pharm Design. 2006;12:351–361. doi: 10.2174/138161206775201929. [DOI] [PubMed] [Google Scholar]
- 35.Madan RA, Mohebtash M, Schlom J, Gulley JL. Exp Opin Biol Therap. 2010;10:19–28. doi: 10.1517/14712590903321421. [DOI] [PMC free article] [PubMed] [Google Scholar]
- 36.Gulley JL, Arlen PM, Madan RA, Tsang KY, Pazdur MP, Skarupa L, Jones JL, Poole DJ, Higgins JP, Hodge JW, Cereda V, Vergati M, Steinberg SM, Halabi S, Jones E, Chen C, Parnes H, Wright JJ, Dahut WL, Schlom J. Cancer Immunol Immunother. 2009 epub ahead of print. [Google Scholar]
- 37.Lechleider RJ, Arlen PM, Tsang KY, Steinberg SM, Yokokawa J, Cereda V, Camphausen K, Schlom J, Dahut WL, Gulley JL. Clin Cancer Res. 2008;14:5284–5291. doi: 10.1158/1078-0432.CCR-07-5162. [DOI] [PMC free article] [PubMed] [Google Scholar]
- 38.Madan RA, Gulley JL, Schlom J, Steinberg SM, Liewehr DJ, Dahut WL, Arlen PM. Clin Cancer Res. 2008;14:4526–4531. doi: 10.1158/1078-0432.CCR-07-5048. [DOI] [PMC free article] [PubMed] [Google Scholar]
- 39.Garnett CT, Schlom J, Hodge JW. Clin Cancer Res. 2008;14:3536–3544. doi: 10.1158/1078-0432.CCR-07-4025. [DOI] [PMC free article] [PubMed] [Google Scholar]
- 40.Arlen PM, Skarupa L, Pazdur M, Seetharam M, Tsang KY, Grosenbach DW, Feldman J, Poole DJ, Litzinger M, Steinberg SM, Jones E, Chen C, Marte J, Parnes H, Wright J, Dahut W, Schlom J, Gulley JL. J Urol. 2007;178:1515–1520. doi: 10.1016/j.juro.2007.05.117. [DOI] [PubMed] [Google Scholar]
- 41.Theoret MR, Arlen PM, Pazdur M, Dahut WL, Schlom J, Gulley JL. Clin Genitourin Cancer. 2007;5:347–350. doi: 10.3816/CGC.2007.n.017. [DOI] [PubMed] [Google Scholar]
- 42.Arlen PM, Gulley JL, Parker C, Skarupa L, Pazdur M, Panicali D, Beetham P, Tsang KY, Grosenbach DW, Feldman J, Steinberg SM, Jones E, Chen C, Marte J, Schlom J, Dahut W. Clin Cancer Res. 2006;12:1260–1269. doi: 10.1158/1078-0432.CCR-05-2059. [DOI] [PMC free article] [PubMed] [Google Scholar]
- 43.Ranieri E, Kierstead LS, Zarour H, Kirkwood JM, Lotze MT, Whiteside T, Storkus WJ. Immunol Invest. 2000;29:121–125. doi: 10.3109/08820130009062294. [DOI] [PubMed] [Google Scholar]
- 44.Disis ML, Gooley TA, Rinn K, Davis D, Piepkorn M, Cheever MA, Knutson KL, Schiffman K. J Clin Oncol. 2002;20:2624–2632. doi: 10.1200/JCO.2002.06.171. [DOI] [PubMed] [Google Scholar]
- 45.Butterfield LH, Ribas A, Dissette VB, Amarnani SN, Vu HT, Oseguera D, Wang HJ, Elashoff RM, McBride WH, Mukherji B, Cochran AJ, Glaspy JA, Economou JS. Clin Cancer Res. 2003;9:998–1008. [PubMed] [Google Scholar]
- 46.Wierecky J, Mueller M, Brossart P. Cancer Immunol Immunother. 2006;55:63–67. doi: 10.1007/s00262-005-0673-6. [DOI] [PMC free article] [PubMed] [Google Scholar]
- 47.Gordus A, MacBeath G. J Am Chem Soc. 2006;128:13668–13669. doi: 10.1021/ja065381g. [DOI] [PubMed] [Google Scholar]
Associated Data
This section collects any data citations, data availability statements, or supplementary materials included in this article.