

Abstract
Brain derived neurotrophic factor (BDNF) plays a key role in the growth, development and maintenance of the central and peripheral nervous systems. Exogenous BDNF activates its membrane receptors at the axon terminal, and subsequently sends regulation signals to the cell body. To understand how BDNF signal propagates in neurons, it is important to follow the trafficking of BDNF after it is internalized at the axon terminal. Here we labeled BDNF with bright, photostable quantum dot (QD-BDNF) and followed the axonal transport of QD-BDNF in real time in hippocampal neurons. We showed that QD-BDNF was able to bind BDNF receptors and activate downstream signaling pathways. When QD-BDNF was applied to the distal axons of hippocampal neurons, it was observed to be actively transported toward the cell body at an average speed of 1.11 ± 0.05 μm/s. A closer examination revealed that QD-BDNF was transported by both discrete endosomes and multivesicular body-like structures. Our results showed that QD-BDNF could be used to track the movement of exogenous BDNF in neurons over long distances and to study the signaling organelles that contain BDNF.
Introduction
Brain-derived neurotrophic factor (BDNF), a member of the neurotrophin family of growth factors, is most abundant in the cerebral cortex and hippocampus in the brain. Like other neurotrophic growth factors, BDNF supports neuronal survival, development, network maintenance, and the formation of new synaptic connections.1-5 In addition, BDNF is involved in modulating neuronal plasticity by inducing changes in synaptic transmission and morphology.6-9 Exogenous BDNF binds to and activates its membrane receptor, tyrosine kinase receptor B (TrkB), at the axon terminal. Upon activation, phosphorylated TrkB elicits several well-known signaling pathways including the mitogen activated protein kinase/extracellular signal-regulated protein kinase (MAPK/ERK), phosphatidylinositol 3-kinase (PI3K) and phospholipase Cγ (PLCγ) signaling pathways.10-13 However, in order for BDNF to exert its survival functions and ultimately regulate gene expression in the nucleus, the survival signal must be retrogradely conveyed from the axon terminal to the cell body.14
Extensive studies in different neuronal systems support that upon binding with TrkB, BDNF/TrkB complexes are endocytosed and packaged into membrane-bound organelles. These organelles, often called signaling endosomes, act as signal-carriers and are actively transported toward the cell body along the axon 15-18. The exact nature of signaling endosomes is still highly debated. Some evidence supports that signaling endosomes are single-lumen early endosomes with Rab5 and EEA1 molecular markers,19, 20 while other work proves that BDNF/TrkB are transported in late endosomes or large multivesicular bodies that contain small intraluminal vesicles.21 Furthermore, an alternative mechanism proposes that BDNF signals are carried by retrograde transport of secondary messenger proteins, therefore bypassing the need for the transport of BDNF and/or its receptors.22, 23
In order to study the mechanism of BDNF-TrkB signal propagation to the cell body, it is necessary to follow BDNF trafficking in neurons. Radiolabeled BDNF (125I-BDNF) had been used to follow BDNF transport in many studies. For example, 125I-BDNF injected to the eye of mice was found to be transported to the cervical ganglia and the trigeminal ganglia.24 While radio-labeling has minimal effect on BDNF biological functions and offers relatively high sensitivity, it is limited by poor spatial and temporal resolutions, which hinders its usage in tracking BDNF in real time. Alternatively, fluorescence-protein labeled BDNF has been used to study trafficking and recycling of BDNF,25, 26 but such endogenous BDNF is targeted for secretion and its function differs substantially from exogenous BDNF, which binds externally to TrkB receptors and activates survival signaling pathways. Therefore, a method that labels exogenous BDNF with bright and stable fluorophores would be very helpful in investigating BDNF retrograde signaling in neurons.
Trafficking of nerve growth factor (NGF), another member of the neurotrophin family, has been studied at single-molecule level in dorsal root ganglion neurons by quantum dot labeling 27, 28. Quantum dot (QD) is highly fluorescent and photostable, which enabled real-time tracking of NGF retrograde transport at single molecule level29. To use QD for monitoring BDNF transport requires that the labeling method does not perturb the biological function of BDNF. However, chemical modification of BDNF is tricky and often results in protein misfolding and loss of biological functions. In addition, some commercially available recombinant BDNF, usually expressed in E. coli and refolded, is inactive upon arrival (personal experience). As a positively charged protein, BDNF adheres to surfaces of spin columns and dialysis membranes, often leading to severe loss of proteins during the purification step. To date, very few studies have used chemically modified BDNF.30
In this study, we presented strategies to produce and purify QD-labeled BDNF. We showed that QD-BDNF is biologically active and binds specifically to TrkB receptors at the cell membrane. We also showed that QD-BDNF could be used to track long-distance axonal transport of BDNF in hippocampal neurons. Detailed analysis of BDNF movements revealed that, while the majority of QD-BDNFs were transported in discrete endosomes, a small fraction of QD-BDNFs were transported in multivesicular body-like structures.
Experimental
Preparation of biotin-BDNF
Recombinant human BDNF was a gift from Regeneron Pharmaceuticals (Tarrytown, NY). Crosslinking reagents to prepare biotin-BDNF including EZ-Link Amine-PEG2-Biotin and 1-Ethyl-3-(3-dimethylaminopropyl) carbodiimide (EDC) were obtained from Pierce Biotechnology (Rockford, IL). Biotin tags were covalently linked to the carboxyl groups of BDNF via EZ-Link Amine-PEG2-Biotin e and the EDC crosslinker. Briefly, 100 μg BDNF was dissolved in 355 μl MES buffer (0.1 M, pH 5.0) and mixed with 355 μl EZ-link-biotin–PEO-ammine solution (0.04 M in MES buffer). 40 μl of 0.1 M EDC in MES buffer was added into the mixture and incubated at room temperature for 3 hours with mild shaking.
The 750 μl reaction mixture was then purified by HPLC (Beckman System Gold 126 Module) using a reverse phase C8 column (Fisher Scientific, Rockford, IL; Cat# 208TP54). Proteins were eluted with 0.1% trifluoroacetic acid containing a step-wise linear acetonitrile concentration gradient: equilibrating for 10 minutes with 0% acetonitrile after sample loading, pre-eluting for 10min with acetonitrile concentration increased from 0% to 25%, eluting in a gradient of acetonitrile from 25% to 40% in 32 minutes, and subsequently washing with 100% acetonitrile to remove any residue components from the column. The flow rate was maintained at 1mL/min.31 The eluted protein fractions were monitored by 280nm absorbance. Two peaks between 30-35% acetonitrile concentrations were separately collected and lyophilized. The amount of protein is determined using the BCA protein assay (Pierce; Cat# 23225). On average, 0.8 biotins were added onto each BDNF molecule, as measured by the FluoReporter biotin quantification kit (Invitrogen; Cat# F30751).
Conjugation and purification of QD-BDNF
QD-BDNF was prepared by mixing streptavidin conjugated QD655 (Invitrogen, Carlsbad, CA; Cat# Q10121MP) with biotin-BDNF at a molar ratio of 1:1.2 and incubating overnight at 4 °C. In order to separate QD-BDNF complexes from free BDNF, the mixture was loaded to a size-exclusion syringe column packed with Sephacryl S-300 HR beads (Sigma-Aldrich; Cat# S-300 HR). The mixture was eluted with 20 mM Hepes buffer (pH 7.2) and the elution fractions were collected drop-wise into numbered tubes. Three tubes (Number 4-6), containing QD-BDNF with the highest QD fluorescence, were pooled together as the purified QD-BDNF. In order to confirm that free BDNF (not bound to QD) was not eluted in the same fraction as QD-BDNF, in a separate experiment, equivalent amount of unmodified BDNF was loaded into the same column and eluted under the same condition. The same elution fractions (Number 4-6) of this BDNF eluent were collected and pooled together to be used as a negative control to verify the absence of free BDNF in those fractions.
Culture and transfection of COS7 cells
COS7 cells were cultured on poly-lysine (Sigma-Aldrich) coated coverslips and maintained in DMEM medium (with 4.5 g/L glucose, L-glutamine, and no sodium pyruvate; Fisher Scientific) supplemented with 10% fetal bovine serum (Phenix Research Products; Candler, NC). At 70% confluence, the cells were transfected with a TrkB-GFP plasmid (kindly provided by Dr. Rosalind Segal 32) using Lipofectamine 2000 (Invitrogen) following the manufacturer's protocol. The culture was subjected to transfection medium for 2 hours before changing back to normal growth medium. Transfected cells were allowed to recover and express the TrkB receptor for at least 24 hours before QD-BDNF binding experiments were carried out. On the day of the experiment, the culture was starved in serum-free DMEM for 2 hours and incubated with 4 nM QD-BDNF in DMEM and 1% BSA at 37 °C for another 2 hours. In the control experiment, a similar culture was incubated with 4 nM QD and 4 nM unmodified BDNF under the same condition. After washing out QD-BDNF or QD with PBS, the cells were immediately imaged on an inverted Leica microscope (DMI6000 B) equipped with a 100× oil immersion objective. Fluorescent QD signals was collected through a 655±20nm bandpass filter and detected using a CoolSNAP II camera.
Culture of hippocampal neurons in microfluidic devices
Dissociation and culture of primary hippocampal neurons was carried out according to an established protocol.33 Briefly, hippocampi were dissected from Sprague-Dawley fetal rats on embryonic day 18. Tissues were enzymatically dissociated in 0.1 mg/mL trypsin for 15 min in Ca2+ and Mg2+ free HBSS buffer, and further triturated in plating medium of DMEM supplemented with 10% heat-inactivated FBS. 5μl of dissociated neurons at 3-4×10⁶ cells/ml were plated into the cell body compartment of each microfluidic device. The microfluidic devices for neuronal culture were made of polydimethyl silane (PDMS) and assembled onto poly-lysine coated coverslips as we previously described. 34 The next day, the plating medium was replaced by maintenance medium (Neurobasal medium (Cat# 21103) supplemented with 1× B27 (Cat# 17504-044) and 2 mM Glutamax (Cat# 35050-061), all from Invitrogen). The neurons were kept in maintenance medium, with half of the medium replenished with fresh medium every two days until being used for experiments around day 7.
Fluorescence imaging of QD-BDNF
For QD-BDNF transport experiments in hippocampal neurons, 1 nM QD-BDNF in maintenance medium supplemented with 1% BSA was applied to the axon compartment. 1 nM QDs mixed with 1 nM unmodified BDNF were used in control experiments under the same condition. BSA in the solutions was to minimize the non-specific binding of QD. In order to prevent QD-BDNF from diffusing into the cell body compartment through the microchannels, the liquid in the cell body compartment was always maintained at a higher level than that of the axon compartment. The culture was then put back into the incubator for 2 hours for sufficient binding, internalization and transport of QD-BDNF. Before imaging, QD-BDNF in the axonal compartment was washed away with warm CO2-independent medium (Invitrogen). Transport of QD-BDNF was imaged on an inverted microscope (Leica DMI6000 B) as mentioned earlier and a temperature-controlled stage (Warner Instrument) with a frame rate of 2 frames/second. The culture was maintained in CO2-independent medium throughout imaging.
SDS-page and immunoblotting
Precast SDS-page gels were purchased from Bio-Rad (Hercules, CA) and used following manufacturer's instructions. Electrophoresis of unmodified and biotinylated BDNF were carried out using 12% SDS-page gels. To check the concentration of proteins and verify their molecular weights, SDS gels were stained with 0.025% Coomassie Blue R solution (Bio-Rad) for 1 hr before washing in destaining solutions of 7% acetic acid and 40% methanol. To verify the addition of biotin labels to BDNF, proteins separated by SDS gel were transferred onto a PVDF membrane (Fisher Scientific), blocked in 5% milk, and incubated with HRP-streptavidin (Millipore, Billerica, MA; Cat# 18-152).
For immunoprecipitation, 3T3 cells expressing TrkB (a generous gift from Dr. Chengbiao Wu, UC San Diago) were cultured in a 15 cm dish till ∼70% confluency. The cells were gently scraped off, collected into Ca2+ and Mg2+ free PBS, and centrifuged down. The cell pellet was then resuspended in ice cold PBS and divided evenly into 4 or 5 tubes. BDNF, biotin-BDNF, QD-BDNF (10∼50 ng/mL), QD alone, or the BDNF-eluent (negative control) was separately added to each tube. The tubes were incubated at 37 °C for 5 minutes and put on ice. Then treated cells were pelleted by centrifugation and extracted in RIPA lysis buffer with 1 mM phenylmethylsulfonyl fluoride (Pierce) and 1 mM sodium vanadate (Sigma-Aldrich). For immunoprecipitation, 2 μl polyclonal anti phospho-Trk (Cell Signaling, Danvers, MA; Cat# 9141) was added into each cell lysate and incubated at 4 °C overnight with shaking. 15 μl Protein A/G Plus-Agarose (Santa Cruze Biotechnology, Santa Cruz, CA; Cat# Sc-2003) was then added into each vial to bind the antibody-pTrkB complex. The agarose beads were then centrifuged down, washed 5 times and resuspended in Laemmli loading buffer (Bio-Rad) with 5% 2-Mercaptoethanol (Sigma-Aldrich).
For immunoblotting, protein samples were separated on 4-15% SDS-page gradient gels. The gels were then transferred onto PVDF membranes overnight in the cold room. The blotted membranes were first blocked in 5% milk for 1 hour and then incubated with primary antibodies at 1:1000 dilution in TBST buffer (10 mM Tris-HCl, 150 mM NaCl, 0.1% Tween) overnight in a cold room. After washing 3 times in TBST, the membrane was incubated with HRP conjugated secondary antibodies for 1hr, washed and detected by the enhanced chemiluminescence kit (Pierce) in a darkroom. For primary antibodies, we used anti total-TrkB from BD Transduction Laboratories (Sparks, MD; Cat# 610101), anti-MAP2 (Cat# M3696) from Sigma-Aldrich, anti-Tau-1 (Cat# MAB3420) from Millipore, monoclonal anti phospho-TrkB (Tyr516) (Cat# 4619), polyclonal anti phospho-Trk (Cat# 9141), anti phospho-Erk1/2 (Cat# 9101) and anti total-Erk1/2 (Cat# 9102) from Cell Signaling Technology (Danvers, MA). For secondary antibodies, we had used goat-anti-mouse-HRP IgG and goat-anti-rabbit-HRP IgG from Jackson ImmunoResearch (West Grove, PA).
Results
Characterization and biotinylation of BDNF
When unmodified BDNF was loaded into HPLC and eluted with a linear concentration gradient of acetonitrile (25-40%), two peaks showed at slightly different acetonitrile concentrations, one at 30.2% and the other at 32.7% (Fig. 1A, top). Elution fractions of corresponding peaks were separately collected and resolved by SDS-page. Electrophoresis revealed that both peaks contain proteins of molecular weight around 13 kDa (data not shown), which was consistent with the reported molecular weight of BDNF monomer. Upon completion of the biotinylation reaction using un-separated BDNF, the reaction mixture was run on reverse phase HPLC under the same condition. For biotinylated BDNF, two peaks were eluted and collected at similar acetonitrile concentrations (around 30.2% and 32.7%).
Fig. 1.
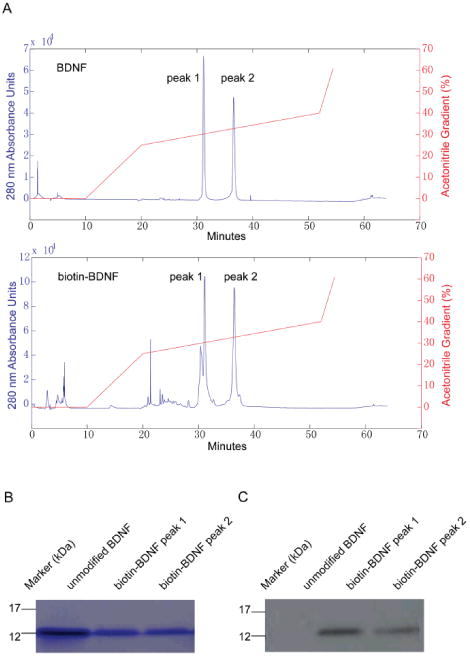
Characterization of HPLC separated BDNF and biotin-BDNF. (A) 30 μg unmodified BDNF (top) or 100 μg BDNF-biotinylation reaction mixture (bottom) was injected into a Vydac C8 column. The column was eluted at 1 mL/min with a step-wise acetonitrile gradient in water and 1% TFA. Both BDNF and biotin-BDNF showed two peaks: peak 1 eluted at 30.2% acetonitrile and peak 2 at 32.7% acetonitrile. (B) BDNF and the biotin-BDNF eluent collected from the two HPLC peaks were run on 12% SDS-page and stained with Coomassie blue to show their molecular weight at about 13 kDa. (C) Blotting of BDNF samples with HRP conjugated streptavidin confirmed the biotin moiety on biotin-BDNF collected from both peaks.
As shown in Fig. 1B, components collected from the two biotin-BDNF peaks had similar molecular weight to that of unmodified BDNF at 13 kDa. To confirm the biotin moiety in biotin-BDNF, proteins on SDS gel were transferred to a PVDF membrane and blotted with HRP-streptavidin. Fig. 1C showed that both HPLC peaks of biotin-BDNF bind tightly to streptavidin, confirming the presence of biotin tags. As expected, unmodified BDNF did not bind to streptavidin. It was unclear why our sample of recombinant BDNF (thus also the biotinylated BDNF) showed two peaks in HPLC. As we demonstrated in the next section, components collected from both peaks of either unmodified or biotinylated BDNF were able to induce TrkB phosphorylation to a similar degree (Fig. 2A). We suspect that these two peaks correspond to different forms of post-translationally modified BDNF that have different affinities to the reverse-phase column, but both forms are biologically active.
Fig. 2.
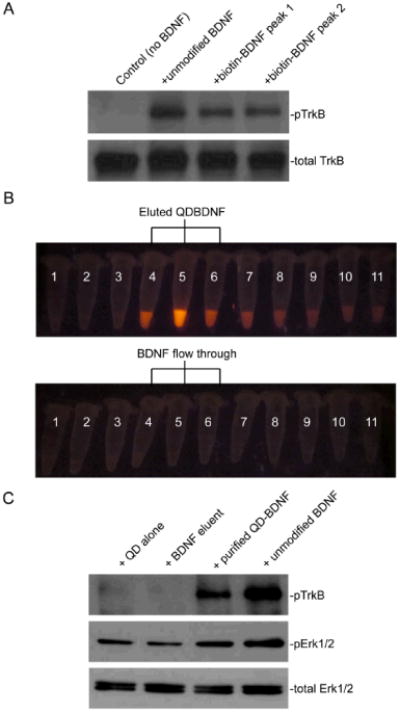
Biotin-BDNF and QD-BDNF are biologically active. (A) Western blot against phospho-TrkB showed that BDNF and biotin-BDNF collected from both HPLC peaks induced TrkB phosphorylation in a TrkB-expressing 3T3 cell line. (B) Separation of QD-BDNF from free BDNF by a size-exclusion column. QD-BDNF was loaded into a Sephacryl column and elution fractions were collected into separate tubes (50 μl each). Tubes with the most intense QD fluorescence (Tube 4, 5 and 6 in the top row) were pooled together as purified QD-BDNF. Unmodified BDNF was loaded into the same column and eluted under the same conditions. Elution fractions 4, 5 and 6 (bottom row), labeled as BDNF eluent, were used as a negative control. (C) Purified QD-BDNF induced TrkB phosphorylation in TrkB-3T3 cells and Erk phosphorylation in hippocampal neurons. pTrkB was immunoprecipitated with the pTrk antibody before western blot. No activity was detected by the BDNF eluent, indicating that free BDNF was not eluted out in the same fractions as QD-BDNF.
Biotin-BDNF and QD-BDNF are biologically active
We further assessed the biological activity of biotin-BDNF by measuring its ability to induce phosphorylation of TrkB receptors (p-TrkB) in a TrkB-expressing 3T3 cell line. Immunoblotting with a p-TrkB antibody showed that both unmodified BDNF and biotin-BDNF were able to induce TrkB activation (Fig. 2A). Biotin-BDNF was linked to streptavidin conjugated QD via the strong biotin-streptavidin interaction. A rough quantification by the FluoReporter kit indicated that there were on average 0.8 biotin labels on each BDNF molecule, which indicated that not all BDNF molecules were biotinylated. To rule out the possibility that the bioactivity detected for biotin-BDNF and QD-BDNF come from unmodified BDNF in the mixture, we further purified QD-BDNF by a size exclusion Sephacryl column (Fig. 2B). The Sephacryl beads were expected to separate QD-BDNF (15-20nm diameter, comparable to 2500 kDa ribosome complexes) from unmodified BDNF (26 kDa). When QD-BDNF was eluted from the column, QD fluorescence concentrated in fractions 5, but had a long tail to several following fractions (Fig. 2B). To avoid significant dilution, we only used fractions 4-6 for following studies. In a separate experiment, uncomplexed BDNF was loaded in the same column and elution fractions 4-6 were collected to serve as a negative control. When purified QD-BDNF or unmodified BDNF were applied to TrkB-expressing 3T3 cells, TrkB was phosphorylated (Fig. 2C). On the other hand, when elution fractions 4-6 of uncomplexed BDNF or QD alone were applied to TrkB-expressing 3T3 cells, no TrkB phosphorylation was observed. The negative result of BDNF eluent confirmed that uncomplexed BDNF eluted at different fractions from QD-BDNF in the Sephacryl column. To further confirm that QD-BDNF was able to activate subsequent BDNF signaling pathways, we treated hippocampal neuron cultures with purified QD-BDNF, unmodified BDNF, or negative controls (QD alone and BDNF eluent). Indeed, immunoblotting of total Erk and phospho-Erk demonstrated that QD-BDNF activated the MAPK signaling pathway in hippocampal neurons. These results confirm that biotin-BDNF and QD-BDNF are biologically active.
QD-BDNF binds to TrkB receptors on cell membrane
In order to use QD-BDNF to track BDNF movement in live cells, we first showed that QD-BDNF bind to the cell membrane selectively via the BDNF receptor TrkB. QD-BDNF binding was assayed using COS7 cells that did not express endogenous TrkB receptors. Treatment of untransfected COS7 cells with 4nM QD-BDNF for 2 hours resulted in very little surface binding. However, robust binding on the cell membrane was detected following transfection of these cells with a TrkB-GFP plasmid (Fig. 3). The presence of TrkB receptor was confirmed by its green fluorescence. As shown in the left panel in Fig. 3, QD-BDNF has a markedly higher binding affinity to transfected compared with untransfected cells in the same culture. QD fluorescence imaging of transfected cells showed high fluorescence staining on the cell membrane, while very little fluorescence was detected in non-transfected cells. In a comparison study, using a mixture of QD and unmodified BDNF of the same concentrations as QD-BDNF, very little QD binding was detected (Fig. 3, right panel). Thus, the presence of BDNF was necessary for binding of QD-BDNF complexes to TrkB receptors.
Fig. 3.
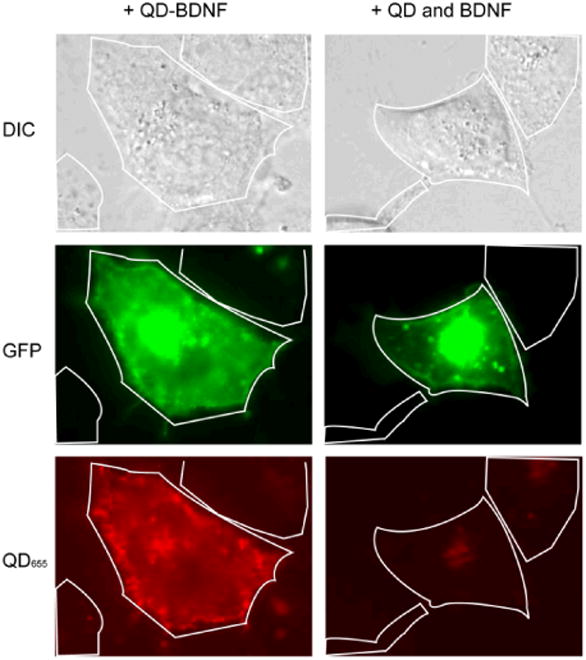
QD-BDNF binds specifically to TrkB receptors. COS7 cells that did not express endogenous TrkB were transfected with a TrkB-GFP plasmid. When 4 nM QD-BDNF was supplied to transfected cell culture, QD binding and internalization was specific to the transfected cells (green cell) as shown in the left panel images. The non-transfected cells have very little QD binding even after 2hrs of incubation. When a mixture of 4 nM QD and 4 nM unmodified BDNF was applied to the culture, very few QD binding events were observed in either transfected or non-transfected cells (right panel images).
QD-BDNF is internalized at axon terminals and transported toward cell body
To study axonal transport of QD-BDNF, hippocampal neurons were cultured in microfluidic chambers with 500 μm long microchannels connecting the cell body compartment and the axon compartment (Fig. 4A). After being plated in the cell body compartment, neurons extended thin neurites, some of which grew across the microchannels in 4-5 days. It is known that axons grow faster and longer than dendrites. Indeed, immunostaining of axons with anti-Tau antibody and dendrites with anti-MAP2 antibody confirmed that axons grew across the microchannels at day 7, while dendrites did not (Fig. 4B). QD-BDNF was applied exclusively to the axon compartment, and special care was taken to prevent QD-BDNF from diffusing through the microchannels (see methods section). Live-cell fluorescence imaging was carried out in the microchannels or in the cell body compartment, which ensured that only those QD-BDNFs that were internalized at the axonal terminals and were actively transported along the axons would be imaged. Generally, two-hour incubation with 1nM QD-BDNF in the axon compartment led to ∼5-20 QD-BDNF-containing endosomes being transported in a 60μm long axonal segment in the field of view (Video S1). It took ∼40 minutes for the first QD-BDNF to reach the cell body, and accumulation of QD-BDNF in the cell body can be observed within 2 or 3 hours.
Fig. 4.
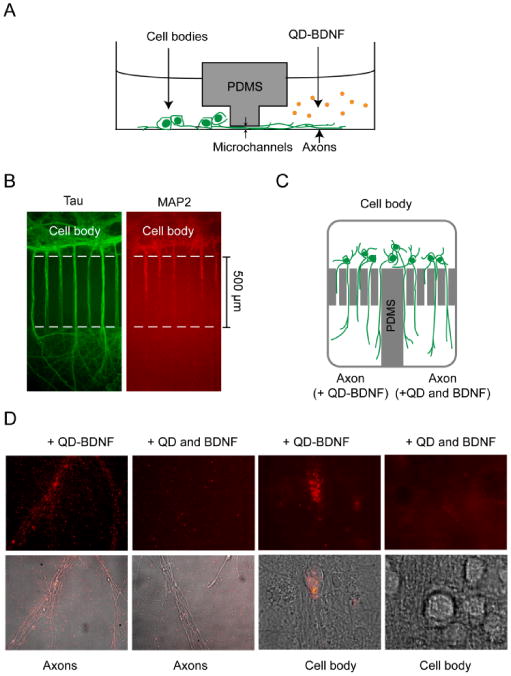
Compartmentalized culture of hippocampal neurons and transport of QD-BDNF in microfluidic devices. (A) Schematic drawing of a microfluidic device for compartmentalized neuronal culture (side view). The cell body and axon compartments are connected only through a set of microchannels. (B) Immunostaining showed that only axons (stained with anti-Tau, green) grew across the microchannels into the axon compartment while dendrites did not (stained with anti-MAP2, red). (C) Design of a microfluidic device that has a single cell body compartment but two axon compartments (top view). This device was used to compare transport of QD-BDNF against QD mixed with unmodified BDNF. QD-BDNF was added to one axon compartment while a mixture of QD and unmodified BDNF was applied to the other axon compartments. (D) After overnight incubation at 37 °C, QD-BDNF (1 nM) staining of axons was extensive in the axon compartment. On the other hand, very few QDs overlapped with axons on the side where a mixture of 1 nM QD and 1 nM unmodified BDNF was applied. QD fluorescent signal in cell bodies was only found on the side applied with QD-BDNF.
In order to confirm that the internalization and retrograde transport of QD-BDNF stemmed from the biological functions of BDNF, we compared the binding and transport flux of QD-BDNF complexes against a mixture of QD and unmodified BDNF. To eliminate culture to culture variations, neurons were cultured in a microfluidic device that had a single cell body compartment but two separated axon compartments (Fig. 4C). QD-BDNF was applied to one axon compartment while a mixture of QD and unmodified BDNF (as a control) was applied to the other. In this way, the same neuronal culture was used for both the QD-BDNF and the control. After two hours of incubation, transport was readily observed in the microchannels that were connected to the axon compartment supplied with QD-BDNF, but no transport was observed on the control side. QD-BDNF bound to most if not all axons in the axon compartment, as evidenced by overlapping QD fluorescence signal with individual axons and clusters thereof. On the other hand, addition of QD and unmodified BDNF did not result in binding of QD to axons (Fig. 4D). After overnight incubation, QD staining of cell bodies was only detected on the side with QD-BDNF (Fig. 4D). These results verified that the internalization and transport of QD-BDNF was due to the presence of BDNF molecules on QDs. To further confirm that retrograde transport of QD-BDNF depended on the activation of TrkB receptors, the culture was pre-treated with 200 nM k252a, a selective inhibitor of the receptor tyrosine kinase TrkB, one hour prior to the addition of QD-BDNF to the axon compartment. We found that k252a treatment reduced the transport flux to ∼5% that of untreated cultures.35, 36
It is worth noting that non-specific binding of QD alone to the cell membrane and its subsequent transport is highly dependent on the batch and the age of QD from Invitrogen. Freshly obtained QD655 alone generally show very little non-specific binding to the cell membrane when added to the cell culture. However, after storing at 4 °C for a few months, non-specific binding increased. Furthermore, some batches of QD show much worse non-specific binding than other batches. When we first used an old batch of QD605-streptavidin, we observed significant non-specific transport of QD (without BDNF on it) when it was supplied to the axon compartment. However, when we used a batch of fresh QD655-streptavidin together with 0.2% BSA, the non-specific transport was almost completely eliminated.
QD-BDNF is transported by both discrete endosomes and MVB-like structures
Fig. 5A and 5B show representative trajectories and kymographs of axonal transport of QD-BDNF. We recorded transport events in 15 microchannels with 4 independent cultures, generating trajectories of 144 QD-BDNF endosomes. Overall, the transport was unidirectional toward the cell body, characterized by smooth movements interspersed with brief pauses (Fig. 5B, left). In a few occasions, QD-BDNF paused for a long time before starting to move again (Fig. 5B, right). The averaged transport speed of individual QD-BDNF carrying cargoes varied from 0.05 μm/s to 2.81 μm/s, with a mean speed of 1.11 ± 0.05 μm/s and a standard deviation of 0.56 μm/s (Fig. 5C). The wide distribution of transport speeds among individual cargos represents the intrinsic heterogeneity in the axonal transport process. The QD-BDNF endosome transport characteristics observed here matches those of fast axonal transport reported previously.37, 38
Fig. 5.
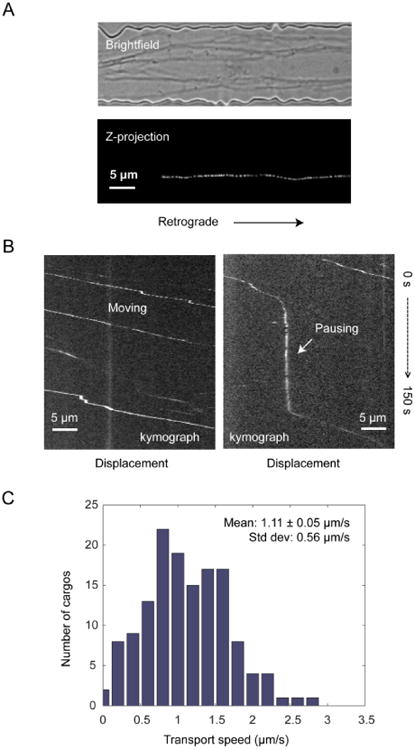
Retrograde axonal transport of QD-BDNF in hippocampal neurons. (A) A DIC image of axons in a microchannel of the microfluidic device (top). QD-BDNF was added to the distal axon chamber and the trajectories of single endosomes were observed along one of the axons in the channel (bottom). (B) To analyze transport patterns, kymographs were generated from time-lapse images. Left: most QD-BDNFs moved unidirectional toward the cell body with occasional pauses. Right: occasionally, a cargo paused for a long time, as indicated by the vertical segment on the kymograph. (C) Speed distributions analyzed from trajectories of 144 QD-BDNF cargos. The average transport speed and standard deviation were shown in the graphs.
The vast majority of QD-BNDFs were transported discretely – moving independently of one another. In a small fraction of transport events (a few percent), however, several well-resolved QD-BDNF complexes were transported together, displaying concomitant moving and pausing dynamics along the axon (Fig. 6). Taking advantage of the excellent photostability of QDs, we were able to follow these QD-BDNFs over long distances along the axon and found that they had always moved together. The time-lapse images of three concomitantly moving QD-BNDF puncta (indicated with arrow heads) were shown in Fig 6A. The corresponding kymograph was shown in Fig. 6B and the corresponding movie could be found in Video S2. The distance between these QD-BDNF puncta varied slightly as they moved along the axon, but their positional orders were always kept the same. Previous analysis of BDNF cargoes by electron microscopy suggest that a portion of BDNF is transported in multivesicular bodies that contain intraluminal vesicles.21, 39, 40 We suspected that the concomitant-moving QD-BDNFs represented small intraluminal vesicles inside a large multivesicular body. The distance between the first and the last QD-BDNFs could be as far as 2μm, indicating an elongated structure as it was moving along the axon.
Fig. 6.
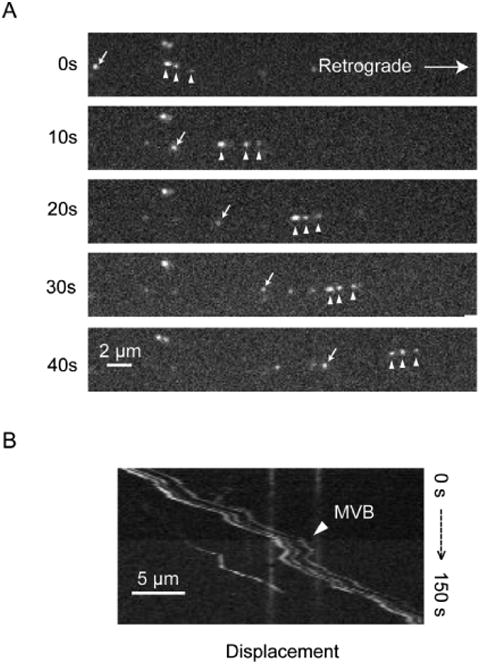
QD-BDNFs are transported in both discrete endosomes and MVB-like structures. (A) Time-lapse images showing both transporting modes. White arrows indicated an individual BDNF-endosome while white arrow heads denoted three QD-BDNF moving together in a MVB-like structure. (B) A kymograph clearly showed the concurrent moving and pausing patterns of the three QD-BDNFs in a MVB-like structure. The distances between the three QD-BDNFs varied slightly during the transport but their relative orders remained.
Discussion
We developed a method to label recombinant BDNF with quantum dots in order to follow the retrograde transport of exogenous BDNF trafficking in hippocampal axons. Biotin tags were covalently added to the carboxyl groups on BDNF and subsequently linked to streptavidin-conjugated QDs. Separation of QD-BDNF complexes from free BDNF was accomplished with a size-exclusion column. We showed that QD-BDNF was biologically active in inducing phosphorylation of TrkB receptors and activation of MAPK/ERK signaling pathway.
When QD-BDNF was applied to the distal axon compartment in a microfluidic device, it was taken up at the axon termini via receptor mediated endocytosis and retrogradely transported toward the cell body. Live tracking of QD-BDNF shows that the axonal transport of endocytosed BDNF is unidirectional and highly processive with very short pauses. The kinetic properties of QD-BNDF described here agree with prior observations made in Drosophila axons and squid axoplasm.41, 42 The fact that QD-BDNFs rarely show directional reversal indicates that it is mainly a dynein driven process, which differs from other bidirectional axonal transport systems.43-45 While the majority of QD-BDNFs were transported individually in discrete endosomes, some QD-BDNFs were transported as a group, presumably in multivesicular body-like structures. The superb brightness and photostability of quantum dots make them suitable for long-term tracking of proteins in live cells. By labeling BDNF with QD, it is now possible to follow BDNF retrograde transport all the way into cell bodies, which would enable a better understanding about the functional role of BDNF.
Supplementary Material
Acknowledgments
This work was supported by National Institute of Health (NIH) grant NS057906, Bio-X interdisciplinary initiatives program, Searle Scholar award and Packard Fellowships for Science and Engineering.
Footnotes
Electronic Supplementary Information (ESI) available: [details of any supplementary information available should be included here]. See DOI: 10.1039/b000000x/
Notes and references
- 1.Ghosh A, Carnahan J, Greenberg ME. Science. 1994;263:1618–1623. doi: 10.1126/science.7907431. [DOI] [PubMed] [Google Scholar]
- 2.Alderson RF, Alterman AL, Barde YA, Lindsay RM. Neuron. 1990;5:297–306. doi: 10.1016/0896-6273(90)90166-d. [DOI] [PubMed] [Google Scholar]
- 3.Jones KR, Farinas I, Backus C, Reichardt LF. Cell. 1994;76:989–999. doi: 10.1016/0092-8674(94)90377-8. [DOI] [PMC free article] [PubMed] [Google Scholar]
- 4.Patterson SL, Abel T, Deuel TA, Martin KC, Rose JC, Kandel ER. Neuron. 1996;16:1137–1145. doi: 10.1016/s0896-6273(00)80140-3. [DOI] [PubMed] [Google Scholar]
- 5.Dijkhuizen PA, Ghosh A. J Neurobiol. 2005;62:278–288. doi: 10.1002/neu.20100. [DOI] [PubMed] [Google Scholar]
- 6.Schinder AF, Poo MM. Trends Neurosci. 2000;23:639–645. doi: 10.1016/s0166-2236(00)01672-6. [DOI] [PubMed] [Google Scholar]
- 7.Horch HW, Katz LC. Nat Neurosci. 2002;5:1177–1184. doi: 10.1038/nn927. [DOI] [PubMed] [Google Scholar]
- 8.Mohajerani MH, Sivakumaran S, Zacchi P, Aguilera P, Cherubini E. Proc Natl Acad Sci U S A. 2007;104:13176–13181. doi: 10.1073/pnas.0704533104. [DOI] [PMC free article] [PubMed] [Google Scholar]
- 9.Pozzo-Miller LD, Gottschalk W, Zhang L, McDermott K, Du J, Gopalakrishnan R, Oho C, Sheng ZH, Lu B. J Neurosci. 1999;19:4972–4983. doi: 10.1523/JNEUROSCI.19-12-04972.1999. [DOI] [PMC free article] [PubMed] [Google Scholar]
- 10.Tao X, Finkbeiner S, Arnold DB, Shaywitz AJ, Greenberg ME. Neuron. 1998;20:709–726. doi: 10.1016/s0896-6273(00)81010-7. [DOI] [PubMed] [Google Scholar]
- 11.Alonso M, Medina JH, Pozzo-Miller L. Learn Mem. 2004;11:172–178. doi: 10.1101/lm.67804. [DOI] [PMC free article] [PubMed] [Google Scholar]
- 12.Numakawa T, Suzuki S, Kumamaru E, Adachi N, Richards M, Kunugi H. Histol Histopathol. 2010;25:237–258. doi: 10.14670/HH-25.237. [DOI] [PubMed] [Google Scholar]
- 13.Gottschalk WA, Jiang H, Tartaglia N, Feng L, Figurov A, Lu B. Learn Mem. 1999;6:243–256. [PMC free article] [PubMed] [Google Scholar]
- 14.Ginty DD, Segal RA. Curr Opin Neurobiol. 2002;12:268–274. doi: 10.1016/s0959-4388(02)00326-4. [DOI] [PubMed] [Google Scholar]
- 15.Cosker KE, Courchesne SL, Segal RA. Curr Opin Neurobiol. 2008;18:270–275. doi: 10.1016/j.conb.2008.08.005. [DOI] [PMC free article] [PubMed] [Google Scholar]
- 16.Wu C, Cui B, He L, Chen L, Mobley WC. J Proteomics. 2009;72:46–55. doi: 10.1016/j.jprot.2008.10.007. [DOI] [PMC free article] [PubMed] [Google Scholar]
- 17.Howe CL, Mobley WC. J Neurobiol. 2004;58:207–216. doi: 10.1002/neu.10323. [DOI] [PubMed] [Google Scholar]
- 18.Ye H, Kuruvilla R, Zweifel LS, Ginty DD. Neuron. 2003;39:57–68. doi: 10.1016/s0896-6273(03)00266-6. [DOI] [PubMed] [Google Scholar]
- 19.Howe CL, Mobley WC. Curr Opin Neurobiol. 2005;15:40–48. doi: 10.1016/j.conb.2005.01.010. [DOI] [PubMed] [Google Scholar]
- 20.Delcroix JD, Valletta JS, Wu C, Hunt SJ, Kowal AS, Mobley WC. Neuron. 2003;39:69–84. doi: 10.1016/s0896-6273(03)00397-0. [DOI] [PubMed] [Google Scholar]
- 21.Weible MW, 2nd, Hendry IA. J Neurobiol. 2004;58:230–243. doi: 10.1002/neu.10318. [DOI] [PubMed] [Google Scholar]
- 22.Senger DL, Campenot RB. The Journal of cell biology. 1997;138:411–421. doi: 10.1083/jcb.138.2.411. [DOI] [PMC free article] [PubMed] [Google Scholar]
- 23.Yoshii A, Constantine-Paton M. Nat Neurosci. 2007;10:702–711. doi: 10.1038/nn1903. [DOI] [PubMed] [Google Scholar]
- 24.Reynolds AJ, Hendry IA. Brain Res Protoc. 1999;3:308–312. doi: 10.1016/s1385-299x(98)00054-3. [DOI] [PubMed] [Google Scholar]
- 25.Adachi N, Kohara K, Tsumoto T. Bmc Neurosci. 2005;6 doi: 10.1186/1471-2202-6-42. [DOI] [PMC free article] [PubMed] [Google Scholar]
- 26.Takihara Y, Inatani M, Hayashi H, Adachi N, Iwao K, Inoue T, Iwao M, Tanihara H. Invest Ophthalmol Vis Sci. 2011;52:3039–3045. doi: 10.1167/iovs.10-6435. [DOI] [PubMed] [Google Scholar]
- 27.Cui BX, Wu CB, Chen L, Ramirez A, Bearer EL, Li WP, Mobley WC, Chu S. P Natl Acad Sci USA. 2007;104:13666–13671. doi: 10.1073/pnas.0706192104. [DOI] [PMC free article] [PubMed] [Google Scholar]
- 28.Sung K, Maloney MT, Yang J, Wu C. J Neurosci Methods. 2011;200:121–128. doi: 10.1016/j.jneumeth.2011.06.020. [DOI] [PMC free article] [PubMed] [Google Scholar]
- 29.Mudrakola HV, Zhang K, Cui BX. Structure. 2009;17:1433–1441. doi: 10.1016/j.str.2009.09.008. [DOI] [PMC free article] [PubMed] [Google Scholar]
- 30.Altick AL, Baryshnikova LM, Vu TQ, von Bartheld CS. J Comp Neurol. 2009;514:641–657. doi: 10.1002/cne.22047. [DOI] [PMC free article] [PubMed] [Google Scholar]
- 31.Sunasara KM, Cramer SM, Hauer CR, Rupp RG, Shoup VA. Arch Biochem Biophys. 1999;372:248–260. doi: 10.1006/abbi.1999.1501. [DOI] [PubMed] [Google Scholar]
- 32.Watson FL, Heerssen HM, Moheban DB, Lin MZ, Sauvageot CM, Bhattacharyya A, Pomeroy SL, Segal RA. J Neurosci. 1999;19:7889–7900. doi: 10.1523/JNEUROSCI.19-18-07889.1999. [DOI] [PMC free article] [PubMed] [Google Scholar]
- 33.Fath T, Ke YD, Gunning P, Gotz J, Ittner LM. Nat Protoc. 2009;4:78–85. doi: 10.1038/nprot.2008.199. [DOI] [PubMed] [Google Scholar]
- 34.Zhang K, Osakada Y, Vrljic M, Chen L, Mudrakola HV, Cui B. Lab Chip. 2010;10:2566–2573. doi: 10.1039/c003385e. [DOI] [PMC free article] [PubMed] [Google Scholar]
- 35.Du J, Feng L, Zaitsev E, Je HS, Liu XW, Lu B. The Journal of cell biology. 2003;163:385–395. doi: 10.1083/jcb.200305134. [DOI] [PMC free article] [PubMed] [Google Scholar]
- 36.Santi S, Cappello S, Riccio M, Bergami M, Aicardi G, Schenk U, Matteoli M, Canossa M. Embo J. 2006;25:4372–4380. doi: 10.1038/sj.emboj.7601303. [DOI] [PMC free article] [PubMed] [Google Scholar]
- 37.Vallee RB, Bloom GS. Annu Rev Neurosci. 1991;14:59–92. doi: 10.1146/annurev.ne.14.030191.000423. [DOI] [PubMed] [Google Scholar]
- 38.Brown A. Nat Rev Mol Cell Biol. 2000;1:153–156. doi: 10.1038/35040102. [DOI] [PubMed] [Google Scholar]
- 39.Rind HB, Butowt R, von Bartheld CS. J Neurosci. 2005;25:539–549. doi: 10.1523/JNEUROSCI.4322-04.2005. [DOI] [PMC free article] [PubMed] [Google Scholar]
- 40.Butowt R, von Bartheld CS. J Neurosci. 2001;21:8915–8930. doi: 10.1523/JNEUROSCI.21-22-08915.2001. [DOI] [PMC free article] [PubMed] [Google Scholar]
- 41.Brady ST, Richards BW, Leopold PL. Methods Cell Biol. 1993;39:191–202. doi: 10.1016/s0091-679x(08)60171-5. [DOI] [PubMed] [Google Scholar]
- 42.Pilling AD, Horiuchi D, Lively CM, Saxton WM. Mol Biol Cell. 2006;17:2057–2068. doi: 10.1091/mbc.E05-06-0526. [DOI] [PMC free article] [PubMed] [Google Scholar]
- 43.Dixit R, Ross JL, Goldman YE, Holzbaur EL. Science. 2008;319:1086–1089. doi: 10.1126/science.1152993. [DOI] [PMC free article] [PubMed] [Google Scholar]
- 44.Hendricks AG, Perlson E, Ross JL, Schroeder HW, 3rd, Tokito M, Holzbaur EL. Curr Biol. 2010;20:697–702. doi: 10.1016/j.cub.2010.02.058. [DOI] [PMC free article] [PubMed] [Google Scholar]
- 45.Holzbaur EL, Goldman YE. Curr Opin Cell Biol. 2010;22:4–13. doi: 10.1016/j.ceb.2009.12.014. [DOI] [PMC free article] [PubMed] [Google Scholar]
Associated Data
This section collects any data citations, data availability statements, or supplementary materials included in this article.