Abstract
Purpose
The goal of this study was to compare clinical and research-based cochlear-implant (CI) measures using telehealth versus traditional methods.
Method
This prospective study used an ABA design (A: laboratory, B: remote site). All measures were made twice per visit to assess within-session variability. Twenty nine adult and pediatric CI recipients participated. Measures included: electrode impedance, electrically evoked compound action potential (ECAP) thresholds, psychophysical thresholds using an adaptive procedure, map thresholds and upper comfort levels, and speech perception. Subjects completed a questionnaire at the end of the study.
Results
Results for all electrode-specific measures revealed no statistically significant differences between traditional and remote conditions. Speech perception was significantly poorer in the remote condition, which was likely due to the lack of a sound booth. In general, subjects indicated that they would take advantage of telehealth options at least some of the time, if it were available.
Conclusions
Results from this study demonstrate that telehealth is a viable option for research and clinical measures. Additional studies are needed to investigate ways to improve speech perception at remote locations that lack sound booths, and to validate the use of telehealth for pediatric services (e.g., play audiometry), sound-field threshold testing, and troubleshooting equipment.
Keywords: cochlear implants, telepractice, technology
INTRODUCTION
Clinical cochlear implant (CI) programs generally require approximately 8–10 visits to the CI center within the first year of device use, with annual or semiannual visits thereafter. This can be a hardship for patients who live significant distances from a CI center and/or do not have reasonable access to transportation. Functional results of missed visits (i.e., lack of appropriate follow-up) may include sub-optimal outcomes or non-use of the device. Remote delivery of clinical CI services via telehealth is therefore an attractive option for patients in rural and other under-served areas. Telehealth (or telepractice) is a broad term that refers to the delivery of health services when distance separates the users (American Speech-Language-Hearing Association, 2005). Benefits for the patient include saving considerable travel time and expense, significantly less time lost from work and/or school, and easy access to otherwise inaccessible clinical services. Another potential use of telehealth for CI recipients is to expand opportunities for research participation and to provide a mechanism for recruitment of minority subjects for research centers that are located in less diverse geographical areas.
A number of obstacles must be overcome before research experiments or clinical CI services can be delivered routinely via remote technology. First, there are technical aspects related to the procedures themselves, such as providing adequate audio and video signals for patients to hear and/or lipread the clinician or researcher, troubleshooting hardware at the remote end, and administering speech-perception tests at known sound pressure levels (SPLs) to accurately document performance over time. Second, present clinical CI programming software and hardware have not been validated by the CI manufacturers or approved by the Food and Drug Administration (FDA) for remote use (Franck, Pengelly, & Zerfoss, 2006). Third, issues related to multistate licensing and reimbursement for services need to be resolved (Denton & Gladstone, 2005). Finally, it has not been well-documented whether measures obtained via remote access yield the same results as those obtained in traditional face-to-face sessions for CI recipients. This last obstacle is the focus of the present study.
Few studies have empirically assessed the feasibility of using telehealth for CI service delivery (Ramos et al., 2009; McElveen et al., 2010; Wesarg et al., 2010). Ramos et al. (2009) performed remote programming with five Advanced Bionics (AB) 90K recipients using a split design (i.e., equal number of sessions with remote condition first and with the standard condition first). They found no significant differences between standard and remote measures for speech-processor program (map) M-levels (most-comfortable loudness levels). Sound-field thresholds and speech perception (open-set disyllabic words) were evaluated in the traditional face-to-face setting with maps made in the standard versus remote settings. No significant differences in these two outcomes were seen for standard versus remote maps. Electrode impedance and electrically evoked compound action potential (ECAP) measurements were also obtained, but those results were not reported.
In a more recent study, McElveen et al. (2010) compared pre-operative pure-tone averages (PTAs), post-operative aided PTAs, and speech perception from a group of seven Nucleus recipients programmed locally versus a different group of seven Nucleus recipients programmed remotely. Results showed no significant difference in speech perception between the groups, but there was a significant difference in post-operative aided PTAs. These outcomes may have been due to individual differences between the two small groups of subjects. Subjects were not matched, but the groups did have similar durations of deafness, the same internal device type (Nucleus Freedom), and were programmed by the same audiologist. The investigators did not compare the map levels (T- and C- levels) for the subjects programmed remotely versus locally; rather, they compared outcome measures obtained with those maps. As in the Ramos et al. (2009) study, the actual outcome measures (PTA and speech perception) were obtained in the standard face-to-face setting, and not using remote procedures.
Finally, Wesarg et al. (2010) compared map levels for remote versus local fittings with a larger sample of 69 Nucleus recipients from four centers, also using a split design. Results showed no significant differences in map thresholds (T-levels) and upper comfort levels (C-levels). However, different programming techniques were used across centers, resulting in statistically significant effects of center. In sum, there do not appear to be any published studies that have evaluated a comprehensive battery of measures with CI recipients (e.g., map levels, speech perception, electrode impedance, physiological measures, research-specific measures) using controlled methods and a relatively large number of subjects.
The goal of the present study was to demonstrate the feasibility and effectiveness of conducting research and clinical measures with CI recipients via telehealth. Specific measurements included: (1) electrode impedance, (2) ECAP thresholds, (3) psychometric thresholds using an adaptive procedure, (4) speech-processor program levels (behavioral threshold and upper comfort levels), and (5) speech-perception tests. All measures were made using remote and face-to-face sessions within subjects to allow for direct comparison across sessions. Finally, a questionnaire was given to all subjects allowing them to rate their experience with the remote visit compared to face-to-face sessions. It was hypothesized that there would be no statistically significant differences in these five measures between the two types of sessions.
METHODS
Subjects
Twenty nine adult and pediatric CI recipients participated (mean age: 46 years; range: 11–87 years). Table 1 outlines pertinent demographic information for participants. Enrollment was limited to individuals with either the newer generation Nucleus (N24, N24RE, or CI512) or AB (CII or 90K) devices because those devices have telemetry capabilities necessary for impedance and ECAP measures. All but one subject (N5) had at least one year of CI experience (see Table 1). All subjects signed an informed consent and were compensated for mileage and hourly participation. This study was approved by the Boys Town National Research Hospital (BTNRH) Institutional Review Board under protocol 03-07-XP.
Table 1.
Demographic information for study participants.
| Subj. # | Age (y) | Internal Device | Processor | Daily-Use Strategy, Per-Channel Rate | Dur. CI Use (y,m) | Remote Site | #Days From Visit 1 to 3 |
|---|---|---|---|---|---|---|---|
| C1 | 25 | AB CII | CII BTE | HiRes-P, 2784 pps | 7,7 | Lincoln | 9 |
| C8 | 62 | AB CII | Harmony | HiRes-P w/Fidelity 120, 3712 pps | 7,0 | Lincoln | 6 |
| C14 | 15 | AB CII | Auria | CIS, 829 pps | 9,9 | Lincoln | 28 |
| C17 | 13 | AB 90K | PSP | HiRes-P w/Fidelity 120, 3712 pps | 5,1 | Lincoln | 5 |
| C18 | 39 | AB 90K | Auria | HiRes-S, 1289 pps | 3,3 | Kearney | 29 |
| C23 | 77 | AB CII | Harmony | HiRes-P w/Fidelity 120, 2320 pps | 7,6 | Kearney | 17 |
| C24 | 76 | AB CII | Harmony | HiRes-S w/Fidelity 120, 2900 pps | 9,1 | Vermillion | 5 |
| C26 | 70 | AB 90K | Harmony | HiRes-S w/Fidelity 120, 2750 pps | 2,7 | Lincoln | 3 |
| C27 | 47 | AB CII | PSP | HiRes-P, 3480 pps | 7,6 | Kearney | 7 |
| C29 | 33 | AB 90K | Harmony | HiRes-S w/Fidelity 120, 3712 pps | 2,3 | Lincoln | 18 |
| C32 | 82 | AB 90K | Auria | HiRes-P, 2677 pps | 5,11 | Vermillion | 21 |
| C33 | 37 | AB 90K | Harmony | HiRes-S w/Fidelity 120, 3712 pps | 1,4 | Kearney | 9 |
| C35 | 87 | AB 90K | Harmony | HiRes-S w/Fidelity 120, 1024 pps | 2,9 | Lincoln | 9 |
| C39 | 65 | AB90K | Harmony | HiRes-S w/Fidelity 120, 3712 pps | 2,5 | Lincoln | 9 |
| F2 | 62 | Nucleus 24RE | Freedom | ACE, 1200 pps | 2,5 | Kearney | 2 |
| F4 | 19 | Nucleus 24RE | Freedom | ACE, 900 pps | 2,5 | Kearney | 24 |
| F5 | 51 | Nucleus 24RE | Freedom | ACE, 900 pps | 2,9 | Lincoln | 7 |
| F7 | 41 | Nucleus 24RE | Freedom | ACE, 900 pps | 2,9 | Lincoln | 7 |
| F9 | 62 | Nucleus 24RE | Freedom | ACE, 900 pps | 1,0 | Lincoln | 5 |
| F10 | 13 | Nucleus 24RE | CP810 | ACE, 900 pps | 4, 12 | Vermillion | 22 |
| F13 | 38 | Nucleus 24RE | Freedom | ACE, 1800 pps | 3,0 | Lincoln | 14 |
| N4 | 14 | Nucleus CI512 | CP810 | ACE, 720 pps | 1, 4 | Vermillion | 7 |
| N5 | 51 | Nucleus CI512 | CP810 | ACE, 720 pps | 0,4 | Lincoln | 13 |
| R2 | 59 | Nucleus 24RCS | Freedom | ACE, 500 pps | 7,5 | Lincoln | 54 |
| R7 | 68 | Nucleus 24RCS | Freedom | ACE, 900 pps | 6,6 | Vermillion | 12 |
| R10 | 69 | Nucleus 24RCS | ESPrit 3G | ACE, 1200 pps | 7,11 | Vermillion | 12 |
| R13 | 49 | Nucleus 24RCS | Freedom | ACE, 1200 pps | 5,10 | Lincoln | 6 |
| R14 | 13 | Nucleus 24RCS | Freedom | ACE, 900 pps | 5,11 | Vermillion | 30 |
| R15 | 11 | Nucleus 24RCS | Freedom | ACE, 900 pps | 9,8 | Kearney | 11 |
AB = Advanced Bionics; pps = pulses per second (per channel); y,m = years, months. Duration of CI use was calculated relative to Visit 1. Age was calculated relative to Visit 1.
Study Design
This was a prospective study using an ABA design, in which the first session (A) occurred in the Cochlear Implant Laboratory at BTNRH (Omaha, Nebraska), the second session (B) at the remote site, and the third session (A) at BTNRH. To further minimize any potential longitudinal effects, all three sessions were completed within an average of 14 days (range: 2–54 days between the first and last visit; see Table 1), and attempts were made to recruit subjects with at least one year of CI experience. All measures were repeated within each session to obtain a measure of within-session variability.
Remote test sites
For each subject, one of three potential remote test sites was used: the University of Nebraska-Lincoln (approximately 60 miles southwest of BTNRH), the University of South Dakota (Vermillion; approximately 135 miles north), and Good Samaritan Hospital in Kearney, Nebraska (approximately 190 miles west). These locations were chosen based on (1) existing Polycom (Clary Business Machines Co., Pleasanton, California, USA) videoconferencing technology at those sites, (2) previous experience connecting with those sites, and/or (3) the relative population density of CI recipients in each area. For individual subjects, the choice of remote site was based on the proximity to their home. Rooms at the remote sites were small conference rooms equipped with videoconferencing technology, not sound-treated booths. Remote-site support personnel were intentionally chosen to not have specialized knowledge of CIs, as this represents a more realistic application of distance CI services. Remote-site personnel were either graduate students in audiology (two university sites) or had a background in nursing (hospital site). Their responsibilities included setting up the testing equipment (laptop computer, programming interfaces, videoconferencing equipment), assisting with calibration of speech materials, greeting the subject upon arrival, and monitoring the videoconferencing connection during the session.
Remote-site equipment setup
Each remote site was provided with a Dell Latitude E6400 laptop with an encrypted hard drive and Windows XP. Laptops were loaded with the following specialized CI software: Custom Sound and Custom Sound EP (v. 2.0 with upgrade to 3.2 during this study; Cochlear Americas, Centennial, CO), Nucleus Implant Communicator (NIC v. 2) subroutines (Cochlear Ltd., Lane Cove, New South Wales, Australia), SoundWave (v. 1.4.77 with upgrade to 2.0 during this study; AB, Valencia, CA), and the Bionic Ear Data Collection System (BEDCS v. 1.18.295; AB, Sylmar, CA). The following speech-processor interfaces and corresponding programming cables were also provided: programming pod (for Nucleus Freedom or CP810 speech processors), portable programming system (PPS, for 3G speech processors), and clinical programming interface (CPI II, for all AB processors). The PPS and CPI II were attached to the laptop's USB port via a serial-to-USB adaptor (IOGEAR USB to Serial Adapter, Model GUC232A, Irvine, CA). Laptops were connected to the internet via a local Ethernet connection.
The following Polycom videoconferencing equipment was used at each remote site: Lincoln, VSX 4000; Kearney, VSX 7000; and Vermillion, VSX 8000. Polycom systems consist of a built-in videocodec (allows for videoconferencing), speakers, and a tabletop pod microphone. Connections between the Kearney and BTNRH Polycom systems were mediated via the Nebraska Telehealth Network, which uses a Media Gateway Controller (MGC+100) ReadiConvene bridge (a certified Network Security Alliance-compliant firewall). For connection to the Vermillion and Lincoln sites from BTNRH, a direct call was made between the Polycom systems (similar to a phone call, as a communication bridge was not available). The Polycom system at BTNRH provided an encrypted signal for connections to Vermillion and Lincoln. Internet connection speeds for Kearney and Vermillion were 20 Mbps and 1 Gbps, respectively. In Lincoln, internet connection speeds varied due to an auto-select system at that site. Cisco ASA (San Jose, CA) internet firewalls were used by both the Lincoln and Vermillion sites; FortiGate-50B (Sunnyvale, CA) was used by Kearney.
During the initial setup of the equipment, a designated videoconferencing person from each site was instructed how to connect the peripheral hardware to the laptop. Illustrated step-by-step instructions were also left at each site with the laptop and hardware for reference, if needed. Additional information and demonstrations were provided via the videoconferencing link as needed.
Control-site equipment setup
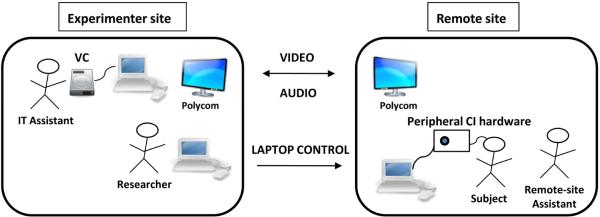
The experimenter site for Visit 2 was a conference room located at BTNRH. The room was equipped with two Dell Latitude laptops running Windows XP, a Polycom system (VSX 7000), and a Visual Concert VSX for Polycom. The first laptop was used solely with the Visual Concert for data sharing of the speech perception materials, allowing for direct delivery of the speech materials to the Polycom system at the remote site. The Polycom system at BTNRH had its own dedicated encrypted network for connection to outside Polycom systems, which obviates the need for additional firewall technology. The second Dell laptop, used to control the remote-site laptop, was on an internet connection with a 3-MB bandwidth capability. This laptop commanded the remote-site laptop via a secure socket-layer virtual private network (SSLVPN), which creates an encrypted tunnel between the two computers. An IT assistant was present at the control site to operate the Visual Concert and to ensure the Polycom connection was stable. Figure 1 shows a schematic of the equipment setup and communication directionality between the experimenter and remote sites.
Figure 1.
Schematic of the equipment setup and connection between the experimenter site and the remote sites. VC=visual concert.
Additional privacy safeguards
Laptops at the remote sites were encrypted with password-protected hard drives and were stored in a locked facility when not in use. Usernames and passwords for the remote sites were supplied to the designated remote-site assistant at the time of set-up. A separate login and password were used to access the Custom Sound and Custom Sound EP software; this password was not provided to the remote site. To ensure that data were not accessed locally after completion of the data collection session, data were emailed to the experimenter site using encrypted email. Once the experimenter site had confirmed the successful arrival of the data via email, data were deleted from the remote-site hard drive. The remote-site computer was powered down and the video call was disconnected at the end of each session.
Acoustical Measurements
Because all three remote sites lacked sound booths, background noise levels and reverberation were measured for each test room (including the laboratory sound booth, for comparison). Background noise levels were made using a Type I integrating sound-level meter (Larson Davis, model 824) and consisted of the average of three measurements for octave bands spanning from 31.5 Hz to 16,000 Hz. Reverberation (the time it takes for sound to decay in an environment by 60 dB) was calculated as a T30 according to ISO 3382 (ISO, 1997), where a least-squares fit of 30 dB on the measured energy decay curve was calculated and extrapolated to 60 dB. Monaural impulse responses were measured using a 50-second logarithmic sinusoid-sweep excitation signal (24-bit resolution analog-digital conversion, 48-kHz sampling rate) with a Focal CMS-40 loudspeaker as the sound source.
Experimental Measures
The following five experimental measures were made for each subject at each visit: electrode impedance, ECAP thresholds, psychophysical thresholds, programming levels, and speech perception. A questionnaire was administered at the final visit. Electrode impedances were always measured first to ensure that malfunctioning electrodes were not used in the experimental protocol. The remaining four measures were obtained in a randomized order. All five measures were then repeated in the same order within each visit to assess within-session variability (i.e., total of two measurements per visit). Test order was randomized separately for each visit. The following sections detail the specific methodology for each measure.
1. Impedance
Impedances were measured for all electrodes using standard clinical programming software. SoundWave was used for AB subjects, which only measures impedance in monopolar (MP) mode. Both Custom Sound and Custom Sound EP were used for Nucleus subjects; measures were made once with each program (for a total of two times) per visit in all four available electrode coupling modes (common ground, MP1, MP2, and MP1+2; these are the software defaults). For Nucleus recipients, only data for MP1+2 are reported here because that is the standard coupling mode used for programming. Impedances were averaged across all electrodes within each subject for each measurement/visit. This was done to remove the expected variance in impedance resulting from differences in electrode dimensions across devices and across the array within devices.
2. ECAP thresholds
ECAP thresholds were obtained for one basal and one apical electrode (typically E14 and E3 for AB, and E3 and E17 for Nucleus). For all participants, ECAP measures were obtained using software for typical “clinical” and “research” applications. For Nucleus devices, ECAPs were measured using AutoNRT1 (“clinical” measure) and Advanced NRT (“research” measure) in the Custom Sound EP software. For AutoNRT, ECAPs were obtained using a forward-masking paradigm (e.g., Abbas et al., 1999) and thresholds were determined via an automated computer algorithm based on a visual detection method (Botros, van Djik, & Killian, 2007; van Dijk et al. 2007). For Advanced NRT, default stimulus and recording parameters were used (i.e., masker-probe offset of +10 current-level units [CL], forward masking for artifact reduction). Peak markers were adjusted as necessary based on visual inspection by the investigators. The software plots peak-to-peak amplitudes as a function of probe level and then applies a linear regression to estimate threshold. The regression-based threshold (T-NRT) is the probe level at which the regression line predicts a zero-amplitude ECAP.
For AB devices, ECAPs were measured using Neural Response Imaging (NRI), a feature within the SoundWave clinical programming software, and BEDCS. NRI was used as the “clinical” measure while ECAPs recorded in BEDCS were used as the “research” measure. For NRI, ECAPs were obtained using alternating polarity for artifact reduction. Like Advanced NRT, NRI uses linear regression to estimate threshold (t-NRI)2. For this study, peak markers were not adjusted in NRI. For BEDCS (the “research” measures), a forward-masking paradigm was used (e.g., Abbas et al., 1999). The masker was fixed at a level in the upper portion of the subject's behavioral dynamic range and the probe level was reduced until no response was visually identifiable. ECAPs were read into a custom Matlab (Mathworks Inc., Natick, MA) program, and peaks were marked by the investigators. ECAP thresholds were identified as the lowest probe level that yielded a measurable response.
3. Psychophysical thresholds
Experimentally-based psychophysical thresholds were evaluated for two reasons: (1) the measurements use non-FDA-approved software that to our knowledge has not been assessed in the remote condition (unlike the clinical software), and (2) these measurements represent a very common procedure used for experimental psychophysical testing. For Nucleus recipients, psychophysical thresholds were obtained using a custom program written in Visual Basic that implemented NIC subroutines. For AB recipients, thresholds were obtained using a custom program in BEDCS. A 3-interval, forced-choice, adaptive procedure (3-down, 1-up) was used to determine behavioral thresholds for the same two basal/apical electrodes used for ECAP thresholds and programming levels. The stimulus was a 300-ms, 900-pps pulse train consisting of 25-usec/phase charge-balanced biphasic pulses.
4. Programming levels
Speech-processor map levels were measured using commercial clinical software and standard clinical programming techniques for the same two basal and apical electrodes used for ECAP and psychophysical measures. The subject's current map was used to measure levels so that the talk-over feature could be enabled to instruct the subject. For Nucleus recipients, the Custom Sound clinical programming software was used. T-levels (behavioral threshold levels) were obtained using a traditional bracketing procedure (step size of 6 CL down and 2 CL up) where subjects were asked to count the number of beeps they heard. Threshold was taken as the level where correct counts were given for two trials. C-levels (upper loudness comfort levels) were obtained using repeated ascending steps (2-CL increments) until the subject indicated that the sound was loud but still comfortable (rating of seven on a 10-point loudness scale). C-level was determined as the average of two repetitions. For AB recipients, the SoundWave clinical programming software was used. T-levels were obtained with tone bursts using an ascending approach until the subject indicated that the sound was “just noticeable.” For most-comfortable levels (M-levels), stimulation was increased in an ascending manner until the subject indicated that the sound was most comfortable (rating of six on a 10-point loudness scale). Both T- and M-levels were determined by averaging two repetitions per measure. A numeric rating scale was used to assist subjects with determining T and C- or M-levels.
5. Speech perception
Speech perception was measured using the following tests: one list of the Consonant-Nucleus-Consonant (CNC; Peterson & Lehiste, 1962) monosyllabic words in quiet, two lists of the Hearing in Noise Test (HINT; Nilsson, Soli, & Sullivan, 1994) measured in quiet, and one list of the Bamford-Kowal-Bench Sentences-In-Noise (BKB-SIN; Bench, Kowal, & Bamford, 1979). For the laboratory test sessions (visits 1 and 3), speech stimuli were delivered via CD recordings attenuated through a Grason-Stadler (GSI) 61 audiometer. Subjects were seated in a sound booth and stimulus levels were calibrated to 60 dB SPL (A) using a Radio Shack Digital Sound Level Meter. For remote-site testing, participants were instructed to face the television monitor/speaker in the test room. Speech stimuli were digitized and delivered via direct connection to a Visual Concert module connected to the Polycom system as described above. The remote-site assistant calibrated the presentation level of the speech materials to 60 dB SPL (A) at the level of the subject's processor microphone using the same type of sound level meter used at the experimenter site. For each test, subjects were instructed to repeat back what they heard. Speech-perception lists were randomly selected for each session, but were verified to ensure that they were not repeated across trials or visits. All speech-perception measures were made in the CI-only condition using the subject's everyday speech processor and settings.
6. Questionnaire
At the end of Visit 3, subjects were asked to complete a short questionnaire (11 questions) comparing their experiences with the remote session versus the face-to-face sessions. Questions included comparisons of specific aspects of the remote and face-to-face conditions, estimated travel time to the remote site versus BTNRH, whether the added technology was overwhelming, and how often they would utilize remote technology if it were available for research or clinical appointments. A final open-ended question allowed for additional comments.
Procedures
Visit 1
Visit 1 took place in the CI lab at BTNRH with the subject and researcher in the traditional face-to-face condition. At this visit, subjects completed the informed consent process and were then trained how to connect their own or a loaner speech processor to the processor interface (to prepare them for the remote-site visit). The process for connecting the processor to the programming cable involves removing the battery-pack portion of the processor (which the subject would typically do on a regular basis) and connecting the cable in a way similar to reconnecting the battery compartment (an exception was for the PSP). Subjects generally felt comfortable completing this action. The five measures were performed as described above.
Visit 2
For visit 2, the subject traveled to the designated remote site that was closest to their home while the researcher was at the experimenter site at BTNRH. Prior to the subject's arrival, the videoconference call was initiated by the assistant at the remote site. The username and passwords for the remote-site laptop were supplied to the remote-site assistant via the videoconference call. The experimenter site provided a meeting number to allow for access to and control of the remote-site computer via the SSLVPN. At that time, the experimenter site could verify connection of peripheral hardware. Finally, calibrations were conducted for the speech-perception materials as described above. Once the subject arrived, the remote-site assistant greeted the subject and led them to the room housing the remote equipment. The subject connected their processor to the programming cables, and the five test measures were conducted as described above. Before the video call was disconnected, the experimenter site confirmed via the video link that the subject was disconnected from the hardware and that the laptop had been powered down.
Visit 3
Visit 3 took place in the CI lab at BTNRH with the subject and researcher in the traditional face-to-face condition. Conditions were identical to Visit 1. This final visit controlled for potential longitudinal effects. When all experimental measures were completed, the questionnaire was administered.
RESULTS
Impedance
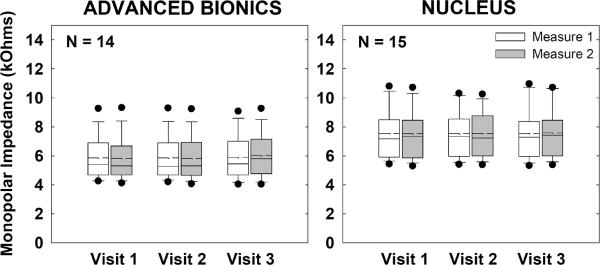
Figure 2 shows group monopolar impedance data for AB (left) and Nucleus (right) recipients. Impedances for each subject were averaged across all electrodes for each visit/measure. Boxes and whiskers represent 25%/75% and 10%/90% confidence intervals, respectively. Filled circles represent outliers. Means and medians are indicated by dashed and solid lines, respectively. Data from the first and second measurements within each visit are represented by white and gray boxes, respectively. A two-way repeated-measures analysis of variance (RM ANOVA) was used to assess the effects of visit and measure. Results showed no significant effects of visit, measure, or visit-measure interaction (p > 0.4) for either device.
Figure 2.
Box-and-whisker plots illustrating group monopolar electrode impedance data across visits and measures (Advanced Bionics, left graph; Nucleus, right graph). Boxes and whiskers represent 25%/75% and 10%/90% confidence intervals, respectively. Means and medians are indicated by dashed and solid lines, respectively. Filled circles represent outliers. Data from the first and second measurements within each visit are represented by white and gray boxes, respectively. Impedances were averaged across all electrodes for each subject at each visit/measure.
ECAP Thresholds
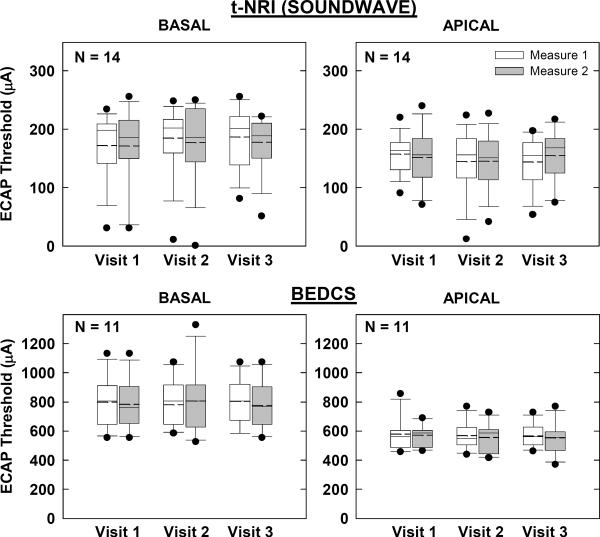
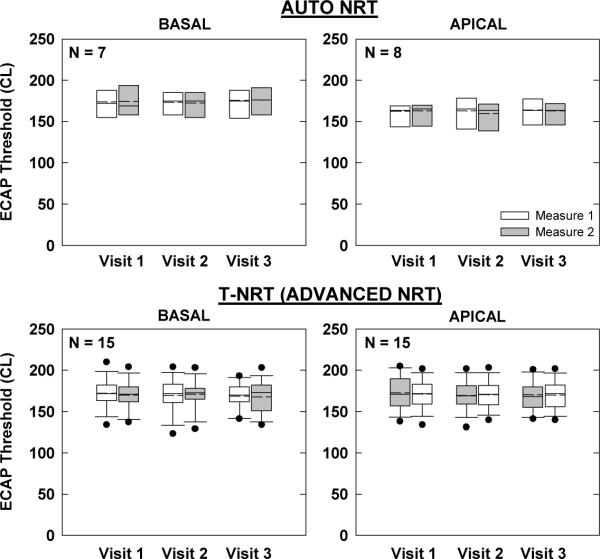
Figures 3 and 4 show group ECAP threshold data for AB and Nucleus devices, respectively. Box-and-whisker plots are as described above for Fig. 2. In each figure, the top two graphs represent the “clinical” ECAP measures, while the bottom two graphs represent the “research” measures. Basal and apical electrodes are on the left and right, respectively. Not all participants had measurable ECAPs, as indicated by smaller sample sizes in each graph. Further, AutoNRT is only a feature of newer generation Nucleus devices (24RE and CI512); therefore, the N for AutoNRT is smaller than for Advanced NRT (Fig. 4).
Figure 3.
Box-and-whisker plots illustrating electrically evoked compound action potential (ECAP) thresholds for Advanced Bionics recipients across visits and measures. Top: ECAP thresholds using default settings in SoundWave with linear regression applied to computer-picked peaks (tNRI). Bottom: ECAP thresholds using forward masking in BEDCS with visual-detection threshold determination. Basal and apical electrodes are shown in the left and right columns, respectively.
Figure 4.
Box-and-whisker plots illustrating electrically evoked compound action potential (ECAP) thresholds for Nucleus recipients across visits and measures. Top: ECAP thresholds using AutoNRT in Custom Sound EP. (Whiskers and outliers not calculated due to small sample size.) Bottom: ECAP thresholds using default settings in Advanced NRT (Custom Sound EP) with linear regression applied to computer-picked peaks (T-NRT). Basal and apical electrodes are shown in the left and right columns, respectively.
For the AB “clinical” measures obtained with SoundWave (Fig. 3, top), a two-way RM ANOVA showed no significant effect of visit, measure, or visit-measure interaction for either basal (p > 0.06) or apical (p > 0.3) electrodes. Results for the “research” measures obtained with BEDCS (Fig. 3, bottom) also showed no significant effects of visit, measure, or visit-measure interaction for either basal (p > 0.1) or apical (p > 0.1) electrodes.
For the Nucleus “clinical” AutoNRT measures (Fig. 4, top), a two-way RM ANOVA showed no significant effect of visit, measure, or visit-measure interaction for either basal (p > 0.1) or apical (p > 0.1) electrodes. For the “research” Advanced NRT measures (Fig. 4, bottom), there was also no significant effect of visit, measure, or visit-measure interaction for either basal (p > 0.4) or apical (p > 0.2) electrodes.
Psychophysical Thresholds
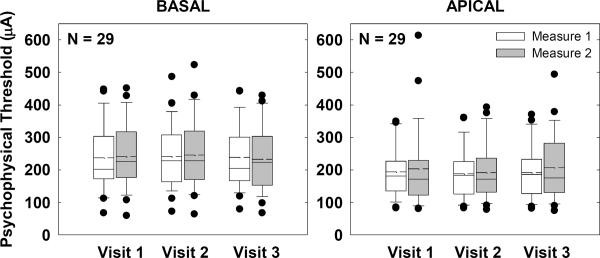
Figure 5 shows box-and-whisker plots for group psychophysical thresholds across visits and measures for basal (left) and apical (right) electrodes. Because the same stimuli and procedures were used for this task, thresholds from all subjects were expressed in microamperes and combined across manufacturers. A two-way RM ANOVA revealed no significant effect of visit, measure, or visit-measure interaction for either basal (p > 0.4) or apical (p > 0.2) electrodes.
Figure 5.
Box-and-whisker plots illustrating psychophysical thresholds for all subjects across visits and measures. Data from all subjects were expressed in microamperes and combined across manufacturers. Basal and apical electrodes are shown in the left and right graphs, respectively.
Programming Levels
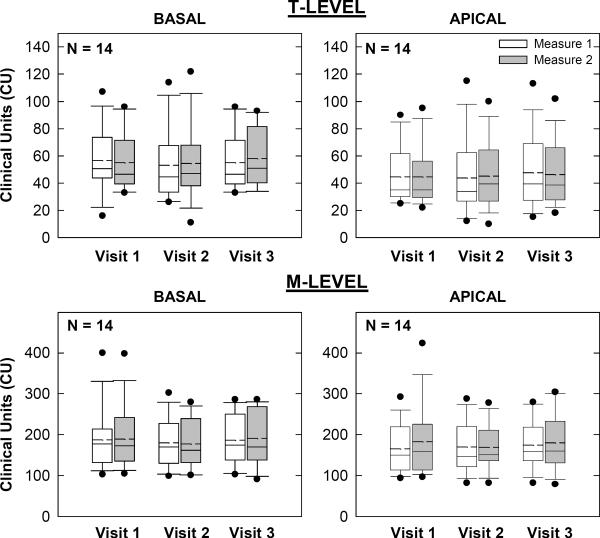
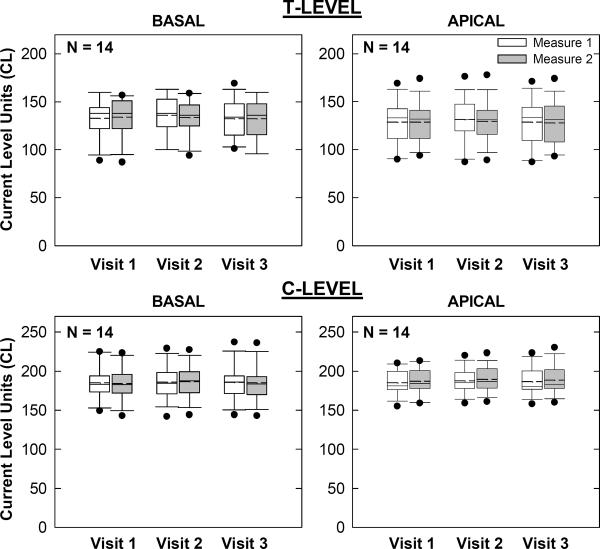
Figures 6 and 7 show group programming levels for AB and Nucleus recipients, respectively. Box-and-whisker plots are as described above. In each figure, the top and bottom sets of graphs show map thresholds and upper-comfort levels, respectively. Basal and apical electrodes are on the left and right, respectively. For AB recipients (Fig. 6), a two-way RM ANOVA revealed no significant effect of visit, measure, or visit-measure interaction for either basal (p > 0.2) or apical (p > 0.4) T-levels. For M-levels, there was also no significant effect of visit, measure, or visit-measure interaction for either basal (p > 0.3) or apical (p > 0.1) electrodes.
Figure 6.
Box-and-whisker plots illustrating map thresholds (T-levels; top row) and most-comfortable levels (M-levels; bottom row) for all AB subjects across visits and measures. Basal and apical electrodes are shown in the left and right columns, respectively.
Figure 7.
Box-and-whisker plots illustrating map thresholds (T-levels) and comfort levels (C-levels) for 14 of the 15 Nucleus subjects across visits and measures. Data could not be obtained for one subject at any visit (see text). Basal and apical electrodes are shown in the left and right columns, respectively.
For Nucleus recipients (Fig. 7), a two-way RM ANOVA revealed no significant effect of visit, measure, or visit-measure interaction for either basal (p > 0.1) or apical (p > 0.1) T-levels. For C-levels, there was also no significant effect of visit, measure, or visit-measure interaction for basal (p > 0.3) electrodes. There was, however, a significant effect of measure for apical C-levels (p = 0.02, F = 7.4, d.f. = 1), where the second measure was, on average, 2 CL higher than the first measure. There was no significant effect of visit (p = 0.3) or visit-measure interaction (p = 0.9) for apical C-levels. It should be noted that in Fig. 7, map data for one subject (N4) could not be obtained at any visit due to an unresolved issue with Custom Sound; therefore data from only 14 of the 15 Nucleus recipients are shown.
Speech Perception
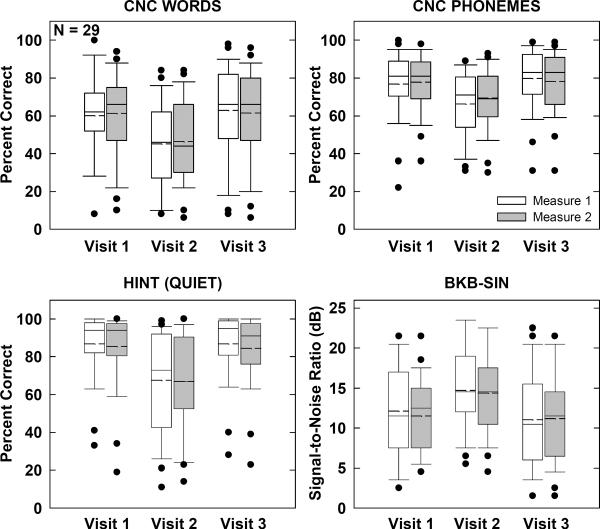
Figure 8 shows group speech-perception results across visits and measures for each of the four speech-perception tests. Box-and-whisker plots are as described above. A two-way RM multivariate ANOVA (MANOVA) was used to assess CNC results because responses were scored for both words and phonemes (i.e., two dependent variables). Results for CNCs (Fig. 8, top row) showed a significant main effect of visit (p < 0.001). Mean scores were 14% (words) and 10% (phonemes) poorer at Visit 2 (remote site) compared with the average for Visits 1 and 3. There was no significant main effect of measure (p = 0.3) or visit-measure interaction (p = 0.2). The MANOVA results are listed in Table 2.
Figure 8.
Box-and-whisker plots illustrating speech-perception scores for all subjects. Top: Consonant-Nucleus-Consonant results scored for words correct (left) and phonemes correct (right). Bottom: Hearing-in-Noise Test scores for sentences in quiet (left) and Bamford-Kowal-Bench Sentences in Noise scores (right).
Table 2.
Multivariate analysis of variance results for CNC words and phonemes.
| Multivariatec,d | |||||||
|---|---|---|---|---|---|---|---|
|
| |||||||
| Within Subjects Effect | Value | F | Hypothesis df | Error df | Sig. | Partial Eta Squared | |
| visit | Pillai's Trace | .656 | 10.735 | 4.000 | 88.000 | .000 | .328 |
| Wilks' Lambda | .359 | 14.408a | 4.000 | 86.000 | .000 | .401 | |
| Hotelling's Trace | 1.749 | 18.366 | 4.000 | 84.000 | .000 | .467 | |
| Roy's Largest Root | 1.726 | 37.970b | 2.000 | 44.000 | .000 | .633 | |
|
| |||||||
| measure | Pillai's Trace | .105 | 1.233a | 2.000 | 21.000 | .312 | .105 |
| Wilks' Lambda | .895 | 1.233a | 2.000 | 21.000 | .312 | .105 | |
| Hotelling's Trace | .117 | 1.233a | 2.000 | 21.000 | .312 | .105 | |
| Roy's Largest Root | .117 | 1.233a | 2.000 | 21.000 | .312 | .105 | |
|
| |||||||
| visit * measure | Pillai's Trace | .128 | 1.503 | 4.000 | 88.000 | .208 | .064 |
| Wilks' Lambda | .875 | 1.489a | 4.000 | 86.000 | .213 | .065 | |
| Hotelling's Trace | .140 | 1.474 | 4.000 | 84.000 | .217 | .066 | |
| Roy's Largest Root | .115 | 2.525b | 2.000 | 44.000 | .092 | .103 | |
Exact statistic
The statistic is an upper bound on F that yields a lower bound on the significance level.
Design: Intercept
Within Subjects Design: visit + measure + visit * measure
Tests are based on averaged variables.
For HINT sentences in quiet (Fig. 8, bottom left), a two-way RM ANOVA revealed a significant effect of visit (p < 0.001, F = 31.6, d.f. = 2), but no significant effect of measure (p = 0.2) or visit-measure interaction (p = 0.7). Mean scores for Visit 2 were 19% poorer than the average for Visits 1 and 3. Similarly, there was a significant effect of visit (p < 0.001, F = 18.4, d.f. = 2) for BKB-SIN scores (Fig. 8, bottom right). Mean scores for Visit 2 were 3.1 dB poorer than the average for Visits 1 and 3. There was no significant effect of measure (p = 0.5) or visit-measure interaction (p = 0.7).
Because of the overall decrement in performance across the three remote sites, it was of interest to examine the overall background noise levels and reverberation times for the three remote sites in comparison with the laboratory sound booth. Results are shown in Fig. 9. Overall, the Vermillion site had the highest level of background noise and longest reverberation times. As expected, the sound booth had the lowest background noise (up to the 1000-Hz octave band) and shortest reverberation times. When the full octave-band range was examined, there was no significant difference in background noise across the four test sites (p = 0.07, Kruskal-Wallis one-way ANOVA on ranks). However, when only the octave bands coded by CI processors was examined (125–8000 Hz), there was a significant effect of site (p = 0.03, H = 8.9, d.f. = 3). Post-hoc analyses (Dunn's Method) showed significantly higher background noise for Vermillion versus the sound booth (p < 0.05). One-way ANOVA results for reverberation showed a statistically significant effect of site (p < 0.001, F = 28.2, d.f. = 3). Post-hoc pairwise comparisons (Holm-Sidak) showed significantly longer reverberation times for Vermillion versus each of the other three sites (p < 0.002), and significantly shorter reverberation times for the sound booth versus all three remote sites (p < 0.001). The only comparison that was not significantly different was Lincoln versus Kearney.
Figure 9.
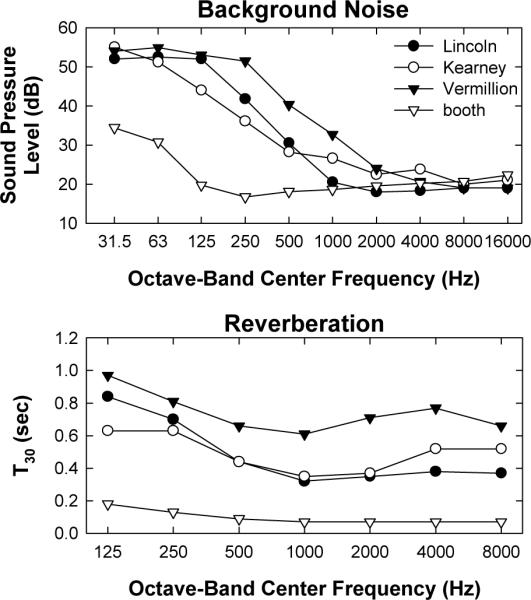
Background noise levels (top) and reverberation times (bottom) for the three remote sites and laboratory sound booth. T30 represents the amount of time (in seconds) for the signal to decay by 30 dB.
Because of the differences in room acoustics across sites, speech perception was examined as a function of site. First, the average of the two measures from Visit 2 was subtracted from the average across Visits 1 and 3 (two measures per visit) to obtain a difference score for each subject. Difference scores were compared across sites. This method controlled for potential differences in the overall distribution of scores across sites. A one-way ANOVA showed a significant effect of site for HINT sentences (p = 0.04, H = 6.6, d.f. = 2; Kruskal-Wallis) and CNC words (p = 0.004, F = 6.9, d.f. = 2). The only significant post-hoc comparisons (Holm-Sidak) were for CNC words, where there was a larger drop at Visit 2 for the Vermillion site than for Lincoln (p = 0.001, t = 3.6) or Kearney (p 0.007, t = 2.9). There was no significant site effect for BKB-SIN or CNC phonemes (p > 0.2).
Questionnaire
The first five questions asked subjects to compare travel expenses to the site (Q1), efficiency of test procedures (Q2), quality of the test room (Q3), appointment check-in process (Q4), and ease of communication (Q5) between the remote and face-to-face visits. Subjects indicated their response by checking the appropriate box from the following five options, where the remote site was viewed as: much worse, slightly worse, the same, slightly better, or much better. Answers were then converted to numeric scores on a continuum from 1 (remote site much worse) to 5 (remote site much better). Mean scores (+1 SD) for questions 1–5 are shown in Figure 10. The horizontal dashed line indicates the point where the remote and face-to-face visits were judged to be equal. A one-sample, two-tailed t-test was used to determine if the mean score was significantly different from 3 (“the same”). Question 1 (compare travel expenses) was the only one for which the remote site was judged as significantly better than the lab at BTNRH (t = 2.8, p < 0.01, d.f. = 28). Responses were likely biased by the fact that subjects were recruited based on their geographic proximity to either Omaha or the three remote sites. For Questions 2–5, the remote site was judged as significantly worse than the lab (t = −2.5, p = 0.02; t = −5.9, p < 0.001; t = −2.5, p < 0.02; t = −3.0, p < 0.01, respectively).
Figure 10.
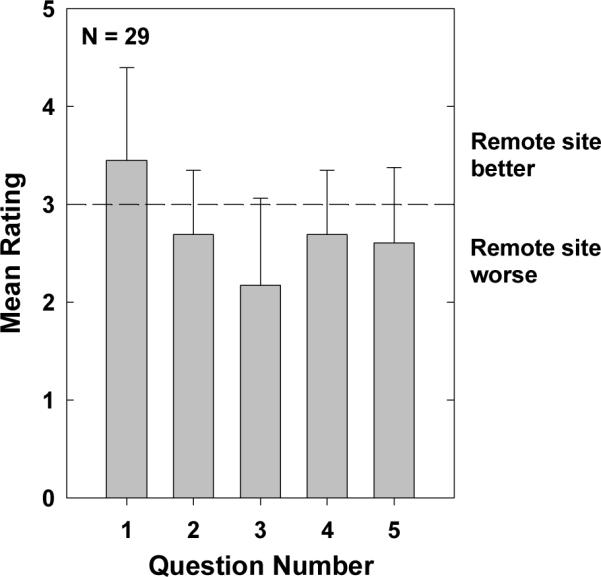
Mean scores for questions 1–5 on the questionnaire administered at Visit 3. Responses were converted to numeric scores as follows: 1 = remote site much worse, 2 = remote site somewhat worse, 3 = no difference, 4 = remote site somewhat better, and 5 = remote site much better. Questions 1–5 asked subjects to compare travel expenses, ease of test procedures, test room, appointment check-in process, and ease of communication (respectively) between the remote and face-to-face visits. Error bars represent 1 standard deviation.
Questions 6–7 asked participants to estimate the average travel time between their home and BTNRH (Q6) and the remote site (Q7). On average, the travel time between the subject's home and BTNRH was approximately 1 hour and 45 minutes, whereas travel time between the subject's home and the closest remote site was approximately 1 hour. Questions 8–10 asked participants if they ever felt overwhelmed by the distance technology (Q8), and how often they would take advantage of telehealth for research (Q9) or clinical (Q10) appointments. Answers were converted to numeric scores on a continuum from 1 (never/not at all) to 3 (yes/always). On average, participants did not feel overwhelmed by the technology at the remote location (mean = 1.2, SD = 0.5). Only five subjects gave ratings higher than 1 (four subjects rated 2 and one rated 3); their ages ranged from 13 to 69 years. Participants indicated that they would take advantage of remote testing some of the time, if it were routinely available for research appointments (mean = 2.1, SD = 0.5) or clinical appointments (mean = 1.9, SD = 0.5).
Session Duration
The amount of time spent to complete data collection for each session was compared to determine whether the remote session was substantially longer than the face-to-face session. Because extra measures were made at the first visit (dynamic ranges for ECAP and psychophysical measures), the session duration for the remote session (Visit 2) was compared with that for the last face-to-face session (Visit 3). On average, the remote session took 138 minutes (SD = 27 min.) and the last face-to-face visit took 131 minutes (SD = 33 min.). However, the questionnaire was administered only at Visit 3 (the questionnaire took approximately 5 minutes to complete). Duration of the remote visit did not include time to place the videoconference call or connection to the remote computer. Once the investigators became familiar with the remote setup, that portion only took approximately 5 minutes.
DISCUSSION
A number of studies have evaluated the use of telehealth for various audiological measures such as pure-tone thresholds (Givens & Elangovan, 2003; Choi, Lee, Park, Oh, & Park, 2007; Krumm, Ribera, & Klich, 2007), distortion-product otoacoustic emissions (Krumm et al., 2007; Krumm, Huffman, Dick, & Klich, 2008), and auditory brainstem responses (Towers, Pisa, Froelich, & Krumm, 2005; Krumm et al., 2008). To date, there have been a limited number of reports examining the use of telehealth for CIs (Franck et al., 2006; Shapiro, Huang, Shaw, Roland, & Lalwani, 2008; Ramos et al., 2009; McElveen et al., 2010; Wesarg et al., 2010). The majority of these studies have focused on evaluating map levels (Franck et al., 2006; Ramos et al., 2009; McElveen et al., 2010; Wesarg et al., 2010). Only one has reported on impedance, ECAP, and stapedial reflex measures (Shapiro et al., 2008), but the focus of that study was the efficiency of using telehealth for intraoperative testing, not a validation of the measurements themselves. One study with normal-hearing subjects (Ribera, 2005) evaluated the administration and scoring of HINT sentences using telehealth; there do not appear to be any published reports examining telehealth-based speech perception with CI recipients.
The present study is the first empirical examination of the use of telehealth for a wide range of research- and clinically-based measures in a relatively large group of CI listeners. This study used a repeated-measures design, which controlled for longitudinal effects and within-session measurement variability. In general, the results from this study showed no significant differences for the electrode-specific measures (impedance, ECAP thresholds, psychophysical thresholds, and map levels) conducted remotely versus face-to-face. These results are consistent with results from other studies that evaluated the use of telehealth for CI mapping (Ramos et al., 2009; McElveen et al., 2010; Wesarg et al., 2010). The only significant finding for the electrode-specific measures was a significant effect of measure for apical C-levels in Nucleus recipients. C-levels for the second measure in each session were an average of 2 CL higher than the first measure. This may have been the result of some habituation to the signal. Clinically, it is not uncommon for CI recipients to tolerate slightly higher stimulus levels following repeated or extended periods of stimulation.
In contrast to the electrode-specific measures, this study found significantly poorer performance for speech perception in the remote condition. This result was likely due to the lack of a sound booth at the remote sites, as evidenced by larger performance decrements at the site with the highest background noise levels and longest reverberation times. These two factors are known to negatively affect speech perception, especially for individuals with hearing loss (e.g., Beutelmann & Brand, 2006; Poissant, Whitmal, & Freyman, 2006). This study was intentionally designed to assess speech perception without a sound booth at the remote sites because it represents a more realistic scenario. Speech perception is typically measured in a sound booth at the CI clinic, but CI recipients in rural areas (a target population for users of telehealth) may not have access to facilities with sound booths where telehealth options might be available. One potential solution would be to perform speech-perception testing using the direct-audio input port on the CI speech processor. Validation of this technique represents an opportunity for future study; however, the clinical utility would be limited because microphone functionality cannot be assessed.
This study demonstrated that both commercial and non-FDA-approved (research-based) software from more than one device manufacturer could successfully reside on a single laptop without incident. All peripheral hardware functioned appropriately without interaction between manufacturers' devices. Although there was typically a short communication delay for laptop controls and the audio/video loop (less than one second), there was never an instance of accidental overstimulation due to the time lag. Further, all software applications functioned appropriately during each remote session. The only exception was an unresolved issue with Custom Sound for one subject, but the problem occurred at all three visits. For this one subject, Custom Sound showed connection with the processor, but when stimulation was attempted during the map-level task, no stimulus was presented or heard.
Finally, this study showed that all measurements could be made without requiring assistance at the remote site from someone with specialized knowledge of CIs and/or audiology. Participants in the present study were generally comfortable connecting the programming cables to their processors, and remote-site assistants could easily connect the processor interfaces to the laptop with minimal training. Although the remote-site assistant was typically present for the entire session, our experience with this study suggests little need for an assistant beyond the initial equipment setup and establishment of the SSLVPN and videoconference links, and being available for help if the videoconference link becomes compromised.
Challenges
This study has added valuable information to the evolving use of telehealth in audiology. There were, however, limitations involving technology as well as communication during the remote session that made this project challenging. One limitation was incompatibilities between different generations of software, hardware, and subjects' speech processors. For example, subjects with older Nucleus processors (such as the 3G) could not be tested with the Custom Sound EP software. In these cases, a loaner Freedom processor was issued for use at the remote-site visit so that ECAP measures could be made for those subjects3. Similarly, measures with BEDCS could only be made with a Platinum Series Processor (PSP), so a loaner PSP was issued for subjects who did not own one. While software/hardware incompatibility can also be an issue in the face-to-face condition, CI clinics (or research labs) typically have an arsenal of loaner equipment on hand. Clearly, it can be expensive to maintain a stock of loaner processors at each remote site for each device type. During the course of this study, both CI manufacturers performed software upgrades that required the coordination and installation of the software on the three remote-site laptops. In addition to hardware incompatibilities, software upgrades need to be taken into account when considering a telehealth approach to service delivery.
Communicating with subjects during the remote visit was also challenging at times. This was especially the case when the subject's processor was connected directly into the processor interface (thus making the microphone inactive). Speech reading, which is typically used in the face-to-face condition, can be somewhat compromised via the video link in the remote condition. In these situations, it was necessary to use other communication modes such as sign language, typing instructions into a Word document on the remote laptop, or holding up an instruction board to the video camera. While these adaptations were successful, they did add some extra time to the session and likely impaired the more natural communication one experiences in a face-to-face setting.
With the use of telecommunication and videoconferencing equipment, there is always a chance that audio and video quality may not be optimal. For this project, only one session experienced a failed video call during data collection. When this happened, the control-site simply re-dialed the remote site to connect again. This did not disrupt data collection; however, it did add additional time to the session. Likewise, there were times throughout the day when the call connection was busy due to a high volume of users. During this time, the Polycom connection speed seemed slower and the video quality was slightly poorer. When considering using videoconferencing for clinical services, these factors should be accounted for in order to optimize communication and service delivery.
One of the current limitations to the expansion and widespread use of telehealth is reimbursement and multi-state licensure (American Speech-Language-Hearing Association, 2005). Very few states have adopted reciprocity license agreements, which means that telepractice is allowed if a provider is licensed in his/her state of practice. Other states have adopted restrictive licensure agreements which may or may not mandate that a provider obtain an additional state license to practice telemedicine in another state. And finally, reimbursement for services still remains an obstacle to providing access to specialized care (via telehealth) for rural communities. It can be difficult to determine insurance coverage for telehealth service delivery across various health care disciplines. For insurance companies that do cover telehealth services, there are often restrictions regarding what and how services can be delivered.
Only experienced CI users were enrolled in this study. Further research is necessary to evaluate whether remote programming or research participation would be a viable option for very young children or recipients who have been recently implanted (i.e., initial stimulations; Franck et al., 2006). Additionally, more research is needed to investigate ways to improve speech perception scores in the remote condition when technology and optimal listening environments (i.e. sound booths) are limited in remote geographical regions. Overall, this study has demonstrated that remote/distance technology is a viable option for conducting cochlear implant research or clinical programming sessions.
ACKNOWLEGEMENTS
This study was supported by the National Institutes of Health, National Institute on Deafness and Other Communication Disorders grants R01 DC009595, 3R01 DC009595-01A1S1, and P30DC04662. The content of this project is solely the responsibility of the authors and does not necessarily represent the official views of the National Institute on Deafness and Other Communication Disorders or the National Institutes of Health. The authors thank the collaborators at the remote sites: Kathy Gosch, Wanda Kjar-Hunt, and Dale Gibbs at Good Samaritan Hospital; Mimi Mann and Dr. John Bernthal at the University of Nebraska-Lincoln; and Dr. Jessica Messersmith, Holly Eischens, and Crystal Dvorak at the University of South Dakota. The authors also thank Alexander Helbig and Suman Barua for assistance with data collection, and the subjects for their participation.
Footnotes
AutoNRT is not available for use with Nucleus 24M or 24R(CS) internal devices.
For seven measures in three subjects, t-NRI could not be calculated due to an insufficient number of measurable responses. In those cases, the lowest current level that yielded a measurable response (marked according to the software algorithm) was substituted for t-NRI.
We explored the option of installing the older NRT version 1.3 on the remote laptops, which can be used with a PPS and SPrint; however, NRT (v. 1.3) is not compatible with Windows XP or Windows 2007.
REFERENCES
- Abbas PJ, Brown CJ, Shallop JK, Firszt JB, Hughes ML, Hong SH, et al. Summary of results using the Nucleus CI24M implant to record the electrically evoked compound action potential. Ear and Hearing. 1999;20:45–59. doi: 10.1097/00003446-199902000-00005. [DOI] [PubMed] [Google Scholar]
- American Speech-Language-Hearing Association Audiologists providing clinical services via telepractice. American Speech-Language-Hearing Association Supplement. 2005;25:1–8. [Google Scholar]
- Bench J, Kowal A, Bamford J. The BKB (Bamford-Kowal-Bench) sentence lists for partially-hearing children. British Journal of Audiology. 1979;13:108–112. doi: 10.3109/03005367909078884. [DOI] [PubMed] [Google Scholar]
- Beutelmann R, Brand T. Prediction of speech intelligibility in spatial noise and reverberation for normal-hearing and hearing-impaired listeners. Journal of the Acoustical Society of America. 2006;120(1):331–342. doi: 10.1121/1.2202888. [DOI] [PubMed] [Google Scholar]
- Botros A, van Djik B, Killian M. AutoNRT™: An automated system that measures ECAP thresholds with the Nucleus® Freedom™ cochlear implant via machine intelligence. Artificial Intelligence in Medicine. 2007;40:15–28. doi: 10.1016/j.artmed.2006.06.003. [DOI] [PubMed] [Google Scholar]
- Choi JM, Lee HB, Park CS, Oh SH, Park KS. PC-Based tele-audiometry. Telemedicine and e-Health. 2007;13:501–508. doi: 10.1089/tmj.2007.0085. [DOI] [PubMed] [Google Scholar]
- Denton DR, Gladstone VS. Ethical and legal issues related to telepractice. Seminars in Hearing. 2005;26:43–52. doi: 10.1055/s-2004-815584. [DOI] [PubMed] [Google Scholar]
- Franck K, Pengelly M, Zerfoss S. Telemedicine offers remote cochlear implant programming. Volta Voices. 2006;13:16–19. [Google Scholar]
- Givens GD, Elangovan S. Internet Applications to Tele-Audiology – “Nothin' but Net.”. American Journal of Audiology. 2003;12:59–65. doi: 10.1044/1059-0889(2003/011). [DOI] [PubMed] [Google Scholar]
- ISO 3382 Acoustics — Measurement of the reverberation time of rooms with reference to other acoustic parameters. 1997.
- Krumm M, Huffman T, Dick K, Klich R. Telemedicine for audiology screening of infants. Journal of Telemed Telecare. 2008;14(2):102–104. doi: 10.1258/jtt.2007.070612. [DOI] [PubMed] [Google Scholar]
- Krumm M, Ribera J, Klich R. Providing basic hearing tests using remote computing technology. Journal of Telemed Telecare. 2007;13:406–410. doi: 10.1258/135763307783064395. [DOI] [PubMed] [Google Scholar]
- McElveen JT, Blackburn EL, Green JD, McLear PW, Thimsen DJ, Wilson BS. Remote programming of cochlear implants: A telecommunications model. Otology & Neurotology. 2010;31:1035–1040. doi: 10.1097/MAO.0b013e3181d35d87. [DOI] [PubMed] [Google Scholar]
- Nilsson M, Soli SD, Sullivan JA. Development of the Hearing in Noise Test for the measurement of speech reception thresholds in quiet and in noise. Journal of the Acoustical Society of America. 1994;95:1085–1099. doi: 10.1121/1.408469. [DOI] [PubMed] [Google Scholar]
- Peterson GE, Lehiste I. Revised CNC lists for auditory tests. Journal of Speech and Hearing Disorders. 1962;27:62–70. doi: 10.1044/jshd.2701.62. [DOI] [PubMed] [Google Scholar]
- Poissant SF, Whitmal NA, III, Freyman RL. Effects of reverberation and masking on speech intelligibility in cochlear implant simulations. Journal of the Acoustical Society of America. 2006;119(3):1606–1615. doi: 10.1121/1.2168428. [DOI] [PubMed] [Google Scholar]
- Ramos A, Rodríguez C, Martinez-Beneyto P, Perez D, Gault A, Falcon JC, et al. Use of telemedicine in the remote programming of cochlear implants. Acta Oto-Laryngologica. 2009;129:533–540. doi: 10.1080/00016480802294369. [DOI] [PubMed] [Google Scholar]
- Ribera JE. Interjudge reliability and validation of telehealth applications of the Hearing in Noise Test. Seminars in Hearing. 2005;26:13–18. [Google Scholar]
- Shapiro WH, Huang T, Shaw T, Roland T, Lalwani AK. Remote intraoperative monitoring during cochlear implant surgery is feasible and efficient. Otology & Neurotology. 2008;29:495–498. doi: 10.1097/MAO.0b013e3181692838. [DOI] [PubMed] [Google Scholar]
- Towers AD, Pisa J, Froelich TM, Krumm M. The reliability of click-evoked and frequency-specific auditory brainstem response testing using telehealth technology. Seminars in Hearing. 2005;26:26–34. [Google Scholar]
- van Dijk B, Botros AM, Battmer R, Begall K, Dillier N, Hey M, et al. Clinical results of AutoNRT,™ a completely automatic ECAP recording system for cochlear implants. Ear and Hearing. 2007;28:558–570. doi: 10.1097/AUD.0b013e31806dc1d1. [DOI] [PubMed] [Google Scholar]
- Wesarg T, Wasowski A, Skarzynski H, Ramos A, Gonzalez JCF, Kyriafinis G, et al. Remote fitting in Nucleus cochlear implant recipients. Acta Oto-Laryngologica. 2010;130:1379–1388. doi: 10.3109/00016489.2010.492480. [DOI] [PubMed] [Google Scholar]


