

Abstract
Tissues are exposed to exogenous and endogenous nitrogen dioxide (•NO2), which is the terminal agent in protein tyrosine nitration. Besides iron chelation, the hydroxamic acid (HA) desferrioxamine (DFO) shows multiple functionalities including nitration inhibition. To investigate mechanisms whereby DFO affects 3-nitrotyrosine (3-NT) formation, we utilized gas phase •NO2 exposures, to limit introduction of other reactive species, and a lung surface model wherein red cell membranes (RCM) were immobilized under a defined aqueous film. When RCM were exposed to •NO2 covered by +/− DFO: (i) DFO inhibited 3-NT formation more effectively than other HA and non-HA chelators; (ii) 3-NT inhibition occurred at very low [DFO] for prolonged times; and (iii) 3-NT formation was iron independent but inhibition required DFO present. DFO poorly reacted with •NO2 compared to ascorbate, assessed via •NO2 reactive absorption and aqueous phase oxidation rates, yet limited 3-NT formation at far lower concentrations. DFO also inhibited nitration under aqueous bulk phase conditions, and inhibited 3-NT generated by active myeloperoxidase “bound” to RCM. Per the above and kinetic analyses suggesting preferential DFO versus •NO2 reaction within membranes, we conclude that DFO inhibits 3-NT formation predominantly by facile repair of the tyrosyl radical intermediate, which prevents •NO2 addition, and thus nitration, and potentially influences biochemical functionalities.
Keywords: Desferrioxamine, nitrogen dioxide, membrane proteins, hydroxamic acids, epithelial lining fluid, nitration, tyrosine, tyrosyl radicals, repair, reduction
Introduction
Desferrioxamine (DFO), a siderophore produced by Streptomyces pilosus, is currently the most widely employed iron chelator and is administered clinically to promote the excretion of toxic iron. It consists of a chain of three hydroxamic acids (see Fig. 1) which allows it to bind ferric (Fe3+) iron with a stability constant of 1031 [1]. Apart from its clinical use, DFO is useful in investigating free-radical induced injury [2]. DFO reacts with both superoxide and hydroxyl radicals, affects eicosanoid metabolism, acts as a substrate for peroxidases and inhibits them at high concentrations, and is capable of forming a nitroxide radical [3,4]. In animal studies, DFO has shown protective effects on •NO2- and smoke-induced lung injury [5,6]. These effects have been almost entirely attributed to iron chelation and thus inhibition of iron-dependant free radical reactions. However, it has also been proposed that DFO can inhibit free radical reactions by iron chelation-independent mechanisms such as direct scavenging of reactive species including the nitrogen dioxide radical (•NO2) [7–9].
Figure 1. Schematic Structures of Hydroxamic Acids and Related Compounds.

Note that DFO contains three hydroxamic groups while HU, BHA, and SHA only a single group. HBED and DTPA are not hydroxamic acids although all five moieties show variable degrees of metal chelation.
It is widely believed that •NO2 is pivotal in biological nitration reactions [10–13], that have been observed concomitant with a variety of pathophysiologic conditions [14–17]. In vivo exposure to •NO2 occurs via direct inhalation, decomposition of higher order nitrogen oxides, peroxidase-mediated reactions, •NO near diffusion-controlled reaction with organic peroxyl radicals which form •NO2 and the corresponding alkoxyl radicals, and, to a limited extent, autoxidation of nitric oxide (•NO) [11–13,18–21]. The reaction of peroxynitrite with CO2, that ultimately forms the •NO2 and CO3•− radicals, and •NO2 catalytically generated by the enzyme myeloperoxidase using nitrite as a substrate, are commonly associated with the nitration of tyrosine residues. However, these reactions may not be the sole sources of •NO2, especially in the outermost tissue strata. The lung, for example, endogenously generates •NO and is frequently exposed to environmental •NO and •NO2 that can be absorbed from the intrapulmonary gas phase by diffusive and reactive processes [18,20,22,23]. Within the lung, in a concentration dependent manner, •NO2 exposure initiates acute epithelial injury, activation of signaling cascades, inflammation, protein and lipid oxidation, and, ultimately remodeling of lung architecture [18,24–26].
The entire respiratory tract surface is covered by a biochemically complex aqueous layer termed the epithelial lining fluid (ELF) into which inhaled gases dissolve and then must diffuse before contacting the underlying epithelia. Reactive absorption, wherein ELF reactions with solute •NO2 maintain the net driving force for continued mass transfer of •NO2 from the gas to aqueous phase [22,27,28], may play an important role in lung surface compartment nitration. Because •NO2 undergoes facile reaction with numerous ELF constituents and because recent comprehensive analyses suggest markedly reduced hydrophobic partitioning relative to •NO [21,29,30], initial •NO2 reactions are likely largely confined to the ELF. Thus, depending upon the respective concentrations of •NO2 and ELF substrates and the ELF thickness, diffusion versus reaction properties will dictate how far •NO2 penetrates into and through the ELF, which varies in thickness from 1 to 10 μm [31]. Recent estimates suggest that •NO2 reaction with ELF constituents would predominate over its diffusion to the epithelial surface [21,32].
This is further supported by observations that •NO2 exposure-mediated 3-nitrotyrosine (3-NT) formation occurred in cell membranes when overlain by phosphate buffer but not at appreciable antioxidant concentrations [32]. In addition, inclusion of metal chelators DFO or diethylenetriaminepenta-acetic acid (DTPA) to the model system inhibited exposure-mediated membrane oxidation but, DFO also inhibited membrane nitration while DTPA did not [32,33]. Because tyrosine nitration is generally considered to involve a two step process wherein oxidation generates a tyrosyl radical intermediate followed by •NO2 addition, diverse oxidants other than •NO2 (e.g., carbonate radical, lipid radicals, etc) may contribute to the first step [12,34]. Consequently, interventions that reduce the extent of tyrosine nitration may result from a variety of mechanisms.
Accordingly, we extended our previous observations of •NO2 reaction/diffusion phenomena via studies to discern mechanisms by which DFO inhibits protein nitration under conditions that approximate the lung surface. A previously utilized reductionist model was employed to facilitate tight experimental controls, including the direct use of gaseous •NO2 which circumvents initial generation of other reactive species that occurs during use of precursor reagents, pulse radiolysis, or flash photolysis [7,12,32–35]. Our results suggest that, in addition to modest direct •NO2 scavenging, DFO reduces tyrosyl radicals and thus inhibits the radical-radical addition step that leads to 3-NT formation.
Materials and Methods
Reagents
Reagents were obtained from the following suppliers: (i)compressed •NO2 (99.1 ppm in N2) - BOC Gases (Riverton, NJ, USA); (ii) nitrotyrosine polyclonal antibody, nitrotyrosine BSA, and 3-nitrotyrosine (3-NT) - Cayman Chemical (Ann Arbor, MI, USA); (iii) acrylamide, lysine, Tris, nitrocellulose membrane paper and broad range SDS-page - Bio-Rad (Hercules, CA, USA); (iv) sodium lauryl sulfate, monobasic and dibasic sodium phosphate - Fisher Scientific (Fair Lawn, NJ, USA); (v) SuperSignal west pico chemiluminescent substrate and BCA protein assay kit - Pierce Biotechnology, Inc. (Rockford, IL, USA); (vi) L-tyrosine - ICN Biochemical (Cleveland, OH, USA); (vii) hydroxyurea (HU) - Calbiochem (La Jolla, CA, USA); (viii) N,N′-Di(2-hydroxybenzyl)ethylenediamine-N, N′-diacetic acid monohydrochloride hydrate (HBED) - Strem Chemicals (Newbury Port, MA, USA); (ix) desferrioxamine (DFO), salicylhydroxamic acid (SHA), benzohydroxamic acid (BHA), diethylenetriaminepentaacetic acid (DTPA), ascorbic acid (AH2), ferric chloride (FeCl3), monoclonal anti-rabbit IgG and all other materials - Sigma-Aldrich CO (St. Louis, MO, USA). Structures of the various hydroxamic acids and related reagents are presented in Figure 1. Because of the functional group structural similarities, we shall consider hydroxyurea as a hydroxamic acid.
In vitro lung surface model
Human blood was obtained by venipuncture according to the University of Alabama, Birmingham IRB protocol number X030320005. The lung surface model, as described in [24, 34] was designed to mimic the lung surface via its three compartments; air space, epithelial lining fluid (ELF), and epithelium. Herein, a monolayer of red blood cell-derived membranes (red cell membranes; RCM) bound to the bottom of Petri dishes (60 × 15 mm) represents the epithelial apical surface. Prior to application of red cells, dishes were boiled in 10% nitric acid, silanized with 3-aminopropyltriethoxysilane, and treated with glutaraldehyde to generate a surface of reactive aldehydes capable of binding to the amino termini and other amino moieties of proteins [32,33]. Erythrocytes were washed three times with 310 mOsm phosphate buffer, pH 7.4, and centrifuged at 4000 RCF. 2.3 ml of a 10% erythrocyte suspension (in 310 mOsm phosphate buffer) was added to the dishes and allowed to bind for 30 minutes. The bound cells were then lysed with 2 ml hypotonic phosphate buffer (10 mOsm, pH 7.0), and repeatedly rinsed to remove hemoglobin and other intracellular debris, resulting in a monolayer of RCM covalently bound to the glass surface of the dishes. Immediately prior to exposure, 2 ml model ELF (10 mOsm phosphate buffer + dissolved reagents, pH 7.0 [36]) were added over the RCM. A hypo-osmolar buffer was used during exposure to inhibit RCM re-annealing, which would generate a fourth (intracellular) compartment, leaving a sheet of open membranes so that both “inner” and “outer” sides were exposed to aqueous phase solutes. Reagents included AH2, FeCl3, iron chelators DFO, DTPA, HBED, SHA, BHA, and HU. In order to facilitate iron removal prior to exposure initiation, several experiments were conducted wherein either 50 μM DFO or 400 μM DTPA were added to the membranes for 10 minutes followed by repeated rinsing and addition of the model ELF. Ferrioxamine was formed by combining DFO with a molar excess of FeCl3 prior to introduction into the RCM model.
RCM exposure protocol
Petri dishes with bound RCM were exposed to •NO2 for 30 minutes in a small glass chamber (1500 ml). In order to mimic ELF in situ thickness, the chamber was intermittently tilted to leave an aqueous film covering the upper half of the dish, which provided a reservoir of reactive substrates pooled in the lower half of the dish. Every two minutes, the chamber was tilted to the opposite angle allowing for each half to be exposed equally [32,33]. Exposures were conducted under steady state, first order conditions with respect to •NO2 [37] ([•NO2]inflow ~ 4.5 ppm) at 25°C. High concentration •NO2 (~ 100 ppm •NO2 in N2) was injected countercurrent into a stream of humidified air which then flowed through a diffuser located in the top of the exposure chamber [32], resulting in well-mixed, gas phase conditions (~ 1 volume change/min). To reduce background •NO2 interactions with chamber components, the entire exposure system was equilibrated (wherein [•NO2]inlet = [•NO2]outlet) prior to Petri dish introduction. Gas phase •NO2 concentrations were continuously monitored via chemiluminescence (Model 42C •NOx analyzer; Thermo Fisher, Franklin, MA, USA). •NO concentrations were consistently well below 0.10 ppm.
Myeloperoxidase studies
To directly generate •NO2 at the RCM, thus avoiding •NO2 mass transfer into and reaction/diffusion within the overlying aqueous film, RCM were overlain with a 0.7 units/ml MPO solution, the Petri dishes covered, and gently but continuously rocked for 15 min. The MPO solution was then aspirated and the dishes rinsed, resulting in catalytically active MPO adhered to the RCM. MPO activity was assessed via intra-dish reaction mixtures using tetramethylbenzidine as the substrate [38]. Residual (bound) MPO activity averaged 0.56 units/ml, with little inter-dish variation. For nitration studies, RCM + MPO were overlain with various aqueous systems (+/− 100 μM NO2− and/or 100 μM H2O2) and continuously rocked in covered dishes for 30 min. Following treatment, membrane proteins were isolated and the presence of 3-NT determined by Western analysis.
Flask exposures
50 ml Erlenmeyer flasks were equipped with Teflon covered stoppers, Teflon inlet and exhaust tubes, and stir bars. •NO2 gas phase mixtures were generated as above and the exposure system and flask conditioned until inlet (~ 150 ml/min) and exhaust [•NO2] were equivalent. Test solutions were directly injected into the flask, exposures conducted under first-order conditions with respect to [•NO2] and both gas and aqueous phase well stirred conditions, and the time-dependent change in •NO2 exit concentration monitored. This approach permits mass balance computations (i.e. ([•NO2]in - [•NO2]out x time x flow = total uptake) of •NO2 reactive absorption. Although this is a lumped measure that includes interfacial transfer, •NO2 solubility, both solute •NO2 and reactive substrate diffusion, and bimolecular reaction kinetics, •NO2 uptake (gas phase disappearance) serves as a measure of relative reactivity since, under fixed conditions of [•NO2]inflow, temperature, flow, and stirring, interfacial transfer (uptake) is determined by solute •NO2 reaction which is a function of substrate concentration and reaction rate (k • [S]) [22,30]. NO2− accumulation in the model ELF was measured using the Griess reaction [39]. Larger flasks (250 ml) and volumes (20 ml) were also used to assess differential rates of AH2 and DFO oxidation due to •NO2 exposure. Oxidation was evaluated spectrophotometrically using extinction coefficients (AH2; ε(265 nm) = 14,500 M−1cm−1 [40]) and the loss of ability to form ferrioxamine (ε(425 nm) = 2,460 M−1cm−1 [41]) in the presence of excess ferric ions (see supplemental data).
Bubbler exposures
Using a fine fritted bubbler equipped with a stopcock at the bottom to allow for sample removal, approximately 8 ppm •NO2 in humidified air, generated as above, was bubbled through a solution of 0.8 mM tyrosine with or without 50 μM DFO (in 10 mOsm phosphate buffer, pH 7.0) for 120 minutes to assess the formation of 3-NT under aqueous bulk phase conditions. Every 30 minutes, 2.25 ml of the exposed solution were combined with 0.25 ml of 1 N NaOH and scanned from 200–800 nm (Cary 100 Bio UV-Visible Spectrophotometer, Walnut Creek, CA, USA). 3-NT displays a broad peak at approximately 430 nm [42].
Western blot analysis of 3-nitrotyrosine formation
RCM nitration was evaluated by Western blot analysis of 3-NT formation in membrane proteins relative to aqueous phase conditions (e.g., AH2, DTPA, HBED, DFO, DFO + FeCl3, SHA, BHA, HU), and pretreatment conditions (DFO, DTPA). Immediately after exposure, the aqueous phase was removed and RCM were rinsed with phosphate buffer and 150 μl of extraction buffer (150 mM NaCl, 50 mM Tris, 1 mM EGTA, .25% Sodium deoxycholate, 1% Igepal, 1 mM Na orthovanadate, 1 mM protease inhibitor, and 0.4% HCl) was added to each dish to solubilize membrane proteins. The dishes were scraped and the composite extract stored in sealed microfuge tubes (−80°C). Using the BCA assay to determine appropriate loading amounts, 10 μg protein from each sample and nitrated bovine serum albumin (positive control) were separated by gel electrophoresis (10% gel, 50 V, overnight) and transferred to nitrocellulose membranes (25 V, 1 hr) for Western blot analysis. After transfer, blots were stained in fast green to visualize proteins, then blocked in a 5% nonfat milk/TBST (200 mM Tris, 1.5 M NaCl, and 0.05% Tween 20) solution for 1 hr. Blots were rinsed with TBST and incubated in 1:500 nitrotyrosine polyclonal antibody for 1 hr followed by a 1:2500 monoclonal anti-rabbit IgG for an additional 1 hr incubation. The presence of 3-NT was detected with Pierce SuperSignal west pico chemiluminescent substrate.
Data analyses
Because of the high density staining of the 3-NT Western blots, densitometry was impractical for quantification [43,44] and thus we utilized a comparative system wherein each blot was run with an experiment-specific PO4 + NO2 positive control, and the resulting extent of 3-NT subjectively scaled. Lanes containing the experimental conditions were evaluated in comparison to the experiment- and blot-specific control lanes, denoting the amount of 3-NT as extensive (++++), significant (+++), modest (++), little (+), or none (−). Each blot was scored by blinded observation. Data represent means +/− standard deviations. Statistical analyses generally employed ANOVA with significance set at p <0.05.
Results
Previous •NO2 reaction/diffusion studies, which employed the same lung surface model herein, noted that protein nitration was ablated when RCM were covered by an aqueous film containing DFO but not DTPA [32], but the mechanism remained equivocal. To elucidate mechanisms for the selective inhibition by DFO, we initially investigated the concentration profile of DFO-related 3-NT inhibition to determine a [DFO] efficacy threshold under these experimental conditions. RCM were exposed (30 min, 4.5 ppm •NO2 in air) using only DFO in buffer and protein nitration evaluated. Concentrations as low as 0.5 μM DFO appreciably decreased exposure-mediated nitration (Fig. 2), suggesting that only small concentrations were required despite the fact that some DFO reaction with solute •NO2 would potentially occur [7].
Figure 2. Effect of Initial DFO Concentration on •NO2-Mediated RCM Nitration.

RCM, adhered in Petri dishes, were overlain with PO4 buffer (10 mOms, pH 7.0) plus increasing initial DFO concentrations (0 – 5.0 μM) and exposed to 4.5 ppm •NO2 for 30 min with intermittent cyclic tilting of the glass exposure chamber. DFO was added just prior to exposure onset. Post exposure, RCM were harvested and 3-NT formation assessed via Western analysis as described in Methods (n ≥ 4 independent RCM preparations and related exposures). Nitrated BSA was utilized as a positive control standard for 3-NT. Illustrated in this exampled gel is the fact that even 5 μM DFO extensively inhibited 3-NT formation (herein scored as “—“) while 1 μM constrained formation to little (+) and even 0.5 μM reduced generation to a significant (+++) extent. 0 μM DFO comparatively illustrates our subjective scale of extensive (++++). In the absence of •NO2 exposure, note that basal levels of 3-NT within the adhered RCM were below detectable levels. Differences across the [DFO] were statistically significant.
We subsequently characterized the temporal course of DFO-mediated nitration inhibition using a [DFO] above that shown to be efficacious for a 30 minute exposure period. Figure 3 illustrates that an initial aqueous phase concentration of 25 μM DFO limited RCM 3-NT formation to near or below detectable levels for at least 90 min of continuous •NO2 exposure. If one considers the mass balance between •NO2 delivery and the DFO pool, approximately 20 μmoles of •NO2 were delivered to the chamber over the 90 min time span (4.5 ppm = 8.46 ng/ml; (8.46 ng/ml • 1200 ml/min • 90 min)/46 ~ 20 μmole). Each RCM dish initially contained 50 nmole DFO so that even with 6 dishes concomitantly exposed (2 ml/dish • 6 dishes = 0.3 μmoles DFO), there was at least a 60-fold excess of •NO2 available for mass transfer and reaction, although [•NO2]exit indicated somewhat modest •NO2 gas phase disappearance throughout the 90 min exposure period, consistent with limited aqueous substrate reaction [30]. Thus, the prolonged inhibition of protein nitration suggests that pathway(s) other than direct DFO scavenging of solute •NO2 likely predominated.
Figure 3. Time Course of •NO2-Mediated RCM Nitration in the Presence and Absence of Desferrioxamine.

RCM, adhered in Petri dishes, were overlain with PO4 buffer (10 mOms, pH 7.0) with and without 25 μM DFO and exposed to 4.5 ppm •NO2 for 30 – 90 min with intermittent cyclic tilting of the glass exposure chamber. DFO was added just prior to exposure onset. Post exposure, RCM were harvested and 3-NT formation assessed via Western analysis as described in Methods. Nitrated BSA was utilized as a positive control standard for 3-NT. As can be seen from this exampled gel (n ≥ 4 independent RCM preparations and related exposures), under these experimental conditions DFO substantially restricted 3-NT formation for at least 90 min of continuous •NO2 exposure. Also note that the extent of RCM nitration in the absence of DFO increased with exposure time but was extensive (++++) even by the 30 min time point.
As a basis for direct comparison of aqueous phase reactants, 3-NT formation was assessed using a well-documented facile •NO2 reactive substrate [29,30]. RCM were exposed (30 min; 4.5 ppm •NO2) while covered with initial AH2 concentrations ranging from 10 to 100 μM. As shown in Table 1, a pronounced concentration effect was observed wherein only 100 μM AH2 substantially limited exposure-induced nitration over 30 min. At the lower initial concentrations (≤ 50 μM), no AH2 could be detected at the end of the exposure period (data not shown). Thus, the differential extent of 3-NT formation across [AH2] was likely related to reactive absorption-mediated depletion of AH2, so that the temporal course of protein nitration was a function of aqueous phase conditions that modulated •NO2 diffusion to the RCM. Under the specific employed conditions of initial 100 μM AH2, •NO2 delivery rate, aqueous phase mixing (tilting), total aqueous phase surface area, and exposure time, there was a sufficient initial AH2 pool to enable continued reaction which served to scavenge •NO2, thus constraining diffusion which prevented membrane protein nitration.
TABLE 1.
Influence of Initial Ascorbate Concentrations on •NO2-Induced Membrane Tyrosine Nitration
| Aqueous Phase | 3-Nitrotyrosine |
|---|---|
| 100 μM AH2 | — |
| 50 μM AH2 | + + + |
| 25 μM AH2 | + + + |
| 10 μM AH2 | + + + + |
Red cell membranes (RCM) were covered with differing initial reduced ascorbate (AH2) concentrations and exposed to 4.5 ppm •NO2 in air for 30 min with cyclic tilting (2 min/side). Following exposure, RCM were washed, membrane proteins isolated, and the presence of 3-nitrotyrosine residues determined by Western analysis. As described in Methods, the extent of 3-NT formation is denoted as extensive (++++), significant (+++), modest (++), little (+), or none (-).
Using our well-established flask exposure approach to determine relative reactivities [30], we compared the ability of DFO, HBED, SHA, HU, and AH2 to drive •NO2 reactive absorption and estimate •NO2 uptake:NO2− formation ratios. As illustrated in Figure 4, compared to AH2, the hydroxamic acids all showed relatively modest reactivity towards •NO2. Previous studies have shown a 1:1 ratio between •NO2 uptake and NO2− formation for a variety of substrates [30,32], which generally held true herein. Deviations from a 1:1 ratio were likely due to •NO2 mass balance measurement errors since DFO-mediated •NO2 uptake rates, for example, were quite low relative to •NO2 delivery but •NO2 inflow rates needed to be sufficient to preclude •NO2 as the limiting reagent. On the other hand, both 50 and 100 μM AH2 displayed approximately equivalent uptake and NO2− formation, likely due to saturation of the interfacial transfer rates, which we have previously documented [37]. Furthermore, 30 min exposures of greater AH2 volumes (with DTPA to reduce adventitious Fe-initiated autoxidation; volumes permitted multiple sample withdrawals) resulted in appreciable loss of reduced ascorbate while only marginal oxidation of DFO could be detected (Supplementary Data). Although it is difficult to completely rule out that DFO is a direct •NO2 scavenger in our model system (see Fig 6), one may rank DFO against AH2 for this capacity on the basis of •NO2 flux calculated from the decrease in substrate (DFO or AH2) during a 30 min exposure (see Supplementary Data) assuming the same reaction stoichiometry for both substrates (Substrate:•NO2 = 1:2). The substrate decay rates are coupled to •NO2 flux and reflect reactivities for NO2. The •NO2 flux into DFO was small (57 ± 21 nmoles •NO2/10 min) and can be compared to the large flux into AH2 (374 ± 28 nmoles/10 min) (Table S1). It is interesting to note that with AH2, the decay in concentration is nearly independent of the [AH2] from 50 down to 20 μM, strongly suggesting interfacial saturating conditions. Thus, the •NO2 flux with AH2 ~ 7× larger than for DFO but would be even larger if the interface was not under saturation conditions. Moreover, the NO2− formation data presented in Figure 4 suggests that some DFO may be decaying by reacting with (NO2)solute by simple diffusion rather than by driving •NO2 reactive uptake. These analyses indicate that DFO is a considerably less effective direct scavenger of •NO2 than AH2 and thus a direct scavenging mechanism is less likely to occur with DFO.
Figure 4. The Extent of •NO2 Uptake and Nitrite Formation across Varying Substrates.

As described in methods, solutions at the listed concentrations were exposed under quasi-steady state (with respect to •NO2), well stirred, conditions in small flasks. •NO2 uptake was calculated via the mass balance of gas phase •NO2 across the flasks and the nitrite concentrations determined via the Greiss reaction based on daily standard curves (containing the respective substrate) utilizing NaNO2 as the standard. Data are presented as means +/− one standard deviation of at least 3 independent observations. This approach provides a relative measure of aqueous phase reactivity since the mixing rate, •NO2 delivery rate, and exposure time were all held constant so that differences in uptake and product (nitrite) formation result from the differential driving force for •NO2 interfacial transfer maintained by reaction between solute •NO2 and the substrate of interest. As can be seen, all but the AH2 showed marginal, if any, uptake rates above the buffer control, suggesting relatively limited reactivity with •NO2. AH2, which is a well documented facile reactant for •NO2 produced significantly greater rates of uptake and nitrite formation that approximated the 1:1 stoichiometry observed previously. The apparent lack of dose response between 50 and 100 μM likely stemmed for saturation of the interfacial mass transfer rates, which has also been formerly characterized.
We subsequently compared the ability of the tested hydroxamic acids to inhibit •NO2 exposure-mediated RCM nitration. Table 2 displays notable differences across the various moieties. Compared to 50 μM DFO, which inhibited 3-NT formation to below detectable levels, 200 μM SHA (below detection) and 200 μM BHA (largely) also inhibited membrane nitration. At a somewhat lower concentration, to more closely mimic therapeutic situations, 25 μM HU also displayed notable, but not complete, inhibitory activity. However, like the other non-hydroxamic acid DTPA, 200 μM HBED poorly inhibited exposure-mediated nitration. Thus DFO served as the most robust inhibitor of •NO2 mediated tyrosine nitration
TABLE 2.
Influence of Hydroxamic Acids and Related Compounds on •NO2-Induced Membrane Tyrosine Nitration
| Aqueous Phase | 3-Nitrotyrosine |
|---|---|
| 50 μM DFO | — |
| 200 μM SHA | — |
| 200 μM BHA | + |
| 25 μM Hydroxyurea | + + |
| 200 μM HBED | + + + |
| 400 μM DTPA | + + + + |
Red cell membranes (RCM), adhered in petri dishes, were covered with various aqueous phase constituents and exposed to 4.5 ppm •NO2 in air for 30 min with cyclic tilting. Following exposure, RCM were washed, membrane proteins isolated, and the presence of 3-nitrotyrosine residues determined by Western analysis. As described in Methods, the extent of 3-NT formation is denoted as extensive (++++), significant (+++), modest (++), little (+), or none (-). 3-NT was undetectable during air-only exposures.
To determine whether DFO-related 3-NT inhibition occurred preferentially with membrane associated tyrosine residues, we performed aqueous bulk phase studies by directly bubbling •NO2 in air through a solution of free tyrosine with and without DFO. Time dependent samples were obtained and 3-NT formation evaluated via spectrophotometry. Figure 5 shows a representative scan that illustrates 3-NT formation in the absence of DFO. However, with DFO addition we noted substantial nitration inhibition even though tyrosine was in appreciable excess. Exposures were conducted for 120 min which was the time required to generate a readily detectable 3-NT peak via this approach. The lack of complete inhibition by DFO may have been due to its direct but relatively limited reaction with •NO2 and/or the stochastic probability of tyrosyl radicals interacting with continuously supplied •NO2 rather than DFO interception. Under these conditions, per published spectra [42], we did not observe dityrosine accumulation again likely due to the limited probability of two tyrosyl radicals directly interacting. However, the data do illustrate that the DFO inhibitory effect occurred under purely aqueous conditions and thus membrane tyrosine residues that protrude outside the hydrophobic domain may also be affected by its presence.
Figure 5. Effect of Desferrioxamine on Aqueous Bulk Phase Tyrosine Nitration.

8 ppm •NO2 (mixture of 60 ml/min •NO2 and 520 ml/min air) was bubbled through a 100 ml solution of 0.8 mM tyrosine for 120 min at 25° C. The presence of 3-nitrotyrosine in the solution was measured spectrophotometrically (OD438) at 30 min intervals (long dashed line). At each interval, 2.25 ml of exposed solution were combined with 0.25 ml 1 N NaOH and scanned from 800 – 200 nm. Baseline corrections were made with PO4 + NaOH solution. Relative to the •NO2 inflow rate, exposed solution volume, tyrosine concentration, and exposure time, the yield of 3-NT based on its alkaline extinction coefficient (~ 4000 M−1 cm−1) is within experimental norms. Conditions were then repeated using a 50 μM DFO + 0.8 mM tyrosine solution (short dashed line). Data shown includes t = 0 min and t = 120 min readings. At t = 0 min, spectrophotometric scans of tyrosine and tyrosine + DFO solutions overlie. The addition of DFO to the •NO2 exposed tyrosine markedly reduced 3-NT accumulation.
We subsequently investigated the consequences of DFO-Fe binding with regard to nitration inhibition. Addition of FeCl3 alone did not alter •NO2 exposure-related RCM nitration (data not shown), suggesting that under these experimental conditions nitration was Fe-independent. Furthermore, preloading DFO with a Fe molar excess ablated inhibition (data not shown), substantiating that the free hydroxamic moieties were likely responsible for preventing •NO2-mediated nitration. To further test these assumptions regarding Fe-independence and hydroxamic acid-dependence, we preincubated adhered, lysed RCM with either DFO or DTPA and conducted •NO2 exposures with either PO4 buffer alone or the other chelator present (Table 3). DTPA removal of adventitious iron followed by •NO2 + PO4 exposures resulted in extensive 3-NT formation. However, DTPA pretreatment followed by exposures containing DFO limited nitration below detection. Conversely, pretreatment with DFO followed by exposures with either PO4 alone or DTPA resulted in no discernible diminution of 3-NT formation, suggesting that inhibition required the presence of DFO during •NO2 exposure regardless of any pretreatments.
TABLE 3.
Differential Effects of Iron Chelator Pretreatment and Presence during Exposure on •NO2-Induced Membrane Tyrosine Nitration
| Pretreatment Chelator | Exposure Aqueous Phase | 3-Nitrotyrosine |
|---|---|---|
| DTPA | PO4 | + + + + |
| DTPA | 50 μM DFO | — |
| DFO | PO4 | + + + + |
| DFO | 400 μM DTPA | + + + + |
Red cell membranes (RCM), adhered to glass petri dishes, were covered with an aqueous solution containing either 400 μM DTPA or 50 μM DFO. After two 10 min treatments with periodic mixing (gas phase = air), systems were thoroughly rinsed to remove bound Fe complexes and remaining unbound chelator. RCM were then covered with PO4 buffer alone or buffer + chelator and exposed to 4.5 ppm •NO2 in air for 30 min with cyclic tilting (2 min/side). Following exposure, RCM were washed, membrane proteins isolated, and the presence of 3-nitrotyrosine residues determined by Western analysis. As described in Methods, the extent of 3-NT formation is denoted as extensive (++++), significant (+++), modest (++), little (+), or none (-).
Lastly, in an attempt to mimic what might transpire on the lung surface wherein activated neutrophils in close approximation to epithelial apical membranes could drive cellular nitration reactions via peroxidase activity, MPO was “bound” to RCM prior to addition of NO2−/H2O2 and DFO (Table 4). Adhered RCM incubation with MPO, followed by thorough washing, resulted in appreciable remaining MPO activity within the Petri dishes. In combination, MPO + NO2− + H2O2 generated extensive RCM nitration, as anticipated [19,45]. In the absence of either NO2− or H2O2 no detectable nitration occurred and, under these experimental conditions, NO2− + H2O2 in the absence of MPO also did not generate 3-NT. Addition of the MPO inhibitor 4-aminobenzoic hydrazide to MPO + NO2− + H2O2 also completely blocked 3-NT formation, confirming the requirement for MPO catalytic activity. Importantly, addition of 50 μM DFO to the aqueous phase also limited nitration to below detection even though the RCM-bound MPO should have been generating its nitrating species in very close proximity to the RCM surfaces. Because at these low DFO concentrations MPO catalytic activity was essentially unaffected (data not shown), the results suggest that DFO had sufficient diffusivity within and/or along the RCM to block nitration. Thus, partitioning of DFO into the membranes likely contributed to its inhibitory actions rather than exclusive interception of (•NO2)solute diffusing from the gas-liquid interface and/or •NO2 generated at the RCM surfaces via MPO activity.
TABLE 4.
Effect of Desferrioxamine on Myeloperoxidase-Mediated Membrane Tyrosine Nitration
| 30 nM MPO | 100 μM NO2− | 100 μM H2O2 | 50 μM DFO | 100 μM 4-Aminobenzoic hydrazide | 3-Nitrotyrosine |
|---|---|---|---|---|---|
| X | X | X | - | - | + + + + |
| X | X | - | - | - | — |
| X | - | X | - | - | — |
| - | X | X | - | - | — |
| X | X | X | - | X | — |
| X | X | X | X | - | — |
Adhered red cell membranes (RCM) were covered with 0.7 units/ml myeloperoxidase (MPO) solution, continuously rocked in covered dishes for 15 min, the covering solution removed, and the RCM washed leaving only RCM bound MPO (~ 0.56 units/ml MPO activity). RCM were then covered with various aqueous phase constituents and exposed to air for 30 min with continuous rocking in covered dishes. Following exposure, RCM were washed, membrane proteins isolated and the presence of 3-NT determined by Western analysis. As described in Methods, 3-NT formation is denoted as extensive (++++), significant (+++), modest (++), little (+), or none (-).
Discussion
•NO2 is now recognized as a ubiquitous oxidant that is derived from both exogenous and endogenous sources. The lung surface is relatively unique because of the composite exposure potentials stemming from direct •NO2 inhalation and/or intrapulmonary oxidation of inhaled •NO, and responses to numerous stimuli, including inflammation, which endogenously generate •NO2. Because •NO2 is central in the overall biology of reactive nitrogen species (RNS) [11–13] and because protein tyrosine nitration, wherein •NO2 serves as the terminal nitrating species, is widely considered a hallmark index of RNS biochemical interactions, it is important to elucidate the factors that might modulate the net generation of nitrated tyrosine residues.
Due to its high affinity binding, DFO is the most commonly employed Fe chelator and has been used in numerous studies to identify the importance of Fe in redox reactions (e.g., Fenton chemistry) as well as its active site contributions in protein catalysis. Although the binding affinities are somewhat less, other hydroxamic acids chelate metals as well. Previous observations, both direct and inferential [3,4,7–9,34]), have suggested that DFO may function beyond its Fe binding activities. Other related chemical species, such as HU, have broad applicability as therapeutic agents with a variety of proposed pharmacologic modalities, including, for example, inhibition of enzymes such as ribonucleotide reductase (e.g., [46,47]). Since transient radicals, including tyrosyl, are key in the catalytic actions of numerous proteins [48,49] and since tyrosine nitration has been shown to affect function in diverse proteins [50–58], elucidating whether DFO and other hydroxamic acids may modulate nitration reactions and biological functions independent of chelation is important for understanding mechanisms, and how hydroxamic acids may influence and potentially confound in vitro and in vivo experimental outcomes and interpretations.
To clarify the extent that reagent DFO might confound studies focused on protein nitration reactions and Fe contributions, a minimalist approach was utilized that incorporated both a well-defined nitration target (RCM) and gas phase •NO2 exposures. Although the RCM model system involves mass transfer and reaction/diffusion complexities, delivery of gas phase •NO2 (stable •NO2 aqueous solutions cannot be generated/employed) limits it to the sole RNS introduced and avoids potential confounding from other reactive species generated by use of •NO2 precursors (e.g., ONOOCO2−), flash photolysis, or pulse radiolysis [7,12,32–35,59], thus affording a methodologic advantage.
Figures 2 and 3 illustrate that DFO effectively prevented membrane protein nitration at very low concentrations (≤ 5 μM) and over a relatively prolonged exposure period (≥ 90 min). Considering that •NO2 was not the limiting reagent, due to the steady state exposure conditions, and that DFO was a relatively poor substrate for •NO2 reactive absorption (Fig. 4 and Fig. S1), it does not seem likely that 3-NT inhibition resulted solely from direct (•NO2)solute scavenging. In this regard, a rate constant for reaction of DFO with •NO2 has been reported (k = 7.6 × 10⁶ M−1s−1 [7]) which is smaller than the rate constant for AH2 with •NO2 (two values in general agreement with one another have been reported for ascorbate; 1.8 × 10⁷ M−1s−1 and 3.5 × 10⁷ M−1s−1 [53,60,61]). It is interesting to note that to the best of our knowledge, the rate constant reported for DFO with •NO2 is the only rate constant regarding a complex hydroxamic acid. Recently, Samuni and Goldstein reported that the rate constant for acetohydroxamic acid, the simplest member of the hydroxamic acid series, is less than 2 × 10⁴ M−1s−1 [62] which contrasts sharply with the larger value reported for DFO [7] and argues against direct scavenging of •NO2 by DFO.
Ascorbate, which is a more facile •NO2 reactant than DFO, showed some degree of 3-NT inhibition at initial concentrations as low as 25 μM. It should be noted that AH2 will be consumed during the course of exposure so that •NO2 diffusion through the overlying aqueous film is a balance among its delivery and interfacial mass transfer rates, diffusion of both solute •NO2 and aqueous substrate, rate of aqueous substrate consumption, and depth of the aqueous film, among others. Thus, if the facile reactive substrate concentrations drop below a critical threshold, •NO2 diffusion to directly interact with the RCM becomes more favorable. Consequently, Table 1 shows that in the presence of a sufficiently large initial substrate pool, •NO2 was consumed via reaction and although secondary oxidants may have been produced thereby driving RCM oxidation, insufficient •NO2 reached the membranes to add to any existing tyrosyl radicals. If aqueous antioxidant concentrations remain sufficiently elevated, both •NO2 and secondary oxidants may be quenched thereby preventing or repairing tyrosine oxidation and thus limit consequent nitration.
The DFO-Fe complex can function as a reductant when in the DFO-Fe2+ state [63]. Because our use of lysed red blood cells, and results from previous studies, document the presence of adventitious iron, such a potential mechanism for tyrosyl radical reduction should not be ignored. However, although the DFO bound Fe may remain redox active, it would require a constant source of electrons during •NO2 exposure to maintain its reductive capacity. We believe that the presence of appreciable DFO-Fe2+ in our system was unlikely since an applicable electron source was present only during the AH2 studies. Even then, the continuous •NO2 influx would have likely resulted in preferential •NO2 reduction over tyrosyl radical repair. In the absence of aqueous phase AH2, no obvious electron source would have been available. Despite the complexities of Fe redox activities, our studies utilizing ferrioxamine or adventitious Fe removal tend to confirm this. Iron-saturated DFO had no inhibitory capacity and adventitious Fe removal (Table 3) required DFO per se present to block •NO2-mediated membrane nitration.
The ability of DFO to inhibit nitration occurred under a variety of physicochemical situations in both aqueous and hydrophobic compartments. Figure 5 illustrates that DFO constrained nitration under purely aqueous phase conditions while Table 4 demonstrates similar results with oxidants and/or nitrating species generated via MPO activity at or near membrane surfaces. We also considered DFO may directly inhibit MPO since it has been reported that certain hydroxamic acids may compete with MPO substrates (chloride, thiocyanate, and nitrite) for binding to the same active site, although inhibition was only observed at higher hydroxamic acid concentrations than we employed [64,65]. Interestingly, a published report on the inhibition of MPO by SHA used guaiacol (a phenolic compound) as a co-substrate for MPO [64]. We believe these results could have been confused by reaction of SHA with the guaiacol phenoxyl radicals because we did not observe MPO inhibition by DFO at the highest concentration levels we employed while using 3,3′,5,5′-tetramethylbenzidine as a co-substrate for MPO (data not shown). Thus, based on our empirical observations of sustained MPO catalytic activity in the presence of 50 μM DFO, we dismissed competitive inhibition of MPO as a mechanism for 3-NT inhibition during the MPO/DFO studies.
Irrespective of the •NO2 source (gas phase; MPO), it is difficult to precisely discern where within the membrane structure nitration occurred but, despite the lack of a “lens” effect driving preferential •NO2 partitioning into the membrane hydrophobic regions [21], one would anticipate nitration of tyrosines both within and protruding out of the membrane proper. The aqueous bulk phase studies showed a right spectral shift in the DFO+Tyr scans (Fig. 5; 325–375 nm) which may be attributable to oxidation products including adducts such as DFO-NO2, DFO-Tyr, etc., among a variety of others. Further analyses are needed to resolve the precise genesis of the spectral shift. However, this does not detract from the observations that even under bulk phase, well mixed conditions, the presence of DFO appreciably reduced the extent of 3-NT formation. Although dityrosine formation has been observed in a number of studies [59,62,66], its apparent absence herein was reasonable given the tyrosyl radical generation constraints under these study conditions.
Regardless of the mechanism(s) by which tyrosine oxidation occurred, we propose that DFO predominantly inhibited its nitration according to the mechanism below where R• represents a free radical such as •NO2 or a lipid-derived radical:
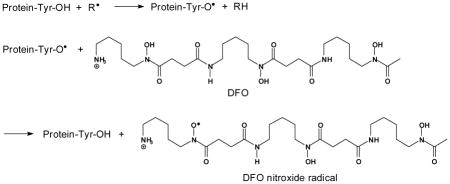
The site of radical formation in DFO is in accordance to the structure proposed by Morehouse et. al. [67]. Per the above, DFO competes with •NO2 for reaction with protein tyrosyl radicals, repairs the oxidized tyrosine residues, and inhibits nitration. DFO is only slightly lipophilic and based on its octanol-water partition coefficient, approximately 1.4% of the aqueous concentration should have partitioned into the lipid bilayer [68]. However, we believe that both aqueous and membrane-associated DFO participated in membrane protein tyrosyl radical reduction with the former reducing the exposed tyrosyl radicals while the latter reduced tyrosyl radicals embedded deeper in the membrane.
For our experimental conditions, DFO was likely to be present (both in membranes and the aqueous milieu) at higher concentration than •NO2 since •NO2 is sparingly soluble in aqueous media [69] and only slightly more soluble in organic media [70,71]. Moreover, recent analyses suggest that •NO2 does not partition into membranes to the same extent and thus undergo accelerated reaction as has been shown for •NO [20,21]. The rate constants for the tyrosyl radical and DFO reactions with •NO2 are 3 × 10⁹ M−1s−1 and 6.3 × 10⁶, respectively [72]; protein tyrosyl radicals are probably somewhat less reactive than tyrosyl radicals. Although the rate constant for nitration is some 400 times larger than the published rate constant for reaction with DFO, because [DFO] is expected to be much larger than [•NO2] at the reaction sites, we expect DFO to outcompete •NO2 for the protein tyrosyl radicals. In this regard, one can calculate using a Henry’s law constant equal to 1.4 × 10⁻² M atm−1 [70] and ideal gas behavior that for a gas phase [•NO2] equal to 4.5 ppm, the [•NO2] in the aqueous phase will approximate 4.5 × 10−6 atm × 1.4 × 10−2 M atm = 6.3 × 10⁻⁸ M. This value should be
taken as an upper limit because of the high reactivity of •NO2 but can be compared to the aqueous [DFO] equal to 50 μM used in our experiments, which is some 800 times larger than the calculated equilibrium [•NO2]. Consequently, it is reasonable to assume that in the aqueous compartment, the relatively greater DFO concentration could more than compensate for its lower reactivity with tyrosyl radicals, compared to •NO2. Thus in compilation, a conservative comparison of the rate of DFO repair versus the rate of •NO2 addition suggests that repair is favored in excess of two-fold over nitration. Any decrease in the rate constant that describes the DFO + •NO2 reaction would increase the computed repair preferentiality.
We found that tyrosine nitration was completely inhibited by DFO, suggesting effective competition of DFO for trans-membrane protein tyrosyl radicals as well. This may be due to a steep [•NO2] gradient with the membrane concentration being much lower than what occurs in aqueous solution. This would be a kinetic rather than a thermodynamic effect because •NO2 is slightly lipophilic [21,70,71] and may be due to faster consumption of •NO2 (by chemical reactions in the membrane) than diffusion of •NO2 into the membrane. Figure 6 is a schematic cartoon depicting these numerous complexities and contributory factors.
Figure 6. Schematic of the Proposed Differential Mechanisms of Tyrosine Nitration Inhibition.

Under conditions similar to the lung surface compartment, reactive uptake of •NO2 may occur by solutions of AH2 or DFO covering RCM that are chemically bound to the bottom of Petri dishes. At ELF pH (~7.0), essentially all AH2 will exist as ascorbate (AH−). This oversimplified cartoon underscores critical differences between these two substrates that result in efficient inhibition of protein tyrosine nitration by DFO as: (1) a larger flux of NO2 into the AH− solution, indicated by the bold arrow for NO2 uptake, that results from the higher reactivity of AH− for NO2 (also in bold) as compared to DFO. Notice that the higher reactivity of AH− facilitates its role as a direct scavenger of NO2 but also results in faster depletion of AH−, and (2) the larger log D for DFO that allows for partitioning of DFO into the cell membrane and thereby favors reaction of DFO with inter-membrane tyrosyl radicals while AH− remains primarily in the aqueous phase which hinders this reaction [log D (DFO) = −3.56; log D (AH−) = −5.61 at pH 7 (values taken from SciFinder and calculated using Advanced Chemistry Development (ACD/Labs) Software V11.02 (© 1994–2012 ACD/Labs)].
In further support for our mechanism, hydroxamic acids and hydroxyl-amines have been reported to reduce the active site tyrosyl radical of ribonucleotide reductase, which is consistent with reports of DFO and HU inhibiting this enzyme [46,47]. Consequently, application of hydroxamic acids could affect the catalytic activities of other proteins with active site tyrosyl radicals. Non-enzymatic proteins may be important considerations as well [52,54,56–58] since tyrosine nitration of signaling molecules may also disrupt their normal function. Tyrosine nitration may affect protein function and structure, and change the rate of proteolytic degradation of nitrated proteins. Nitration often leads to loss of protein activity but recent proteomic analyses have revealed that a variety of cellular processes may be affected by protein tyrosine nitration in various ways. These processes include energy metabolism, protein, nucleic acid and ion binding, cellular structure and regulation, enzymatic activity control, and cellular signaling, including apoptosis. Thus, therapeutic intervention with hydroxamic acids when their intended use is to chelate ferric ions or inhibit histone deacetylases may have secondary effects. Further investigations are needed to determine whether these secondary effects due to inhibition of protein tyrosine nitration could be beneficiary, or detrimental, against a background of poisoning or disease wherein protein tyrosine nitration levels are found to be elevated.
Numerous investigations have utilized DFO to identify Fe as a critical effecter driving redox perturbations. However, although DFO will clearly sequester Fe, and has been shown to inhibit peroxynitrite-related interactions, if DFO is used as an investigational reagent the precise mechanisms by which altered outcomes occur may not simply involve removal of redox active Fe, limiting nutraceutical Fe availability, or scavenging of oxidant and/or nitrating species but rather, direct action on tyrosyl radical intermediates. Furthermore, DFO enters the cell mostly via endocytosis, which is the same pathway as transferrin, and thus during lysosomal maturation and acidification the Fe is liberated to form “free” redox active (Fenton) Fe. Thus, DFO may serve as an “antioxidant”, Fe chelator, and radical scavenger. Indeed a major new clinical form of DFO is “starch-DFO” which apparently confines its entry to endocytic pathways [73,74]. Such factors need to be considered, for example, if DFO is added to tissue culture media to help preserve supplemental AH2, is included in lung lavage fluids to reduce artifactual antioxidant oxidation, or if administered in vivo if subsequent cell biology studies are to be performed. Consequently, because of the varied functions of DFO, there may be a need to reevaluate some proposed mechanisms related to Fe-mediated events/interactions via the use of non-hydroxamic acid chelators (e.g. DTPA) and a requisite need to both interpret experimental results with appropriate caution and include confirmatory studies using ancillary approaches.
Supplementary Material
Highlights.
DFO robustly inhibits tyrosine nitration (3-NT) independent of Fe chelation.
The mechanism likely involves tyrosyl radical repair preventing •NO2 addition.
More facile reactants scavenge •NO2 but lose 3-NT inhibition due to consumption.
DFO effectively inhibits 3-NT in both aqueous and hydrophobic compartments.
DFO multifunctionalities should be considered during its reagent and clinical use.
Acknowledgments
This work was supported in part by NIH grants R01 HL 54696 (EMP) and P01 ES11617 (EMP). Exposure capabilities were made available through the UAB Environmental Exposure Facility.
Footnotes
Publisher's Disclaimer: This is a PDF file of an unedited manuscript that has been accepted for publication. As a service to our customers we are providing this early version of the manuscript. The manuscript will undergo copyediting, typesetting, and review of the resulting proof before it is published in its final citable form. Please note that during the production process errors may be discovered which could affect the content, and all legal disclaimers that apply to the journal pertain.
Reference List
- 1.Martell AE, Smith RM. Critical Stability Constants. New York: Plenum Press; 1974. [Google Scholar]
- 2.Link G, Pinson A, Hershko C. Ability of the orally effective iron chelators dimethyl- and diethyl-hydroxypyrid-4-one and of deferoxamine to restore sarcolemmal thiolic enzyme activity in iron-loaded heart cells. Blood. 1994;83:2692–2697. [PubMed] [Google Scholar]
- 3.Davies MJ, Donkor R, Dunster CA, Gee CA, Jonas S, Willson RL. Desferrioxamine (Desferal) and superoxide free radicals. Formation of an enzyme-damaging nitroxide. Biochem J. 1987;246:725–729. doi: 10.1042/bj2460725. [DOI] [PMC free article] [PubMed] [Google Scholar]
- 4.Halliwell B. Protection against tissue damage in vivo by desferrioxamine: what is its mechanism of action? Free Radic Biol Med. 1989;7:645–651. doi: 10.1016/0891-5849(89)90145-7. [DOI] [PubMed] [Google Scholar]
- 5.LaLonde C, Ikegami K, Demling R. Aerosolized deferoxamine prevents lung and systemic injury caused by smoke inhalation. J Appl Physiol. 1994;77:2057–2064. doi: 10.1152/jappl.1994.77.5.2057. [DOI] [PubMed] [Google Scholar]
- 6.Meulenbelt J, Dormans JA, van BL, Rombout PJ, Sangster B. Desferrioxamine treatment reduces histological evidence of lung damage in rats after acute nitrogen dioxide (NO2) intoxication. Hum Exp Toxicol. 1993;12:389–395. doi: 10.1177/096032719301200508. [DOI] [PubMed] [Google Scholar]
- 7.Bartesaghi S, Trujillo M, Denicola A, Folkes L, Wardman P, Radi R. Reactions of desferrioxamine with peroxynitrite-derived carbonate and nitrogen dioxide radicals. Free Radic Biol Med. 2004;36:471–483. doi: 10.1016/j.freeradbiomed.2003.10.011. [DOI] [PubMed] [Google Scholar]
- 8.Denicola A, Souza JM, Gatti RM, Augusto O, Radi R. Desferrioxamine inhibition of the hydroxyl radical-like reactivity of peroxynitrite: role of the hydroxamic groups. Free Radic Biol Med. 1995;19:11–19. doi: 10.1016/0891-5849(94)00239-g. [DOI] [PubMed] [Google Scholar]
- 9.Kanner J, Harel S. Desferrioxamine as an electron donor. Inhibition of membranal lipid peroxidation initiated by H2O2-activated metmyoglobin and other peroxidizing systems. Free Radic Res Commun. 1987;3:309–317. doi: 10.3109/10715768709069798. [DOI] [PubMed] [Google Scholar]
- 10.Bartesaghi S, Valez V, Trujillo M, Peluffo G, Romero N, Zhang H, Kalyanaraman B, Radi R. Mechanistic studies of peroxynitrite-mediated tyrosine nitration in membranes using the hydrophobic probe N-t-BOC-L-tyrosine tert-butyl ester. Biochemistry. 2006;45:6813–6825. doi: 10.1021/bi060363x. [DOI] [PubMed] [Google Scholar]
- 11.Hill BG, Dranka BP, Bailey SM, Lancaster JR, rley-Usmar VM. What Part of NO Don’t You Understand? Some Answers to the Cardinal Questions in Nitric Oxide Biology. Journal of Biological Chemistry. 2010;285:19699–19704. doi: 10.1074/jbc.R110.101618. [DOI] [PMC free article] [PubMed] [Google Scholar]
- 12.Pryor WA, Houk KN, Foote CS, Fukuto JM, Ignarro LJ, Squadrito GL, Davies KJA. Free radical biology and medicine: it’s a gas, man! American Journal of Physiology-Regulatory Integrative and Comparative Physiology. 2006;291:R491–R511. doi: 10.1152/ajpregu.00614.2005. [DOI] [PubMed] [Google Scholar]
- 13.Souza JM, Peluffo G, Radi R. Protein tyrosine nitration - Functional alteration or just a biomarker? Free Radical Biology and Medicine. 2008;45:357–366. doi: 10.1016/j.freeradbiomed.2008.04.010. [DOI] [PubMed] [Google Scholar]
- 14.Baldus S, Castro L, Eiserich JP, Freeman BA. Is NO news bad news in acute respiratory distress syndrome? American Journal of Respiratory and Critical Care Medicine. 2001;163:308–310. doi: 10.1164/ajrccm.163.2.ed2000c. [DOI] [PubMed] [Google Scholar]
- 15.Baldus S, Eiserich JP, Brennan ML, Jackson RM, Alexander CB, Freeman BA. Spatial mapping of pulmonary and vascular nitrotyrosine reveals the pivotal role of myeloperoxidase as a catalyst for tyrosine nitration in inflammatory diseases. Free Radical Biology and Medicine. 2002;33:1010–1019. doi: 10.1016/s0891-5849(02)00993-0. [DOI] [PubMed] [Google Scholar]
- 16.Davis IC, Zajac AJ, Nolte KB, Botten J, Hjelle B, Matalon S. Elevated generation of reactive oxygen/nitrogen species in hantavirus cardiopulmonary syndrome. J Virol. 2002;76:8347–8359. doi: 10.1128/JVI.76.16.8347-8359.2002. [DOI] [PMC free article] [PubMed] [Google Scholar]
- 17.Sittipunt C, Steinberg KP, Ruzinski JT, Myles C, Zhu S, Goodman RB, Hudson LD, Matalon S, Martin TR. Nitric oxide and nitrotyrosine in the lungs of patients with acute respiratory distress syndrome. American Journal of Respiratory and Critical Care Medicine. 2001;163:503–510. doi: 10.1164/ajrccm.163.2.2004187. [DOI] [PubMed] [Google Scholar]
- 18.Integrated Science Assessment for Oxides of Nitrogen -- Health Criteria. U.S. Environmental Protection Agency; 2008. [Google Scholar]
- 19.Eiserich JP, Hristova M, Cross CE, Jones AD, Freeman BA, Halliwell B, van der Vliet A. Formation of nitric oxide derived inflammatory oxidants by myeloperoxidase in neutrophils. Nature. 1998;391:393–397. doi: 10.1038/34923. [DOI] [PubMed] [Google Scholar]
- 20.Liu XP, Miller MJS, Joshi MS, Thomas DD, Lancaster JR. Accelerated reaction of nitric oxide with O-2 within the hydrophobic interior of biological membranes. Proceedings of the National Academy of Sciences of the United States of America. 1998;95:2175–2179. doi: 10.1073/pnas.95.5.2175. [DOI] [PMC free article] [PubMed] [Google Scholar]
- 21.Squadrito GL, Postlethwait EM. On the hydrophobicity of nitrogen dioxide: Could there be a “lens” effect for NO2 reaction kinetics? Nitric Oxide-Biology and Chemistry. 2009;21:104–109. doi: 10.1016/j.niox.2009.05.008. [DOI] [PMC free article] [PubMed] [Google Scholar]
- 22.Bidani A, Postlethwait EM. Complexities in Structure and Function of the Lung (Lung Biology in Health and Disease) New York: Marcell Dekker, Inc; 1998. Kinetic Determinants of Reactive Gas Uptake; pp. 243–295. [Google Scholar]
- 23.Postlethwait EM, Bidani A. Mechanisms of Pulmonary NO2 Absorption. Toxicology. 1994;89:217–237. doi: 10.1016/0300-483x(94)90099-x. [DOI] [PubMed] [Google Scholar]
- 24.Hesterberg TW, Bunn WB, McClellan RO, Hamade AK, Long CM, Valberg PA. Critical review of the human data on short-term nitrogen dioxide (NO(2)) exposures: Evidence for NO(2) no-effect levels. Critical Reviews in Toxicology. 2009;39:743–781. doi: 10.3109/10408440903294945. [DOI] [PubMed] [Google Scholar]
- 25.Kirsch M, Korth HG, Sustmann R, de Groot H. The pathobiochemistry of nitrogen dioxide. Biological Chemistry. 2002;383:389–399. doi: 10.1515/BC.2002.043. [DOI] [PubMed] [Google Scholar]
- 26.Latza U, Gerdes S, Baur X. Effects of nitrogen dioxide on human health: Systematic review of experimental and epidemiological studies conducted between 2002 and 2006. International Journal of Hygiene and Environmental Health. 2009;212:271–287. doi: 10.1016/j.ijheh.2008.06.003. [DOI] [PubMed] [Google Scholar]
- 27.Postlethwait EM, Bidani A. Reactive Uptake Governs the Pulmonary Air Space Removal of Inhaled Nitrogen-Dioxide. Journal of Applied Physiology. 1990;68:594–603. doi: 10.1152/jappl.1990.68.2.594. [DOI] [PubMed] [Google Scholar]
- 28.Postlethwait EM, Langford SD, Bidani A. Kinetics of NO2 Air Space Absorption in Isolated Rat Lungs. Journal of Applied Physiology. 1992;73:1939–1945. doi: 10.1152/jappl.1992.73.5.1939. [DOI] [PubMed] [Google Scholar]
- 29.Ford E, Hughes MN, Wardman P. Kinetics of the reactions of nitrogen dioxide with glutathione, cysteine, and uric acid at physiological pH. Free Radic Biol Med. 2002;32:1314–1323. doi: 10.1016/s0891-5849(02)00850-x. [DOI] [PubMed] [Google Scholar]
- 30.Postlethwait EM, Langford SD, Jacobson LM, Bidani A. NO2 Reactive Absorption Substrates in Rat Pulmonary Surface Lining Fluids. Free Radical Biology and Medicine. 1995;19:553–563. doi: 10.1016/0891-5849(95)00058-6. [DOI] [PubMed] [Google Scholar]
- 31.Bastacky J, Lee CY, Goerke J, Koushafar H, Yager D, Kenaga L, Speed TP, Chen Y, Clements JA. Alveolar lining layer is thin and continuous: low-temperature scanning electron microscopy of rat lung. J Appl Physiol. 1995;79:1615–1628. doi: 10.1152/jappl.1995.79.5.1615. [DOI] [PubMed] [Google Scholar]
- 32.Velsor LW, Ballinger CA, Patel J, Postlethwait EM. Influence of epithelial lining fluid lipids on NO(2)-induced membrane oxidation and nitration. Free Radic Biol Med. 2003;34:720–733. doi: 10.1016/s0891-5849(02)01370-9. [DOI] [PubMed] [Google Scholar]
- 33.Velsor LW, Postlethwait EM. NO2-induced generation of extracellular reactive oxygen is mediated by epithelial lining layer antioxidants. Am J Physiol. 1997;273:L1265–L1275. doi: 10.1152/ajplung.1997.273.6.L1265. [DOI] [PubMed] [Google Scholar]
- 34.Bartesaghi S, Wenzel J, Trujillo M, Lopez M, Joseph J, Kalyanaraman B, Radi R. Lipid peroxyl radicals mediate tyrosine dimerization and nitration in membranes 2. Chem Res Toxicol. 2010;23:821–835. doi: 10.1021/tx900446r. [DOI] [PMC free article] [PubMed] [Google Scholar]
- 35.Avner Treinin, Elie Hayon. Absorption spectra and reaction kinetics of NO2, N2O3, and N2O4 in aqueous solution. J Amer Chem Soc. 1970;92(20):5821–5828. Ref Type: Journal (Full) [Google Scholar]
- 36.Nielson DW, Goerke J, Clements JA. Alveolar subphase pH in the lungs of anesthetized rabbits. Proc Natl Acad Sci U S A. 1981;78:7119–7123. doi: 10.1073/pnas.78.11.7119. [DOI] [PMC free article] [PubMed] [Google Scholar]
- 37.Postlethwait EM, Langford SD, Bidani A. Interfacial transfer kinetics of NO2 into pulmonary epithelial lining fluid. J Appl Physiol. 1991;71:1502–1510. doi: 10.1152/jappl.1991.71.4.1502. [DOI] [PubMed] [Google Scholar]
- 38.Suzuki K, Ota H, Sasagawa S, Sakatani T, Fujikura T. Assay method for myeloperoxidase in human polymorphonuclear leukocytes. Anal Biochem. 1983;132:345–352. doi: 10.1016/0003-2697(83)90019-2. [DOI] [PubMed] [Google Scholar]
- 39.Giustarini D, Rossi R, Milzani A, le-Donne I. Nitrite and nitrate measurement by Griess reagent in human plasma: evaluation of interferences and standardization. Methods Enzymol. 2008;440:361–380. doi: 10.1016/S0076-6879(07)00823-3. [DOI] [PubMed] [Google Scholar]
- 40.Buettner GR. In the absence of catalytic metals ascorbate does not autoxidize at pH 7: ascorbate as a test for catalytic metals. J Biochem Biophys Methods. 1988;16:27–40. doi: 10.1016/0165-022x(88)90100-5. [DOI] [PubMed] [Google Scholar]
- 41.Monzyk B, Crumbliss AL. Kinetics and mechanism of the stepwise dissociation of iron(III) from ferrioxamine B in aqueous acid. J Am Chem Soc. 1982;104:4921–4929. [Google Scholar]
- 42.Malencik DA, Sprouse JF, Swanson CA, Anderson SR. Dityrosine: preparation, isolation, and analysis. Anal Biochem. 1996;242:202–213. doi: 10.1006/abio.1996.0454. [DOI] [PubMed] [Google Scholar]
- 43.Mallozzi C, Di Stasi AM, Minetti M. Peroxynitrite modulates tyrosine-dependent signal transduction pathway of human erythrocyte band 3. FASEB J. 1997;11:1281–1290. doi: 10.1096/fasebj.11.14.9409547. [DOI] [PubMed] [Google Scholar]
- 44.Grzelak A, Balcerczyk A, Mateja A, Bartosz G. Hemoglobin can nitrate itself and other proteins. Biochim Biophys Acta. 2001;1528:97–100. doi: 10.1016/s0304-4165(01)00176-3. [DOI] [PubMed] [Google Scholar]
- 45.Burner U, Furtmuller PG, Kettle AJ, Koppenol WH, Obinger C. Mechanism of reaction of myeloperoxidase with nitrite. J Biol Chem. 2000;275:20597–20601. doi: 10.1074/jbc.M000181200. [DOI] [PubMed] [Google Scholar]
- 46.Saban N, Bujak M. Hydroxyurea and hydroxamic acid derivatives as antitumor drugs. Cancer Chemother Pharmacol. 2009;64:213–221. doi: 10.1007/s00280-009-0991-z. [DOI] [PubMed] [Google Scholar]
- 47.Shao J, Zhou B, Zhu L, Bilio AJ, Su L, Yuan YC, Ren S, Lien EJ, Shih J, Yen Y. Determination of the potency and subunit-selectivity of ribonucleotide reductase inhibitors with a recombinant-holoenzyme-based in vitro assay. Biochem Pharmacol. 2005;69:627–634. doi: 10.1016/j.bcp.2004.11.016. [DOI] [PubMed] [Google Scholar]
- 48.Fontecave M, Pierre JL. Mechanisms of formation of free radicals in biological catalysis. Comptes Rendus de l Academie des Sciences Serie Ii Fascicule C-Chimie. 2001;4:531–538. [Google Scholar]
- 49.Stubbe JA, van der Donk WA. Protein radicals in enzyme catalysis (vol 98, pg 705, 1998) Chemical Reviews. 1998;98:2661. doi: 10.1021/cr9400875. [DOI] [PubMed] [Google Scholar]
- 50.Aguiar M, Masse R, Gibbs BF. Regulation of cytochrome P450 by posttranslational modification. Drug Metabolism Reviews. 2005;37:379–404. doi: 10.1081/dmr-46136. [DOI] [PubMed] [Google Scholar]
- 51.Eiserich JP, Estevez AG, Bamberg TV, Ye YZ, Chumley PH, Beckman JS, Freeman BA. Microtubule dysfunction by posttranslational nitrotyrosination of alpha-tubulin: A nitric oxide-dependent mechanism of cellular injury. Proceedings of the National Academy of Sciences of the United States of America. 1999;96:6365–6370. doi: 10.1073/pnas.96.11.6365. [DOI] [PMC free article] [PubMed] [Google Scholar]
- 52.Greenacre SAB, Ischiropoulos H. Tyrosine nitration: Localisation, quantification, consequences for protein function and signal transduction. Free Radical Research. 2001;34:541–581. doi: 10.1080/10715760100300471. [DOI] [PubMed] [Google Scholar]
- 53.Jang B, Han S. Biochemical properties of cytochrome c nitrated by peroxynitrite. Biochimie. 2006;88:53–58. doi: 10.1016/j.biochi.2005.06.016. [DOI] [PubMed] [Google Scholar]
- 54.Matalon S, Shrestha K, Kirk M, Waldheuser S, McDonald B, Smith K, Gao ZQ, Belaaouaj A, Crouch EC. Modification of surfactant protein D by reactive oxygen-nitrogen intermediates is accompanied by loss of aggregating activity, in vitro and in vivo. Faseb Journal. 2009;23:1415–1430. doi: 10.1096/fj.08-120568. [DOI] [PMC free article] [PubMed] [Google Scholar]
- 55.Millan-Crow LA, Cruthirds DL. Invited review - Manganese superoxide dismutase in disease. Free Radical Research. 2001;34:325–336. doi: 10.1080/10715760100300281. [DOI] [PubMed] [Google Scholar]
- 56.Park SW, Huq M, Hu XL, Wei LN. Tyrosine nitration on p65 - A novel mechanism to rapidly inactivate nuclear factor-kappa B. Molecular & Cellular Proteomics. 2005;4:300–309. doi: 10.1074/mcp.M400195-MCP200. [DOI] [PubMed] [Google Scholar]
- 57.Schopfer FJ, Baker PRS, Freeman BA. NO-dependent protein nitration: a cell signaling event or an oxidative inflammatory response? Trends in Biochemical Sciences. 2003;28:646–654. doi: 10.1016/j.tibs.2003.10.006. [DOI] [PubMed] [Google Scholar]
- 58.Siles E, Martinez-Lara E, Nunez MI, Munoz-Gamez JA, Martin-Oliva D, Valenzuela MT, Peinado MA, de Almodovar JMR, Oliver FJ. PARP-1-dependent 3-nitrotyrosine protein modification after DNA damage. Journal of Cellular Biochemistry. 2005;96:709–715. doi: 10.1002/jcb.20570. [DOI] [PubMed] [Google Scholar]
- 59.Bartesaghi S, Wenzel J, Trujillo M, Lopez M, Joseph J, Kalyanaraman B, Radi R. Lipid Peroxyl Radicals Mediate Tyrosine Dimerization and Nitration in Membranes. Chemical Research in Toxicology. 2010;23:821–835. doi: 10.1021/tx900446r. [DOI] [PMC free article] [PubMed] [Google Scholar]
- 60.Alfassi ZB, Huie RE, Neta P, Shoute LCT. Temperature-Dependence of the Rate Constants for Reaction of Inorganic Radicals with Organic Reductants. Journal of Physical Chemistry. 1990;94:8800–8805. [Google Scholar]
- 61.Forni LG, Mora-Arellano VO, Packer JE, Willson RL. Nitrogen dioxide and related free radicals: electron-transfer reactions with organic compounds in solutions containing nitrite or nitrate. J Chem Soc, Perkin Trans. 1986;2:1–6. [Google Scholar]
- 62.Goldstein S, Czapski G, Lind J, Merenyi G. Tyrosine nitration by simultaneous generation of (.)NO and O-(2) under physiological conditions. How the radicals do the job. J Biol Chem. 2000;275:3031–3036. doi: 10.1074/jbc.275.5.3031. [DOI] [PubMed] [Google Scholar]
- 63.Burkitt MJ, Kadiiska MB, Hanna PM, Jordan SJ, Mason RP. Electron-Spin-Resonance Spin-Trapping Investigation Into the Effects of Paraquat and Desferrioxamine on Hydroxyl Radical Generation During Acute Iron Poisoning. Molecular Pharmacology. 1993;43:257–263. [PubMed] [Google Scholar]
- 64.Ikeda-Saito M, Shelley DA, Lu L, Booth KS, Caughey WS, Kimura S. Salicylhydroxamic acid inhibits myeloperoxidase activity. J Biol Chem. 1991;266:3611–3616. [PubMed] [Google Scholar]
- 65.Klebanoff SJ, Waltersdorph AM. Inhibition of peroxidase-catalyzed reactions by deferoxamine. Arch Biochem Biophys. 1988;264:600–606. doi: 10.1016/0003-9861(88)90326-8. [DOI] [PubMed] [Google Scholar]
- 66.Lim CH, Dedon PC, Deen WM. Kinetic analysis of intracellular concentrations of reactive nitrogen species. Chem Res Toxicol. 2008;21:2134–2147. doi: 10.1021/tx800213b. [DOI] [PMC free article] [PubMed] [Google Scholar]
- 67.Morehouse KM, Flitter WD, Mason RP. The enzymatic oxidation of Desferal to a nitroxide free radical. FEBS Lett. 1987;222:246–250. doi: 10.1016/0014-5793(87)80379-4. [DOI] [PubMed] [Google Scholar]
- 68.Ihnat PM, Vennerstrom JL, Robinson DH. Solution equilibria of deferoxamine amides. J Pharm Sci. 2002;91:1733–1741. doi: 10.1002/jps.10168. [DOI] [PubMed] [Google Scholar]
- 69.Sander R. Compilation of Henry’s Law Constants for Inorganic and Organic Species of Potential Importance in Environmental Chemistry (Version 3) 1999 http://www.henrys-law.org.
- 70.Lur’e BA, Arkhipov IV, Apal’kova VN. The N2O4 = 2NO2 Equilibrium in Solutions. Russian Journal of Physical Chemistry. 1986;60:1144–1147. [Google Scholar]
- 71.Mendiara SN, Perissinotti LJ. Dissociation equilibrium of dinitrogen tetroxide in organic solvents: An electron paramagnetic resonance measurement. Applied Magnetic Resonance. 2003;25:323–346. [Google Scholar]
- 72.Prutz WA, Monig H, Butler J, Land EJ. Reactions of nitrogen dioxide in aqueous model systems: oxidation of tyrosine units in peptides and proteins. Arch Biochem Biophys. 1985;243:125–134. doi: 10.1016/0003-9861(85)90780-5. [DOI] [PubMed] [Google Scholar]
- 73.Baird SK, Kurz T, Brunk UT. Metallothionein protects against oxidative stress-induced lysosomal destabilization. Biochemical Journal. 2006;394:275–283. doi: 10.1042/BJ20051143. [DOI] [PMC free article] [PubMed] [Google Scholar]
- 74.Doulias PT, Christoforidis S, Brunk UT, Galaris D. Endosomal and lysosomal effects of desferrioxamine: Protection of HeLa cells from hydrogen peroxide-induced DNA damage and induction of cell-cycle arrest. Free Radical Biology and Medicine. 2003;35:719–728. doi: 10.1016/s0891-5849(03)00396-4. [DOI] [PubMed] [Google Scholar]
Associated Data
This section collects any data citations, data availability statements, or supplementary materials included in this article.