

Abstract
Angiogenesis is essential for solid tumour growth, whilst the molecular profiles of tumour blood vessels have been reported to be different between cancer types. Although presently available anti-angiogenic strategies are providing some promise for the treatment of some cancers it is perhaps not surprisingly that, none of the anti-angiogenic agents available work on all tumours. Thus, the discovery of novel anti-angiogenic targets, relevant to individual cancer types, is required. Using Affymetrix microarray analysis of laser-captured, CD31-positive blood vessels we have identified 63 genes that are upregulated significantly (5–72 fold) in angiogenic blood vessels associated with human invasive ductal carcinoma (IDC) of the breast as compared with blood vessels in normal human breast. We tested the angiogenic capacity of a subset of these genes. Genes were selected based on either their known cellular functions, their enriched expression in endothelial cells and/or their sensitivity to anti-VEGF treatment; all features implicating their involvement in angiogenesis. For example, RRM2, a ribonucleotide reductase involved in DNA synthesis, was upregulated 32-fold in IDC-associated blood vessels; ATF1, a nuclear activating transcription factor involved in cellular growth and survival was upregulated 23-fold in IDC-associated blood vessels and HEX-B, a hexosaminidase involved in the breakdown of GM2 gangliosides, was upregulated 8-fold in IDC-associated blood vessels. Furthermore, in silico analysis confirmed that AFT1 and HEX-B also were enriched in endothelial cells when compared with non-endothelial cells. None of these genes have been reported previously to be involved in neovascularisation. However, our data establish that siRNA depletion of Rrm2, Atf1 or Hex-B had significant anti-angiogenic effects in VEGF-stimulated ex vivo mouse aortic ring assays. Overall, our results provide proof-of-principle that our approach can identify a cohort of potentially novel anti-angiogenic targets that are likley to be, but not exclusivley, relevant to breast cancer.
Introduction
Angiogenesis, the formation of new blood vessels from pre-existing vasculature, is critical for tumour growth and cancer progression, implying that anti-angiogenic drugs are likely to be of importance in the treatment of neoplasia [1], [2]. Angiogenesis is influenced by several growth factors, such as vascular endothelial growth factor (VEGF) and basic fibroblast growth factor (bFGF) [3], [4]. Indeed, anti-angiogenic strategies targeting VEGF have shown some considerable promise, but improvements are still needed. Identifying gene expression changes between tumour-associated blood vessels and those in normal tissues may provide us with new anti-angiogenic targets. Some data have suggested that blood vessels supplying tumours express genes not expressed in blood vessels in normal tissues [5]–[9]. Although results from such studies have yet to be verified, given that the molecular ‘zipcodes’ of tumour-associated vasculatures may be different between cancer types, identifying anti-angiogenic targets relevant to tumour types may have significant benefits over currently available strategies [10]–[14].
Tumours consist of a mixture of cancer and stromal compartments, which have their own gene expression profiles and, as such, analysis of whole tumours is not necessarily appropriate when designing anti-angiogenic agents [15]–[24]. In addition cell culture based studies are open to the criticism that they induce molecular changes, making results less relevant to the disease in the whole organism [7], [8]. An alternative method is to use laser capture microdissection (LCM), which allows for the isolation of specific tissues or cells directly from whole tissue sections [5], [9], [25]–[28]. LCM has been used successfully for PCR- and microarray analysis of specific cell populations including blood vessels [5], [9], [25], [27], [29]. CD31 (PECAM1) is known to be a suitable marker for the identification of angiogenic blood vessels in many tissues, including breast cancer and is used as such in the pathological analysis of breast cancer [30], [31].
Here we have developed a method for the detection of CD31 in human breast cancer and normal human breast, followed by LCM of CD31-positive blood vessels and subsequent expression array analysis. We have identified 7 downregulated and 63 upregulated genes associated with human breast cancer CD31-postive blood vessels. Our data has demonstrated that at least 3 of these genes, Rrm2, Atf1 and Hex-B, when depleted in mouse aortic rings, have anti-angiogenic effects, validating our approach to the discovery of new anti-angiogenic targets.
Methods
Ethics Statement
Frozen human breast tissues were obtained from Barts and The London School of Medicine and Dentistry, Queen Mary University and Oxford John Radcliffe Hospital Biobank, a Human Tissue Authority Licensed Research Tissue Bank (HTA License number 12217). All patients gave informed written consent. For samples from Queen Mary University, the project was covered by ethics reference 05/Q0403/199 from the North East London ethics committee. For samples from Oxford John Radcliffe Hospital Biobank, the project was covered by ethics reference 09/H0606/5 from the National Research ethics service Oxfordshire. All animals were used in accordance with UK Home Office regulations and approved by the Queen Mary University of London and Oxford University ethics committee.
Breast tissue, preparation and processing
Twenty-eight breast IDC and 13 normal breast samples were screened for suitability. Eight μm sections of tissue from frozen breast blocks were first trimmed using a cryostat set at −30°C to test RNA quality and morphology using haematoxylin staining. Only samples with RNA integrity number (RIN) of 6 or more were used (see RNA extraction protocol). RNase-free technique was used throughout the procedure using RNase-ZAP (Ambion). Up to 3 sections 8 µm thick were cut with the cryostat and placed on a treated PALM membrane polyethylene naphthalate slides (PALM Microlaser Technologies, Bernried, Germany). Up to 20 slides were collected per patient. Slides were stored on dry ice until sectioning was finished then immediately transferred to a −80°C freezer for long-term storage. The slides were stored up to 2 months before LCM.
Immunohistochemistry for LCM
Immunochemistry staining of sections for LCM was optimised for maintenance of RNA quality. For endothelial-specific CD31 staining, sections were fixed in acetone (5 min, −20°C), and incubated with primary antibody anti-CD31 (WM59, BD Pharmingen™) 1∶5 for 5 min followed by two PBS (Ambion) washes, biotinylated secondary antibody (Vectastain Universal Quick kit PK8800 – Vector labs) for 5 min, two PBS washes, StreptABCcomplex/HRP (Vectastain Universal Quick kit PK8800 – Vector labs) for 5 min, two PBS washes, amino-ethyl-carbazole (AEC, Dako K3464) for 5 min, two water washes (Ambion), Cresyl Violet 1∶20 in water (Ambion, AM1935) for 30 sec, two water washes and finally air-dried for up to 1 min with a hair-dryer. All antibody steps and AEC contained the RNase inhibitor 0.4 U/µL RNase Protector (Roche; Indianapolis, IN), and all PBS and water were nuclease free. All steps were carried out in RNase-free conditions. LCM was carried out immediately using the Zeiss Axiovert 135 with PALM Microbeam 3 System and RoboSoftware (Carl Zeiss Europe). In combination with CD31 expression, blood vessels were selected by morphology, where only small vessels with lumens or branching structures were collected. This method allowed for the isolation of whole blood vessel sections that include both endothelial cells and supporting cells. Approximately 200 blood vessels were captured onto adhesive lids of eppendorfs (PALM) per slide and lysed in 50 µl RNA lysis buffer (Qiagen RNeasy Micro Kit). Up to 3 hr of LCM was spent per slide. Blood vessels from up to 20 slides per patient were captured for combined RNA extraction. Details for staining for CD68 and CD31 are in Methods S1.
RNA extraction, reverse transcriptase and real-time PCR
RNA extraction was carried out using Qiagen RNeasy Mini or Micro Kit following the manufacturer's instructions with DNase treatment (Qiagen). RNA concentration and quality was analysed with Agilent 2100 Bio-analyzer (Agilent Technologies, Palo Alto, CA) using Agilent Pico kit or Nano kit and assessed using an Agilent software algorithm that allows the calculation of RIN with a numbering system from 1 to 10, with 1 being the most degraded and 10 being the most intact [32]. Only samples that had high RIN number of above 6 were considered for analysis. cDNA from RNA was synthesised using the High Capacity cDNA Archive Kit (Applied Biosystems, Foster City, CA) following the manufacturer's instructions. To determine if LCM captured samples had blood vessels, real-time PCR was used to quantify the expression of CD31 mRNA. Real-time PCR reactions were performed using the Applied Biosystem StepOnePlusTM (Applied Biosystems, Foster City, CA) with SYBR green (Invitrogen). Primers against CD31 5′-AGAAAACCACTGCAGAGTACCAG-3′ forward and 5′-GGCCTCTTTCTTGTCCAGTGT-3′ reverse (Invitrogen, Paisley, UK). Glucose-6-phosphate dehydrogenase (G6PD) was used as a reference gene using primers 5′-AACAGAGTGAGCCCTTCTTAA-3′ forward and 5′-GGAGGCTGCATCATCGTACT-3′ reverse. Additional primers for validating differentially expressed genes are in supporting information (Methods S1 and Table S1).
Microarray experiments
RNA from LCM samples was amplified using the WT (whole transcriptome)-Ovation Pico RNA Amplification system (NuGEN) with a 2-cycle amplification following the manufacturer's instructions, and cDNA was fragmented and labelled using the FL-Ovation cDNA Biotin Module V2 kit. Although 2-cycle amplification may introduce a bias over 1-cycle, we were careful to control for this by amplifying both the cancer and normal samples identically. Labelled cDNA Microarray hybridisations were performed on HG-U133 Plus 2 arrays (Affymetrix) and gene expression data was analysed using Bioconductor 2.2 [33] running on R2.7.1. [34]. Normalised probeset expression measures were calculated using the ‘Affy’ package's Robust Multichip Average (RMA) default method. Differential gene expression was assessed between replicate groups using an empirical Bayes t-test as implemented in the ‘limma’ package [35]. The resultant p-values were adjusted for multiple testing using the False Discovery Rate (FDR) Benjamini and Hochberg method [36], where any probe sets that exhibited an adjusted p-value FDR q<0.05 were called differentially expressed. Two-dimensional hierarchical clustering of expression data using differentially expressed genes was performed using a Pearson correlation distance matrix and average linkage clustering [34]. All data have been deposited in a public database. Affymetrix data was also analysed with Ingenuity Pathways Analysis software (Ingenuity® Systems, www.ingenuity.com). Additional Microarray analysis was carried on human U87 xenograft samples (Methods S1).
Endothelial specific genes
All genes found to be differentially expressed from the microarray results were compared to genes selectively expressed in endothelial cells from cDNA and SAGE library analysis. Briefly, libraries were divided into two pools; pool 1 contained endothelial cell libraries and pool 2 libraries of non-endothelial normal primary cell isolates. In-silico subtraction, employing maximum likelihood statistics, between both pools found endothelial-enriched genes and these results were used to prioritise LCM candidate genes. See Herbert et al. 2008 for a full description of methods [37]. The results shown are the FDR-adjusted q-values [38].
Immunohistochemistry for GPR164 and LIFR
Frozen sections (8 µm thickness) were fixed in acetone for 5 min (−20°C), washed in PBS, blocked with 5% BSA/PBS for 30 min and incubated with primary antibodies (LIFR: 1/50, Santa Cruz sc-659; GPR164: 1/400, Abcam ab65759, CD31: 1/100, BD Pharmingen 550389) overnight at 4°C. Sections were washed in PBS before adding the appropriate fluorescent secondary antibodies for 1 hr at room temperature and mounted with ProLong Gold® anti-fade reagent with DAPI (Invitrogen P-36931). Sections were imaged using a LSM 510 inverted confocal laser-scanning microscope (Carl Zeiss Ltd., UK). For each channel, the detector gain and amplifier offset were set to display the full range of signal intensities within and between samples and then adjusted to exclude background. These settings were kept the same when imaging all the patients' samples. Consecutive sections from each patient were also stained with appropriate IgG control antibodies and imaged using the same settings. Staining was quantified in the CD31-positive blood vessels using ImageJ software. Blood vessels were identified by their CD31 positivity and the corresponding GPR164 or LIFR fluorescence intensity per pixel was measured. ImageJ software was used to evaluate the mean relative intensity of fluorescence for these markers in blood vessels within the sections. In order to normalise blood vessel-specific immunostaining for GPR164 and LIFR between samples, it was necessary to correct for differences in non-specific staining. This was done by analysing the mean fluorescence intensity of IgG non-specific staining in the CD31-positive blood vessels and then subtracting from the specific staining obtained with GPR164 or LIFR for each sample. This allowed us to overcome the heterogeneity of the non-specific staining between different patients. Four to five blood vessels from 6 normal breast and 6 breast IDC samples were quantified. Results are shown as the mean relative intensities of the samples ± s.e.m. Statistical significance was determined by Student's t-test at a level of p<0.05.
Ex vivo Aortic Ring Assays
Thoracic aortas were isolated from adult C57BL6 mice and prepared for culture as described previously [39]. Depletion of target genes with siRNA was carried out essentially as described in Reynolds et al., [40]. Microvessels growth on aortic rings were quantified between 6–10 days. After maximum sprouting capacity was achieved, aortic rings were fixed and stained with BS1-lectin as described in Reynolds et al., [41].
Results
Laser Capture Microdissection of blood vessels from human breast tissue
Twenty-eight human IDC samples and 13 normal human breast samples were obtained and snap-frozen in liquid nitrogen. Although using snap-frozen tissue probably provides the best preservation of RNA without fixation, there are many factors, such as handling time and especially the interval between surgery and snap-freezing the sample, that can affect the quality of the RNA in breast tissue. Out of all the samples collected, only 16 IDC samples and 6 normal breast samples had high enough RNA quality (a RIN above 6) for further analysis according to Agilent lab-on-a-chip pKit bioanalyser ( Figure 1A and B ).
Figure 1. RNA profile and quality of frozen breast IDC samples.

RNA profiles of (A) IDC and (B) normal breast samples using Agilent bioanalyser. RNA bands correspond to 28S and 18S rRNA. RNA quality was rated according to the RNA integrity number (RIN).
An anti-CD31 antibody was used to identify the blood vessels in normal and breast IDC sections. This was in preference to other markers, such as CD146, since CD146, in addition to its expression in the vascular compartment, is expressed on a subset of epithelial cells in malignant breast [42]. Lastly, comparison of PECAM staining directly with CD146 staining has shown that, CD146 identifies a substantially higher number of non–blood vessels structures in serial sections of breast cancer [43]. Thus the use of PECAM as a marker of endothelial cells, together with blood vessel selection according to morphology, likely provides us with a highly specific method to detect blood vessels in breast cancer. The quality of the immunodetection was excellent for both breast IDC and normal sections and blood vessels were identified easily for LCM ( Figure 2 A and B). By using a combination of both CD31-positivity and morphology, to select blood vessels with a lumen or a branched structure, we avoided the possibility of selecting myeloid cells that are CD31/CD68 double positive. (Methods S1 and Figure S1).
Figure 2. Combined CD31-immunostaining and LCM of blood vessels in breast tissue.

(A) Normal and IDC breast sections were stained with anti-CD31 monoclonal antibody using our modified staining protocol. Blood vessels are stained in red with CD31-AEC (Arrowheads, blood vessels), and cell nuclei are stained in blue with Cresyl Violet. (B) PALM laser microdissection of CD31-positive blood vessels. (C) Agilent bioanalyser of RNA from LCM blood vessels compared with unstained control and CD31 stained sections. RNA quality was rated according to the RNA integrity number (RIN). Histograms correspond to RNA bioanalyser profiles. (D) Real-time PCR of CD31 mRNA expression in LCM blood vessels from breast tissue confirms high level of CD31 in laser captured material. CD31 mRNA expression was given as a ratio to G6PD mRNA (internal control), and the data represented relative to unstained sample control (n = 2, ± fold range, *p<0.05).
Although good quality RNA was obtained from LCM samples ( Figure 2C ), up to 70% of total RNA was lost following immunostaining compared with unstained equal sized tissue samples. Thus, using this staining protocol, 7 out of 16 cancer and 5 out of 6 normal samples gave sufficiently good RNA quality and quantity for Affymetrix analysis (Methods S1 and Figure S2). Using real-time PCR we confirmed that the tissue samples isolated by LCM were enriched significantly for CD31 when compared with whole control unstained sections (p<0.05, Figure 2D ).
Identifying genes that are differentially regulated in blood vessels associated with human breast cancer
Using the WT (whole transcriptome) Ovation Pico RNA Amplification system, we amplified RNA levels to 2.6–6.3 µg of labelled cDNA from 5 IDC and 4 normal breast samples. The yield from the remainder of the samples was too low for utilisation. For Affymetrix gene expression analysis we compared laser-captured CD31-positive blood vessels from 5 IDC samples (2.8–6.3 µg cDNA) with vessels from 4 normal breast samples (2.6−3.9 µg cDNA). Other studies using frozen tissues gave an average present call rate of 26% [44]. We obtained present call rates of up to 59.2% from our samples, suggesting a good level of hybridisation in our experiments. Hierarchal clustering revealed that 3 IDC and 3 normal breast associated blood vessel samples correlated well and clustered into normal and cancer groups ( Figure 3A ). Samples with low percent call rates corresponded to outliers that were omitted from the subsequent analysis ( Figure 3A ). In total, 73 probe sets representing 70 genes were differentially expressed between normal and breast IDC associated blood vessels ( Figure 3B ). Seven genes were downregulated (more than 10 fold) and 63 genes upregulated (5–72 fold) with FDR q<0.05 ( Tables 1 and 2 ). Using Ingenuity Pathway Analysis, we found that the 70 differentially expressed genes in human breast IDC associated blood vessels have molecular, cellular and signalling functions many of which are involved in angiogenesis ( Tables 3 and 4 ). Thus the upregulated gene list provided us with a cohort of potentially anti-angiogenic targets.
Figure 3. Affymetrix data from LCM blood vessels.

(A) Hierarchal clustering of laser captured blood vessels from 4 normal and 5 IDC samples with percentage present call rate. (B) Heat map that shows the trend in expression of 73 probe-sets, 70 genes across the six samples. The blue indicates under-expression while the red indicates over-expression with gene name and accession number given.
Table 1. Seven of the most downregulated genes in breast IDC associated blood vessels with q<0.05.
| Gene | Accession | Description | Fold change |
| TACC1 | AL133564 | Transforming, acidic coiled-coil containing protein 1 | 0.09 |
| CUGBP2 | R49146 | CUG triplet repeat, RNA binding protein 2 | 0.08 |
| TSHZ2 | AU147926 | Teashirt zinc finger homeobox 2 | 0.07 |
| HIF3A | AK021881 | Hypoxia inducible factor 3, alpha subunit | 0.05 |
| LIFR | NM_002310 | Leukemia inhibitory factor receptor alpha | 0.04 |
| ANKRD29 | AI307802 | Ankyrin repeat domain 29 | 0.04 |
| CD300LG | NM_145273 | CD300 molecule-like family member g | 0.01 |
Table 2. Sixty-three of the most upregulated genes in breast IDC associated blood vessels with greater than 5 fold change and q<0.05.
| Gene | Accession | Description | Fold change |
| AI343467 | NA | 72 | |
| BC042986 | NA | 65 | |
| C2orf37 | AK021599 | Chromosome 2 open reading frame 37 | 64 |
| H2AFZ | NM_002106 | H2A histone family, member Z | 40 |
| TOP2A | AU159942 | Topoisomerase (DNA) II alpha 170kDa | 39 |
| EDG3 | AA534817 | Endothelial differentiation, sphingolipid G-protein-coupled receptor, 3 | 37 |
| PCNA | NM_002592 | Proliferating cell nuclear antigen | 32 |
| RRM2 | BE966236 | Ribonucleotide reductase M2 polypeptide | 32 |
| FN1 | AJ276395 | Fibronectin 1 | 31 |
| CENPF | U30872 | centromere protein F, 350/400ka (mitosin) | 25 |
| TMTC3 | AA428286 | Transmembrane and tetratricopeptide repeat containing 3 | 25 |
| MRPL15 | NM_014175 | Mitochondrial ribosomal protein L15 | 24 |
| ATF1 | CA337502 | Activating transcription factor 1 | 23 |
| NRAS | NM_002524 | Neuroblastoma RAS viral (v-ras) oncogene homolog | 22 |
| PCDH17 | N69091 | Protocadherin 17 | 22 |
| C1orf107 | NM_014388 | Chromosome 1 open reading frame 107 | 21 |
| PRO1933 | AF132203 | PRO1933 | 21 |
| MLF1IP | NM_024629 | MLF1 interacting protein | 20 |
| TMED2 | NM_006815 | Transmembrane emp24 domain trafficking protein 2 | 20 |
| ATP5O | NM_001697 | ATP synthase, H+ transporting, mitochondrial F1 complex, O subunit | 19 |
| XIAP | N30645 | X-linked inhibitor of apoptosis | 19 |
| ABCD3 | BC009712 | ATP-binding cassette, sub-family D (ALD), member 3 | 17 |
| TUBB | BC001002 | Tubulin, beta | 17 |
| SLMO2 | BF032213 | Slowmo homolog 2 (Drosophila) | 17 |
| YES1 | NM_005433 | v-yes-1 Yamaguchi sarcoma viral oncogene homolog 1 | 17 |
| SH3BGRL2 | BE550855 | SH3 domain binding glutamic acid-rich protein like 2 | 17 |
| ATP6AP2 | NM_005765 | ATPase, H+ transporting, lysosomal accessory protein 2 | 16 |
| MGC9913 | BE855713 | Hypothetical protein MGC9913 | 15 |
| MPZL1 | BF978611 | Myelin protein zero-like 1 | 15 |
| DKFZP686E2158 | BE613001 | Hypothetical protein LOC643155 | 15 |
| EIF2S1 | BC002513 | Eukaryotic translation initiation factor 2, subunit 1 alpha | 15 |
| SERF1A | AF073518 | Small EDRK-rich factor 1A (telomeric) | 14 |
| CETN2 | BC005334 | Centrin, EF-hand protein, 2 | 13 |
| DLG7 | NM_014750 | Discs, large homolog 7 (Drosophila) | 13 |
| SLC1A4 | W72527 | Solute carrier family 1 (glutamate/neutral amino acid transporter), member 4 | 13 |
| SMARCA2 | NM_003070 | SWI/SNF related, matrix associated, actin dependent regulator of chromatin, subfamily a, member 2 | 13 |
| ATP6V1C1 | NM_001695 | ATPase, H+ transporting, lysosomal 42kDa, V1 subunit C1 | 13 |
| GPR137B | NM_003272 | G protein-coupled receptor 137B | 13 |
| C1orf149 | NM_022756 | Chromosome 1 open reading frame 149 | 12 |
| UBE2J1 | NM_016021 | Ubiquitin-conjugating enzyme E2, J1 | 12 |
| CCDC117 | AW070234 | Coiled-coil domain containing 117 | 12 |
| KLHL12 | AK024412 | Kelch-like 12 (Drosophila) | 11 |
| EXOC8 | AI168350 | Exocyst complex component 8 | 11 |
| GPR164 | AI694767 | Olfactory receptor, family 51, subfamily E, member 1 | 11 |
| COL4A2 | X05610 | Collagen, type IV, alpha 2 | 10 |
| YIPF5 | AW001618 | Yip1 domain family, member 5 | 10 |
| EIF3J | BC002719 | Eukaryotic translation initiation factor 3, subunit J | 9 |
| FYTTD1 | BF576005 | Forty-two-three domain containing 1 | 9 |
| SNTB1 | BG484314 | Syntrophin, beta 1 (dystrophin-associated protein A1, 59kDa, basic component 1) | 9 |
| LOC401233 | BI868572 | Similar to HIV TAT specific factor 1; cofactor required for Tat activation of HIV-1 transcription | 9 |
| SMURF2 | AU157259 | SMAD specific E3 ubiquitin protein ligase 2 | 8 |
| HEXB | NM_000521 | Hexosaminidase B (beta polypeptide) | 8 |
| NCK2 | BC000103 | NCK adaptor protein 2 | 8 |
| BF676081 | NA | 7 | |
| SCYL2 | NM_017988 | SCY1-like 2 (S. cerevisiae) | 7 |
| OLFML2A | AL050002 | Olfactomedin-like 2A | 7 |
| LIN9 | BF697734 | Lin-9 homolog (C. elegans) | 7 |
| WASL | AL523820 | Wiskott-Aldrich syndrome-like | 6 |
| PLXNA2 | AI694545 | Plexin A2 | 6 |
| FBXO21 | AK001699 | F-box protein 21 | 6 |
| HMMR | NM_012485 | Hyaluronan-mediated motility receptor (RHAMM) | 6 |
| FAM33A | BE048371 | Family with sequence similarity 33, member A | 5 |
| FIGNL1 | NM_022116 | Fidgetin-like 1 | 5 |
Table 3. Molecular and Cellular Function Ingenuity analysis of differentially regulated genes in human breast IDC associated blood vessels.
| Name | p-value | Molecules |
| Cellular Assembly and Organisation | 3.63E-07 | 11 |
| Cellular Function and Maintenance | 2.63E-05 | 9 |
| Protein Synthesis | 3.85E-05 | 8 |
| Cell Cycle | 2.12E-04 | 7 |
| Energy Production | 2.71E-04 | 3 |
Table 4. Canonical Ingenuity pathway analysis of differentially regulated genes in human breast IDC associated blood vessels.
| Pathway | p-value | Molecules |
| Role of BRCA1 in DNA Damage Response | 0.008 | 2 |
| Ephrin Receptor Signalling | 0.011 | 3 |
| Protein Ubiquitination Pathway | 0.013 | 3 |
| Integrin Signalling | 0.015 | 3 |
| Axonal Guidance Signalling | 0.017 | 4 |
| BMP Signalling Pathway | 0.018 | 2 |
| TGF-β Signalling | 0.019 | 2 |
| VEGF Signalling | 0.021 | 2 |
We then compared the list of 63 genes that were upregulated in IDC-associated blood vessels with a list of mouse stromal genes that were downregulated following treatment with the anti-VEGF agent (Bevacizumab) (For details on methods relevant to this section see Supplementary Information, Method S1 and Figure S3). This allowed the identification of IDC-associated blood vessel genes that were likely to be regulated by VEGF. Bevacizumab is an anti-angiogenic agent that prevents human VEGF from binding and activating VEGF-receptor 2 on endothelial cells, resulting in the downregulation of stromal genes that contribute to angiogenesis. We injected BALB/c SCID mice with human U87 tumour cells and then treated the mice with Bevacizumab or placebo. Whole tumours, including tumour stroma, were then analysed using mouse-specific arrays. This approach enabled us to examine the effect of Bevacizumab on downregulating genes in the mouse tumour stroma. By cross-referencing the IDC blood vessel gene list with the genes downregulated after Bevazicumab treatment, we show that the greatest proportion (65%) of the genes upregulated in IDC blood vessels are also downregulated in the tumour stroma after Bevacizumab treatment. The results from this combined approach indicate that we have identified a group of genes that may also play an important part in VEGF-mediated angiogenesis. These data thus provided us with a further suggestion of the potential angiogenic function of the genes that were upregulated in IDC-associated blood vessels.
Identifying genes enriched in endothelial cells
Targeting endothelial cells, specifically, is one approach to reducing the potential side-effects of novel anti-angiogenic strategies. Thus, we asked whether any of the genes that were upregulated in IDC-associated blood vessels were also enriched in endothelial cells. Earlier work from Herbert et al. found endothelial cell enriched genes using cDNA libraries [37]. By cross-referencing these genes with IDC-associated vessel genes, we found 6 genes that were expressed significantly in endothelial cells (q<0.05) compared with non-endothelial cells ( Figure 4 ). Table 5 shows the list of endothelial-expressed genes where SMURF2, LIFR, HEX-B, C1orf107, ATF1 and NRAS were enriched significantly in endothelial cells (q<0.05). Together, these results indicate that by using this approach we can identify not only genes that are upregulated significantly in blood vessels associated with human breast IDC, but also further refine the list to mark those with an enriched expression profile in endothelial cells.
Figure 4. Pie chart of differentially expressed genes in breast IDC LCM blood vessels cross-referenced to endothelial cell libraries.
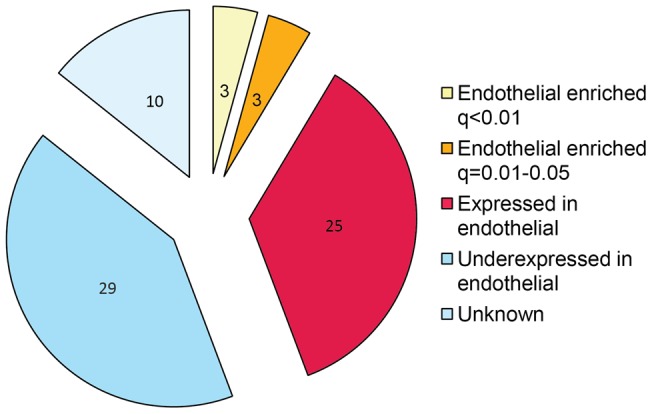
In-silico subtraction, employing maximum likelihood statistics, between endothelial and non-endothelial pools found endothelial enriched genes and were used to prioritise LCM candidate genes. To account for multiple testing errors, a FDR was employed to calculate the significance of the genes being endothelial specific (q<0.05).
Table 5. List of genes enriched in endothelial cells in LCM samples.
| Gene | Accession | Endothelial EST log2 fold change | q-value |
| SMURF2 | AU157259 | 9.00 | <0.01 |
| LIFR | NM_002310 | 8.00 | <0.01 |
| HEXB | NM_000521 | 3.36 | <0.01 |
| C1orf107 | NM_014388 | 4.46 | 0.01 |
| ATF1 | CA337502 | 3.00 | 0.02 |
| NRAS | NM_002524 | 4.13 | 0.04 |
| TACC1 | AL133564 | 2.40 | 0.09 |
| GPR137B | NM_003272 | 2.00 | 0.1 |
| YIPF5 | AW001618 | 1.77 | 0.17 |
| YES1 | NM_005433 | 2.55 | 0.18 |
| ATP5O | NM_001697 | 1.08 | 0.26 |
| TMED2 | NM_006815 | 1.13 | 0.29 |
| EXOC8 | AI168350 | 1.00 | 0.29 |
| MRPL15 | NM_014175 | 2.13 | 0.44 |
| PCNA | NM_002592 | 0.72 | 0.53 |
| ATP6V1C1 | NM_001695 | 1.13 | 0.53 |
| SCYL2 | NM_017988 | 2.13 | 0.57 |
| RRM2 | BE966236 | 0.72 | 0.57 |
| DLG7 | NM_014750 | 1.13 | 0.57 |
| KLHL12 | AK024412 | 0.91 | 0.59 |
| UBE2J1 | NM_016021 | 0.72 | 0.62 |
| SLMO2 | BF032213 | 0.68 | 0.62 |
| MLF1IP | NM_024629 | 1.13 | 0.62 |
| FAM33A | BE048371 | 0.72 | 0.62 |
| CCDC117 | AW070234 | 0.81 | 0.62 |
| TMTC3 | AA428286 | 0.55 | 0.72 |
| EIF3J | BC002719 | 0.40 | 0.75 |
| TOP2A | AU159942 | 0.33 | 0.76 |
| WASL | AL523820 | 0.55 | 0.81 |
| FIGNL1 | NM_022116 | 0.55 | 0.81 |
| ABCD3 | BC009712 | 0.13 | 0.94 |
Genes were grouped according to the significance of them being enriched in endothelial cells compared with non-endothelial cells based on expression sequenced tags (ESTs). To account for multiple testing errors, an FDR was employed to calculate the significance of the genes being endothelial enriched (q<0.05). Bold text indicates genes that are significantly enriched in endothelial cells with a q-value of <0.05.
Immunofluorescence validation of GPR164 and LIFR
The object of this study was to discover novel functional regulators of angiogenesis. Since mRNA levels do not always correspond to either protein levels or functionality, they may have limited physiological relevance. Thus we examined protein expression levels and functionality of a subset of candidate molecules identified in the arrays. In addition to the list of endothelial-enriched genes and those that were also downregulated by Bevacizumab, for validation purposes, we analysed the expression of proteins that are encoded by differentially regulated IDC genes that have no known roles in angiogenesis but were expressed at the cell surface. For example, GPR164 and LIFR are both found at the cell surface. By immunofluorescence microscopy we showed that GPR164 and LIFR were differentially expressed in breast IDC compared to normal breast samples, as our differential gene expression arrays predicted ( Figure 5 ). Immunofluorescence for other candidate proteins was not technically possible due to the lack of antibody reactivity in whole tissue sections.
Figure 5. Validation of GPR164 and LIFR microarray expression data by immunofluorescence staining of human normal breast and IDC.

Representative confocal images of vessels from normal and IDC breast sections immunostained for CD31 and either GPR164 (A) or LIFR (B). Relative expression levels were quantified and means + s.e.m. are given for each antigen. n = 6 individual tissue samples, *p<0.05, ‡ p<0.06, scale bars 50 µm.
Identifying novel anti-angiogenic targets
Given that our goal, was to identify targets with anti-angiogenic potential we focused on siRNA-depletion of these candidate genes in aortic ring assays. We examined the angiogenic capacity of a subset of the 63 genes that were upregulated significantly in IDC-associated blood vessels. This subset of genes were selected on either their known cellular functions and/or enriched expression in endothelial cells. The selected genes included NRAS, SMURF2, ATF1 and HEX-B because of their high expression in endothelial cells. In addition, given that LIFR was downregulated in IDC-associated blood vessels this gene was also included as a potential negative regulator of angiogenesis. GPR164 was selected because it is expressed at the cell surface, making it potentially targetable, and has been shown to be upregulated in prostate cancer [45]. RRM2 was selected because this molecule has been shown to be involved in cell proliferation and associated with VEGF production in cancer cells, but never studied in endothelial cells [46]. siRNA depletion of these genes in aortic ring assays was used to determine their role in inhibiting VEGF-induced angiogenesis. The degree of knockdown was confirmed by real-time PCR (Methods S1 and Figure S4). Aortic rings were treated with siRNA for 24 hr, and cultured in 30 ng/ml VEGF or PBS as a control for up to 10 days ( Figure 6 ). Aortic rings responded to VEGF-stimulation with a significant (p<0.05) increase in microvessel number compared with PBS treated aortic rings ( Figure 6B ). Treatment with siRNA against Rrm2, Atf1 and Hex-B, reduced VEGF-stimulated microvessel sprouting significantly when compared with SCM siRNA treated aortic rings (p<0.05). No significant decrease in microvessel sprouting was observed with siRNA against Lifr, Gpr164, Nras or Smurf2. These results indicate that Rrm2, Atf1 and Hex-B are positively involved in VEGF induced angiogenesis. Thus, our results establish novel roles for these molecules in VEGF-induced angiogenesis. Together these results suggest that, RRM2, ATF1 and HEX-B may be good candidates for anti-angiogenic therapy.
Figure 6. Depletion of Rrm2, HexB and Atf1 inhibits VEGF-stimulated angiogenesis.

(A) Confocal micrographs of aortic ring microvessel sprouting immunostained with BS1-lectin (green) and DAPI (blue) following growth in serum free media or 30 ng/ml VEGF and treatment with siRNA targeting scrambled control (SCM), Lifr, Gpr164, Nras, Smurf2, Rrm2, Atf1, and Hex-B. (B) Bar-chart represents mean number of microvessel sprouts/aortic ring given relative to SCM with VEGF + s.e.m. *p<0.05, nsd, no significant difference. n = 12–24 aortic rings per test. Scale bar, 200 µm.
Discussion
The VEGF-signalling blocker Bevacizumab, can provide overall survival (OS) benefit in colorectal, renal and some breast cancer patients [47]–[50]. Unfortunately however, not all anti-angiogenic approaches have been as successful and differential tumour responses, even for Bevacizumab, may reflect differential blood vessel molecular profiles from varying tumour types [5]–[9]. For example, phage-display peptide libraries have demonstrated heterogeneity in tumour-associated blood vessels [11]–[14]. In addition, blood vessels from ovarian cancer, lung cancer and melanoma have been reported to express significantly different vascular molecular profiles [5]. Importantly, results between studies have not always identified the same molecular profiles for tumour associated blood vessels possibly reflecting different methodological approaches. However, if we accept that different tumours have different vascular molecular profiles, we hypothesise that effective anti-angiogenic treatments will likely rely on tailoring new anti-angiogenic drugs to specific cancer vascular profiles.
Previously, the pit-falls in identifying specific cancer-associated vascular profiles have been related to methodology: expression analyses were done either on cultured cells or on whole cancer samples. The problem being that these systems do not discriminate blood vessels from the rest of the cancer and can also introduce molecular changes associated with culturing cells [6]–[8]. In addition, knowing which blood vessel marker to use has been an issue. For example, selection of CD146-positive cells from colorectal cancer [8] was used to identify blood vessel. However CD146 is also expressed in smooth muscle cells, which are abundant in this cancer type, suggesting that any differential gene expression data would include both myofibroblast and blood vessel genes. Here, we have overcome such problems by using laser capture microdissection of CD31-positive blood vessels to isolate blood vessels without altering, drastically, their molecular make-up. Although previous work has demonstrated that LCD of factor VIII-positive blood vessels identifies differentially regulated genes associated with breast cancer, none of these genes are proven to have anti-angiogenic efficacy. This is likely because factor VIII is not a marker of angiogenic, but rather quiescent, blood vessels and is also found in adjacent extracellular matrix [9], [30], [51]–[54]. In addition, we have used the 2-cycle amplification Nugene Ovation kit to amplify RNA, which is preferable to the T7Oligo(dT) method used by Bhati et al. [9], [55] because it has the advantage of amplifying higher numbers of genes from small amounts of RNA [55]. Variations in the differentially expressed genes identified by us or other groups [5], [9] likely reflect differences in either the cancer types studied, or the method used.
We have identified 70 differentially regulated genes that are associated with CD31-positive blood vessels in human breast IDC when compared with normal breast (5 fold or more, q<0.05). These genes potentially encode biomarkers and/or anti-angiogenic targets relevant to breast cancer. Given that vascular maturity is defined as vessels with a defined basement membrane and endothelial cells with close cell-cell junctions and association with pericytes/smooth muscle cells [56], LCM captured vessels may also contain some supporting cells and our data may highlight genes associated with vascular maturity. This would be of interest to pursue since vascular maturity has been associated with resistance to anti-VEGF therapy [57].
By comparing our differentiated gene list with genes that were regulated by inhibiting VEGF with Bevacizumab in human glioblastoma U87 xenografts, we found that 65% that were highly expressed in IDC blood vessels were also downregulated by Bevacizumab. A glioblastoma cell line was chosen, in these xenograft experiments, because it is highly vascularised, reproducible, does not have a high basal necrosis and responds well to Bevacizumab. Glioblastoma is also a tumour type for which Bevacizumab is approved. Since hypoxic cancer cells are the major source of VEGF, the effect of Bevacizumab, which is specific to human VEGF, was selected. Although comparison of our data with EST libraries may be limited by the exclusion of any genes that are enriched only in supporting cells, our result suggests that the genes that were found to be highly expressed in breast IDC associated vessels may also play an important part in VEGF-mediated angiogenesis.
To inhibit angiogenesis it may be important to target endothelial cells specifically. By comparing the list of 63 genes that are upregulated significantly in IDC associated blood vessels with genes found to be enriched in endothelial cell ESTs, six were significantly expressed in endothelial cells compared with non-endothelial cells. Indeed we have shown that out of the endothelial enriched genes, Smurf2, Hex-B, Atf1, and Nras, plus Rrm2, which has known roles in tumour biology, that depletion of Rrm2, Atf1 and Hex-B have anti-angiogenic consequences in ex vivo mouse aortic ring assays. These data validated our approach in the discovery of novel anti-angiogenic targets.
The RRM2 gene encodes a ribonucleotide reductase small subunit of ribonucleotide reductase enzyme (RNR) [58] and plays an essential role in DNA synthesis, repair and cellular proliferation [59]. A role for RRM2 in blood vessels has not been documented, but it can enhance angiogenesis by upregulating VEGF in oropharyngeal carcinoma cells [46]. The downregulation of RRM2 by Bevacizumab, suggests that it is VEGF-regulated. Together our data, with previous studies, suggest that inhibiting RRM2 may have anti-angiogenic and anti-tumour effects.
HEX-B (hexosaminidase subunit beta) is involved in catalysing the degradation of the ganglioside GM2 [60]. The role for HEX-B in angiogenesis has not been explored previously, but ganglioside can modulate cell signalling. Gangliosides shed by tumour cells can also enhance VEGF-induced angiogenesis [61]–[64]. In addition, recent studies have indicated that interferon tau (IFNT) treatment of cycling ewes increases the endometrial expression of HEXB and that this was associated with increased Hif-1α levels [65]. Bevacizumab treatment is also known to increase hypoxia in the tumour environment and Hif-1α expression [66]. Thus it is temping to speculate that this regulates the increased HEXB in our Bevacizumab experiments. How HEX-B in endothelial cells regulates angiogenesis will need further investigation.
ATF1 regulates downstream target genes involved in growth and survival [67]–[69]. In endothelial cells ATF1, when phosphorylated, has been shown to upregulate COX2 [70]. Since VEGF also upregulates COX2, and this correlates with increased tube formation [71], we speculate that high expression of ATF1 in IDC blood vessels may enhance endothelial cell responses to VEGF. Indeed our data corroborate this, since depletion of ATF1 can reduce VEGF-mediated angiogenesis.
In summary, we have successfully combined CD31 immunostaining and LCM to analyse gene expression in breast cancer associated blood vessels. Although beyond the scope of this study, future work will establish the biomarker value of the 63 genes that are upregulated in blood vessels associated with human breast cancer. Moreover, since siRNA depletion of Hex-B, Atf1 and Rrm2 inhibit VEGF-stimulated angiogenesis, our approach has demonstrated novel anti-angiogenic targets. Future work will be required to investigate their in vivo roles.
Supporting Information
CD31-positive blood vessels are negative for the myeloid marker CD68 in human breast cancer. For laser capture microscopy we identified blood vessels by their expression of CD31 (red) and their morphology i.e., structures with a clear lumen and or branched morphology. However, CD31 has also been shown to be expressed in some myeloid cells. Here we demonstrate that CD31 structures, with a clear lumen and or branched morphology are CD68 (green) negative, a biomarker for myeloid cells. Our results suggest that CD31-LCM captured blood vessels from breast samples were myeloid negative.
(TIF)
RNA profile of the six LCM captured samples used for gene expression array. (A) RNA gel-like profile and (B) histograms of RNA samples analysed with an Agilent bioanalyser. The 28S and 18s distinctive ribosomal RNA bands were observed in all 6 samples, and RIN ranged from 6–9.1.
(TIF)
Transcripts in the upregulated IDC vessel signature that respond to anti-VEGF treatment. Comparison of upregulated laser capture blood vessel human IDC genes with those differentially expressed in the mouse tumour stroma following Bevacizumab treatment. U87 xenograft bearing mice were treated, or not, with Bevacizumab and stromal gene profiles were compared with the human IDC blood vessel gene signature. C1–C5, controls; BEV1-BEV4, Bevacizumab-treated tumour stromal samples. Out of the 51 genes that were upregulated in human IDC blood vessels, 41 genes were down regulated following Bevacizumab treatment indicating their possible involvement in VEGF-stimulated angiogenesis. Colour scale indicated genes that were upregulated (red) or down-regulated (blue) in the endothelial cell signature. The heat-map is standardised per gene.
(TIF)
Gene expression following siRNA treatment. (A) Primary endothelial cells and (B) aortic rings were transfected with indicated siRNA and mRNA expression was measured by real-time PCR. Scrambled (SCM) siRNA was used as a negative control. Gene expression is given as a ratio to Actin mRNA expression, as an internal control, and the data in the graph is presented as fold-change relative to control sample. p<0.05, n = 3.
(TIF)
Methods and Materials used for supplementary data.
(DOC)
List of genes and their primer sequences used for validating differentially expressed genes in primary mouse endothelial cells with qPCR.
(DOCX)
Acknowledgments
I would like to thank everyone at the Paterson Institute Microarray Service who amplified my precious LCM blood vessels mRNA and carried out the array work. I would also like to thank Marwa Dawoud and Stephen Robinson for ideas, support and guidance in this project.
Funding Statement
This work was supported by Breast Cancer campaign Ref.2008MayPR07 and CR-UK Ref.C8218_A12007. The funders had no role in study design, data collection and analysis, decision to publish, or preparation of the manuscript.
References
- 1. Kerbel R, Folkman J (2002) Clinical translation of angiogenesis inhibitors. Nat Rev Cancer 2: 727–739. [DOI] [PubMed] [Google Scholar]
- 2. Ellis LM, Hicklin DJ (2008) VEGF-targeted therapy: mechanisms of anti-tumour activity. Nat Rev Cancer 8: 579–591. [DOI] [PubMed] [Google Scholar]
- 3. Ferrara N, Hillan KJ, Gerber HP, Novotny W (2004) Discovery and development of bevacizumab, an anti-VEGF antibody for treating cancer. Nat Rev Drug Discov 3: 391–400. [DOI] [PubMed] [Google Scholar]
- 4. Olsson AK, Dimberg A, Kreuger J, Claesson-Welsh L (2006) VEGF receptor signalling – in control of vascular function. Nat Rev Mol Cell Biol 7: 359–371. [DOI] [PubMed] [Google Scholar]
- 5. Buckanovich RJ, Sasaroli D, O'Brien-Jenkins A, Botbyl J, Hammond R, et al. (2007) Tumor vascular proteins as biomarkers in ovarian cancer. J Clin Oncol 25: 852–861. [DOI] [PubMed] [Google Scholar]
- 6. Madden SL, Cook BP, Nacht M, Weber WD, Callahan MR, et al. (2004) Vascular gene expression in nonneoplastic and malignant brain. Am J Pathol 165: 601–608. [DOI] [PMC free article] [PubMed] [Google Scholar]
- 7. Parker BS, Argani P, Cook BP, Liangfeng H, Chartrand SD, et al. (2004) Alterations in vascular gene expression in invasive breast carcinoma. Cancer Res 64: 7857–7866. [DOI] [PubMed] [Google Scholar]
- 8. St Croix B, Rago C, Velculescu V, Traverso G, Romans KE, et al. (2000) Genes expressed in human tumor endothelium. Science 289: 1197–1202. [DOI] [PubMed] [Google Scholar]
- 9. Bhati R, Patterson C, Livasy CA, Fan C, Ketelsen D, et al. (2008) Molecular characterization of human breast tumor vascular cells. Am J Pathol 172: 1381–1390. [DOI] [PMC free article] [PubMed] [Google Scholar]
- 10. Bergers G, Hanahan D (2008) Modes of resistance to anti-angiogenic therapy. Nat Rev Cancer 8: 592–603. [DOI] [PMC free article] [PubMed] [Google Scholar]
- 11. Rajotte D, Arap W, Hagedorn M, Koivunen E, Pasqualini R, et al. (1998) Molecular heterogeneity of the vascular endothelium revealed by in vivo phage display. The Journal of clinical investigation 102: 430–437. [DOI] [PMC free article] [PubMed] [Google Scholar]
- 12. Pasqualini R, Koivunen E, Ruoslahti E (1997) Alpha v integrins as receptors for tumor targeting by circulating ligands. Nature biotechnology 15: 542–546. [DOI] [PubMed] [Google Scholar]
- 13. Arap W, Pasqualini R, Ruoslahti E (1998) Cancer treatment by targeted drug delivery to tumor vasculature in a mouse model. Science 279: 377–380. [DOI] [PubMed] [Google Scholar]
- 14. Ellerby HM, Arap W, Ellerby LM, Kain R, Andrusiak R, et al. (1999) Anti-cancer activity of targeted pro-apoptotic peptides. Nature medicine 5: 1032–1038. [DOI] [PubMed] [Google Scholar]
- 15. Bertucci F, Borie N, Ginestier C, Groulet A, Charafe-Jauffret E, et al. (2004) Identification and validation of an ERBB2 gene expression signature in breast cancers. Oncogene 23: 2564–2575. [DOI] [PubMed] [Google Scholar]
- 16. Bertucci F, Finetti P, Rougemont J, Charafe-Jauffret E, Nasser V, et al. (2004) Gene expression profiling for molecular characterization of inflammatory breast cancer and prediction of response to chemotherapy. Cancer Res 64: 8558–8565. [DOI] [PubMed] [Google Scholar]
- 17. Bertucci F, Salas S, Eysteries S, Nasser V, Finetti P, et al. (2004) Gene expression profiling of colon cancer by DNA microarrays and correlation with histoclinical parameters. Oncogene 23: 1377–1391. [DOI] [PubMed] [Google Scholar]
- 18. Bertucci F, Finetti P, Rougemont J, Charafe-Jauffret E, Cervera N, et al. (2005) Gene expression profiling identifies molecular subtypes of inflammatory breast cancer. Cancer Res 65: 2170–2178. [DOI] [PubMed] [Google Scholar]
- 19. Bertucci F, Finetti P, Cervera N, Charafe-Jauffret E, Mamessier E, et al. (2006) Gene expression profiling shows medullary breast cancer is a subgroup of basal breast cancers. Cancer Res 66: 4636–4644. [DOI] [PubMed] [Google Scholar]
- 20. Bertucci F, Finetti P, Cervera N, Maraninchi D, Viens P, et al. (2006) Gene expression profiling and clinical outcome in breast cancer. OMICS 10: 429–443. [DOI] [PubMed] [Google Scholar]
- 21. Guo W, Jiang YG (2009) Current gene expression studies in esophageal carcinoma. Curr Genomics 10: 534–539. [DOI] [PMC free article] [PubMed] [Google Scholar]
- 22. Ganguly A, Shields CL (2010) Differential gene expression profile of retinoblastoma compared to normal retina. Molecular vision 16: 1292–1303. [PMC free article] [PubMed] [Google Scholar]
- 23. Miecznikowski JC, Wang D, Liu S, Sucheston L, Gold D (2010) Comparative survival analysis of breast cancer microarray studies identifies important prognostic genetic pathways. BMC Cancer 10: 573. [DOI] [PMC free article] [PubMed] [Google Scholar]
- 24. Kikuchi T, Daigo Y, Katagiri T, Tsunoda T, Okada K, et al. (2003) Expression profiles of non-small cell lung cancers on cDNA microarrays: identification of genes for prediction of lymph-node metastasis and sensitivity to anti-cancer drugs. Oncogene 22: 2192–2205. [DOI] [PubMed] [Google Scholar]
- 25. Wu M, Han L, Shi Y, Xu G, Wei J, et al. (2010) Development and characterization of a novel method for the analysis of gene expression patterns in lymphatic endothelial cells derived from primary breast tissues. Journal of cancer research and clinical oncology 136: 863–872. [DOI] [PubMed] [Google Scholar]
- 26. Wu MS, Lin YS, Chang YT, Shun CT, Lin MT, et al. (2005) Gene expression profiling of gastric cancer by microarray combined with laser capture microdissection. World J Gastroenterol 11: 7405–7412. [DOI] [PMC free article] [PubMed] [Google Scholar]
- 27. Buckanovich RJ, Sasaroli D, O'Brien-Jenkins A, Botbyl J, Conejo-Garcia JR, et al. (2006) Use of immuno-LCM to identify the in situ expression profile of cellular constituents of the tumor microenvironment. Cancer Biol Ther 5: 635–642. [DOI] [PubMed] [Google Scholar]
- 28. Sugiyama Y, Sugiyama K, Hirai Y, Akiyama F, Hasumi K (2002) Microdissection is essential for gene expression profiling of clinically resected cancer tissues. Am J Clin Pathol 117: 109–116. [DOI] [PubMed] [Google Scholar]
- 29. Pagedar NA, Wang W, Chen DH, Davis RR, Lopez I, et al. (2006) Gene expression analysis of distinct populations of cells isolated from mouse and human inner ear FFPE tissue using laser capture microdissection–a technical report based on preliminary findings. Brain Res 1091: 289–299. [DOI] [PubMed] [Google Scholar]
- 30. Horak ER, Leek R, Klenk N, LeJeune S, Smith K, et al. (1992) Angiogenesis, assessed by platelet/endothelial cell adhesion molecule antibodies, as indicator of node metastases and survival in breast cancer. Lancet 340: 1120–1124. [DOI] [PubMed] [Google Scholar]
- 31. Choi WW, Lewis MM, Lawson D, Yin-Goen Q, Birdsong GG, et al. (2005) Angiogenic and lymphangiogenic microvessel density in breast carcinoma: correlation with clinicopathologic parameters and VEGF-family gene expression. Mod Pathol 18: 143–152. [DOI] [PubMed] [Google Scholar]
- 32. Schroeder A, Mueller O, Stocker S, Salowsky R, Leiber M, et al. (2006) The RIN: an RNA integrity number for assigning integrity values to RNA measurements. BMC molecular biology 7: 3. [DOI] [PMC free article] [PubMed] [Google Scholar]
- 33. Gentleman RC, Carey VJ, Bates DM, Bolstad B, Dettling M, et al. (2004) Bioconductor: open software development for computational biology and bioinformatics. Genome Biol 5: R80. [DOI] [PMC free article] [PubMed] [Google Scholar]
- 34.Team RDC (2010) R: A Language and Environment for Statistical Computing. R Foundation for Statistical Computing, Vienna, Austria ISBN 3-900051-07-0.
- 35.Smyth GK (2005) Limma: linear models for microarray data. Bioinformatics and Computational Biology Solutions using R and Bioconductor: 397–420.
- 36. Hochberg Y, Benjamini Y (1990) More powerful procedures for multiple significance testing. Stat Med 9: 811–818. [DOI] [PubMed] [Google Scholar]
- 37. Herbert JM, Stekel D, Sanderson S, Heath VL, Bicknell R (2008) A novel method of differential gene expression analysis using multiple cDNA libraries applied to the identification of tumour endothelial genes. BMC Genomics 9: 153. [DOI] [PMC free article] [PubMed] [Google Scholar]
- 38. Storey JD, Tibshirani R (2003) Statistical significance for genomewide studies. Proc Natl Acad Sci U S A 100: 9440–9445. [DOI] [PMC free article] [PubMed] [Google Scholar]
- 39. Nicosia RF, Ottinetti A (1990) Modulation of microvascular growth and morphogenesis by reconstituted basement membrane gel in three-dimensional cultures of rat aorta: a comparative study of angiogenesis in matrigel, collagen, fibrin, and plasma clot. In Vitro Cell Dev Biol 26: 119–128. [DOI] [PubMed] [Google Scholar]
- 40. Reynolds LE, Watson AR, Baker M, Jones TA, D'Amico G, et al. (2010) Tumour angiogenesis is reduced in the Tc1 mouse model of Down's syndrome. Nature 465: 813–817. [DOI] [PMC free article] [PubMed] [Google Scholar]
- 41. Reynolds AR, Hart IR, Watson AR, Welti JC, Silva RG, et al. (2009) Stimulation of tumor growth and angiogenesis by low concentrations of RGD-mimetic integrin inhibitors. Nat Med 15: 392–400. [DOI] [PubMed] [Google Scholar]
- 42. Zabouo G, Imbert AM, Jacquemier J, Finetti P, Moreau T, et al. (2009) CD146 expression is associated with a poor prognosis in human breast tumors and with enhanced motility in breast cancer cell lines. Breast cancer research: BCR 11: R1. [DOI] [PMC free article] [PubMed] [Google Scholar]
- 43. Li W, Yang D, Wang S, Guo X, Lang R, et al. (2011) Increased expression of CD146 and microvessel density (MVD) in invasive micropapillary carcinoma of the breast: Comparative study with invasive ductal carcinoma-not otherwise specified. Pathology, research and practice 207: 739–746. [DOI] [PubMed] [Google Scholar]
- 44. Perlmutter MA, Best CJ, Gillespie JW, Gathright Y, Gonzalez S, et al. (2004) Comparison of snap freezing versus ethanol fixation for gene expression profiling of tissue specimens. J Mol Diagn 6: 371–377. [DOI] [PMC free article] [PubMed] [Google Scholar]
- 45. Weng J, Wang J, Hu X, Wang F, Ittmann M, et al. (2006) PSGR2, a novel G-protein coupled receptor, is overexpressed in human prostate cancer. Int J Cancer 118: 1471–1480. [DOI] [PubMed] [Google Scholar]
- 46. Zhang K, Hu S, Wu J, Chen L, Lu J, et al. (2009) Overexpression of RRM2 decreases thrombspondin-1 and increases VEGF production in human cancer cells in vitro and in vivo: implication of RRM2 in angiogenesis. Mol Cancer 8: 11. [DOI] [PMC free article] [PubMed] [Google Scholar]
- 47. Osterlund P, Soveri LM, Isoniemi H, Poussa T, Alanko T, et al. (2011) Hypertension and overall survival in metastatic colorectal cancer patients treated with bevacizumab-containing chemotherapy. British journal of cancer 104: 599–604. [DOI] [PMC free article] [PubMed] [Google Scholar]
- 48. Bono P, Elfving H, Utriainen T, Osterlund P, Saarto T, et al. (2009) Hypertension and clinical benefit of bevacizumab in the treatment of advanced renal cell carcinoma. Annals of oncology: official journal of the European Society for Medical Oncology/ESMO 20: 393–394. [DOI] [PubMed] [Google Scholar]
- 49. Robert NJ, Saleh MN, Paul D, Generali D, Gressot L, et al. (2011) Sunitinib plus paclitaxel versus bevacizumab plus paclitaxel for first-line treatment of patients with advanced breast cancer: a phase III, randomized, open-label trial. Clinical breast cancer 11: 82–92. [DOI] [PMC free article] [PubMed] [Google Scholar]
- 50. Hurwitz H, Fehrenbacher L, Novotny W, Cartwright T, Hainsworth J, et al. (2004) Bevacizumab plus irinotecan, fluorouracil, and leucovorin for metastatic colorectal cancer. N Engl J Med 350: 2335–2342. [DOI] [PubMed] [Google Scholar]
- 51. Pusztaszeri MP, Seelentag W, Bosman FT (2006) Immunohistochemical expression of endothelial markers CD31, CD34, von Willebrand factor, and Fli-1 in normal human tissues. J Histochem Cytochem 54: 385–395. [DOI] [PubMed] [Google Scholar]
- 52. Giatromanolaki A, Koukourakis M, O'Byrne K, Fox S, Whitehouse R, et al. (1996) Prognostic value of angiogenesis in operable non-small cell lung cancer. J Pathol 179: 80–88. [DOI] [PubMed] [Google Scholar]
- 53. Takebayashi Y, Aklyama S, Yamada K, Akiba S, Aikou T (1996) Angiogenesis as an unfavorable prognostic factor in human colorectal carcinoma. Cancer 78: 226–231. [DOI] [PubMed] [Google Scholar]
- 54. DeYoung BR, Swanson PE, Argenyi ZB, Ritter JH, Fitzgibbon JF, et al. (1995) CD31 immunoreactivity in mesenchymal neoplasms of the skin and subcutis: report of 145 cases and review of putative immunohistologic markers of endothelial differentiation. J Cutan Pathol 22: 215–222. [DOI] [PubMed] [Google Scholar]
- 55. Singh R, Maganti RJ, Jabba SV, Wang M, Deng G, et al. (2005) Microarray-based comparison of three amplification methods for nanogram amounts of total RNA. American journal of physiology Cell physiology 288: C1179–1189. [DOI] [PMC free article] [PubMed] [Google Scholar]
- 56. Fakhrejahani E, Toi M (2012) Tumor angiogenesis: pericytes and maturation are not to be ignored. Journal of oncology 2012: 261750. [DOI] [PMC free article] [PubMed] [Google Scholar]
- 57. Bergers G, Song S, Meyer-Morse N, Bergsland E, Hanahan D (2003) Benefits of targeting both pericytes and endothelial cells in the tumor vasculature with kinase inhibitors. J Clin Invest 111: 1287–1295. [DOI] [PMC free article] [PubMed] [Google Scholar]
- 58. Nordlund P, Reichard P (2006) Ribonucleotide reductases. Annu Rev Biochem 75: 681–706. [DOI] [PubMed] [Google Scholar]
- 59. Engstrom Y, Eriksson S, Jildevik I, Skog S, Thelander L, et al. (1985) Cell cycle-dependent expression of mammalian ribonucleotide reductase. Differential regulation of the two subunits. J Biol Chem 260: 9114–9116. [PubMed] [Google Scholar]
- 60. Bladon MT (1981) The expression of hex A and hex B isozymes of hexosaminidase in parental and experimental human fibroblast cells and their components. Biochem Genet 19: 971–986. [DOI] [PubMed] [Google Scholar]
- 61. Slevin M, Kumar S, He X, Gaffney J (1999) Physiological concentrations of gangliosides GM1, GM2 and GM3 differentially modify basic-fibroblast-growth-factor-induced mitogenesis and the associated signalling pathway in endothelial cells. Int J Cancer 82: 412–423. [DOI] [PubMed] [Google Scholar]
- 62. Lang Z, Guerrera M, Li R, Ladisch S (2001) Ganglioside GD1a enhances VEGF-induced endothelial cell proliferation and migration. Biochem Biophys Res Commun 282: 1031–1037. [DOI] [PubMed] [Google Scholar]
- 63. Liu Y, McCarthy J, Ladisch S (2006) Membrane ganglioside enrichment lowers the threshold for vascular endothelial cell angiogenic signaling. Cancer Res 66: 10408–10414. [DOI] [PubMed] [Google Scholar]
- 64.Mukherjee P, Faber AC, Shelton LM, Baek RC, Chiles TC, et al.. (2008) Ganglioside GM3 suppresses the pro-angiogenic effects of vascular endothelial growth factor and ganglioside GD1A. J Lipid Res. [DOI] [PMC free article] [PubMed]
- 65.Dorniak P, Bazer FW, Wu G, Spencer TE (2012) Conceptus-Derived Prostaglandins Regulate Endometrial Function in Sheep. Biology of reproduction. [DOI] [PubMed]
- 66. Rapisarda A, Hollingshead M, Uranchimeg B, Bonomi CA, Borgel SD, et al. (2009) Increased antitumor activity of bevacizumab in combination with hypoxia inducible factor-1 inhibition. Molecular cancer therapeutics 8: 1867–1877. [DOI] [PMC free article] [PubMed] [Google Scholar]
- 67. Ghosh SK, Gadiparthi L, Zeng ZZ, Bhanoori M, Tellez C, et al. (2002) ATF-1 mediates protease-activated receptor-1 but not receptor tyrosine kinase-induced DNA synthesis in vascular smooth muscle cells. J Biol Chem 277: 21325–21331. [DOI] [PubMed] [Google Scholar]
- 68. Laag E, Majidi M, Cekanova M, Masi T, Takahashi T, et al. (2006) NNK activates ERK1/2 and CREB/ATF-1 via beta-1-AR and EGFR signaling in human lung adenocarcinoma and small airway epithelial cells. Int J Cancer 119: 1547–1552. [DOI] [PubMed] [Google Scholar]
- 69. Jean D, Tellez C, Huang S, Davis DW, Bruns CJ, et al. (2000) Inhibition of tumor growth and metastasis of human melanoma by intracellular anti-ATF-1 single chain Fv fragment. Oncogene 19: 2721–2730. [DOI] [PubMed] [Google Scholar]
- 70. Rikitake Y, Hirata K, Kawashima S, Takeuchi S, Shimokawa Y, et al. (2001) Signaling mechanism underlying COX-2 induction by lysophosphatidylcholine. Biochem Biophys Res Commun 281: 1291–1297. [DOI] [PubMed] [Google Scholar]
- 71. Wu G, Luo J, Rana JS, Laham R, Sellke FW, et al. (2006) Involvement of COX-2 in VEGF-induced angiogenesis via P38 and JNK pathways in vascular endothelial cells. Cardiovasc Res 69: 512–519. [DOI] [PubMed] [Google Scholar]
Associated Data
This section collects any data citations, data availability statements, or supplementary materials included in this article.
Supplementary Materials
CD31-positive blood vessels are negative for the myeloid marker CD68 in human breast cancer. For laser capture microscopy we identified blood vessels by their expression of CD31 (red) and their morphology i.e., structures with a clear lumen and or branched morphology. However, CD31 has also been shown to be expressed in some myeloid cells. Here we demonstrate that CD31 structures, with a clear lumen and or branched morphology are CD68 (green) negative, a biomarker for myeloid cells. Our results suggest that CD31-LCM captured blood vessels from breast samples were myeloid negative.
(TIF)
RNA profile of the six LCM captured samples used for gene expression array. (A) RNA gel-like profile and (B) histograms of RNA samples analysed with an Agilent bioanalyser. The 28S and 18s distinctive ribosomal RNA bands were observed in all 6 samples, and RIN ranged from 6–9.1.
(TIF)
Transcripts in the upregulated IDC vessel signature that respond to anti-VEGF treatment. Comparison of upregulated laser capture blood vessel human IDC genes with those differentially expressed in the mouse tumour stroma following Bevacizumab treatment. U87 xenograft bearing mice were treated, or not, with Bevacizumab and stromal gene profiles were compared with the human IDC blood vessel gene signature. C1–C5, controls; BEV1-BEV4, Bevacizumab-treated tumour stromal samples. Out of the 51 genes that were upregulated in human IDC blood vessels, 41 genes were down regulated following Bevacizumab treatment indicating their possible involvement in VEGF-stimulated angiogenesis. Colour scale indicated genes that were upregulated (red) or down-regulated (blue) in the endothelial cell signature. The heat-map is standardised per gene.
(TIF)
Gene expression following siRNA treatment. (A) Primary endothelial cells and (B) aortic rings were transfected with indicated siRNA and mRNA expression was measured by real-time PCR. Scrambled (SCM) siRNA was used as a negative control. Gene expression is given as a ratio to Actin mRNA expression, as an internal control, and the data in the graph is presented as fold-change relative to control sample. p<0.05, n = 3.
(TIF)
Methods and Materials used for supplementary data.
(DOC)
List of genes and their primer sequences used for validating differentially expressed genes in primary mouse endothelial cells with qPCR.
(DOCX)