Abstract
The role of imaging in the management of rectal malignancy has progressively evolved and undergone several paradigm shifts. Unlike a few decades ago when the role of a radiologist was restricted at defining the longitudinal extent of the tumour with barium enema, recent advances in imaging techniques permit highly accurate locoregional and distant staging of the disease as well as prognostication on those who are likely to have a postoperative recurrence. Computed tomography (CT) has always been the mainstay of imaging when evaluating for distant metastasis, with the advent of positron emission tomography/CT improving its specificity. In rectal malignancy, it is the local extent of the disease that often influences the surgical decision making and need for neoadjuvant therapy. Although endoscopic ultrasound has been the traditional technique for determining the depth of tumour invasion, over the last decade magnetic resonance imaging (MRI) has emerged as a very effective tool for accurate T-staging. This review intends to address the status of various imaging modalities and their advantages and limitations in detection, pretreatment staging, and assessment of therapeutic efficacy in rectal cancer, with emphasis on MRI of high spatial resolution.
Keywords: Rectal malignancy, multimodality imaging, MRI, rectum
Introduction
Approximately one quarter of all colorectal cancers are located in the rectum[1]. Early detection, accurate staging and monitoring of therapeutic response hold the key to successful treatment of this malignancy. With advances in the surgical techniques and the advent of neoadjuvant therapies, the input required from imaging sciences has progressively increased and has undergone paradigm shifts. Rectal malignancy is usually diagnosed at digital rectal examination and sigmoidoscopy/colonoscopy with biopsy. The role of imaging is to define the extent of disease so as to provide the surgeon with an accurate preoperative road map of the tumour and its relationship to important anatomical structures, besides information on the systemic spread of the disease.
For several decades, conventional barium enema was used to determine the longitudinal extent of the tumour. However, it has become almost obsolete with the improvement in computed tomography (CT) and colonoscopy techniques. According to the recent updates from the United States Preventive Services Task Force, barium enema has even lost its long-held position as a screening modality for colorectal malignancy. CT is extensively used in the staging of the disease. Despite the better performance of positron emission tomography (PET)/CT as a tool for metastatic work-up, the lower cost and ease of availability makes contrast-enhanced CT still the modality of choice for this purpose. The limited soft-tissue resolution of CT makes it a less preferred modality for the T-staging of rectal tumours. Total mesorectal excision (TME), the current surgical treatment of choice for rectum carcinoma, as well as the decision on the need for neoadjuvant therapy requires accurate T-staging. The same holds true if sphincter-sparing surgery is being planned. Notwithstanding its several innate limitations, traditionally endorectal ultrasound (EUS) has been used as the gold standard for imaging the depth of rectal tumour invasion. However, this status of EUS has been challenged by refinement of high-resolution magnetic resonance imaging (MRI) techniques that have made accurate T-staging possible. MRI also enables the radiologist to identify the prognostic subgroups that may need neoadjuvant therapies according to the risk of local recurrence and treatment failure. This diagnostic and prognostic prowess of MRI has undoubtedly led to a paradigm shift in the preoperative investigation and treatment of rectal cancer.
In this review we cover the gamut of imaging modalities, and their advantages and limitations in detection, pretreatment staging and assessment of therapeutic efficacy in rectal cancer, with an emphasis on MRI of high spatial resolution.
Rectal anatomy
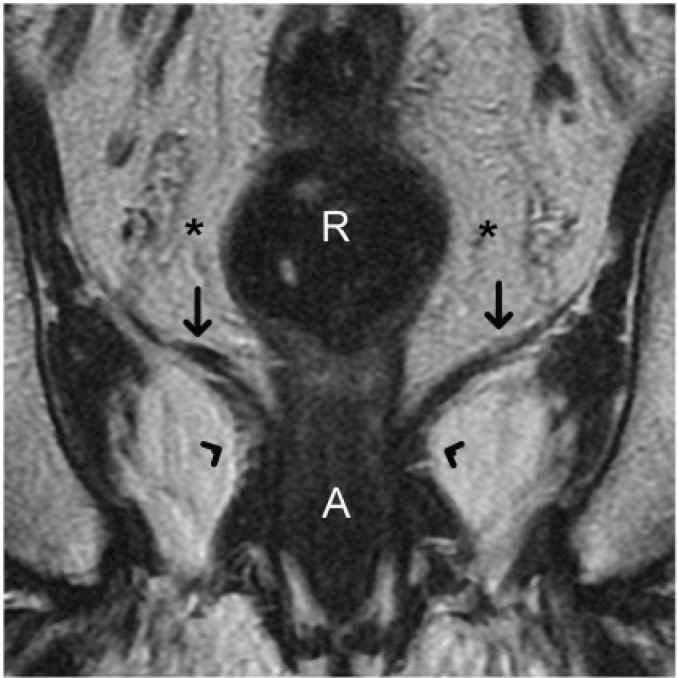
The rectum is the terminal portion of the large intestine which begins at the confluence of the 3 tenia coli of the sigmoid colon and ends at the anal sphincter complex, where the levator ani muscle inserts onto the rectal muscular layer. It is approximately 15 cm in length, broadly divided into three segments: lower third (up to 6 cm from the anal verge), middle third (7–11 cm) and upper third (12–15 cm)[2]. The upper third is covered by peritoneum on its front and sides; the middle third has a peritoneal veil only anteriorly; and the lower third is entirely extra-peritoneal. The proximal limit of the rectum is taken by most surgeons to be at the sacral promontory while anatomists define it at the level of S3. The distal limit reaches the anorectal muscular ring (Fig. 1), although anatomists demarcate the junction histologically at the dentate line.
Figure 1.
Coronal T2-weighted turbo spin-echo MR image shows the caudal extent of a normal rectum. The levator ani muscle (straight arrows) inserts on the rectal muscular layer to form the puborectalis sling (arrowheads). This forms the demarcation between the rectum and anal canal. Accurate depiction of the relationship between a rectal tumour and levator ani as well as puborectalis sling is valuable for planning the surgical resection. R, rectum; A, anal canal. Asterisks indicate mesorectal fat.
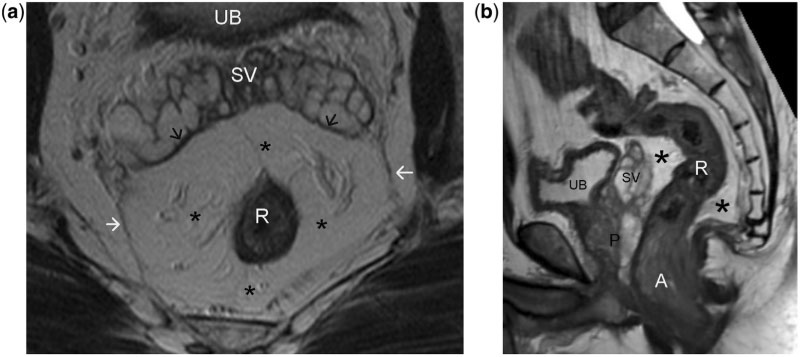
The rectum is surrounded by fatty tissue containing nodes and vessels known as the mesorectum, which extends proximally from the level of the peritoneal reflection and tapers distally to the puborectalis muscle sling (Figs. 2 and 3). It is bounded circumferentially by the mesorectal fascia, which defines the potential circumferential resection margin in patients undergoing TME. The peritoneal reflection is at a variable distance from the anal verge, between 7 and 9 cm. In women, the rectum is related anteriorly to the posterior vaginal wall, cervix and uterus. In men, the prostate, seminal vesicles and bladder are anterior to the rectum. These structures can be invaded locally by rectal tumours.
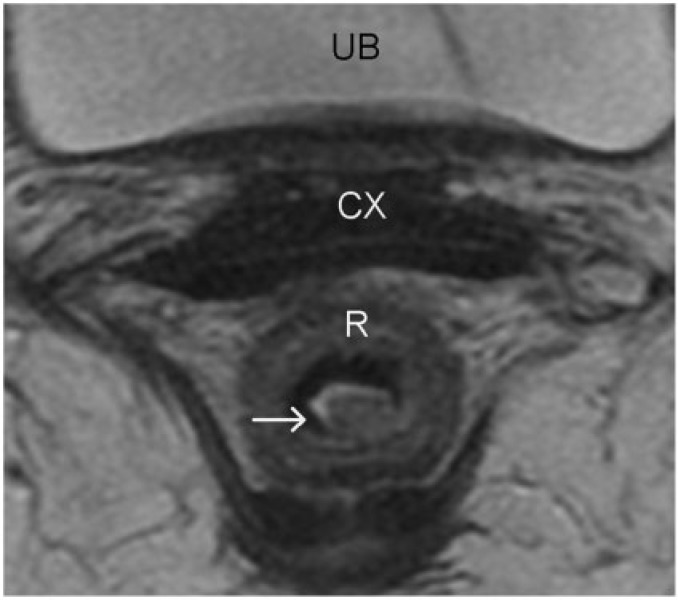
Figure 4.
Rectal carcinoma in situ. High-resolution axial turbo spin-echo T2-weighted MR image shows a polypoid rectal lesion (arrow). The intact muscularis propria at the level of the stalk of the polypoid tumour confidently excludes T2 disease. Involvement of submucosa cannot be excluded and hence was staged as T1 preoperatively. However, at surgical pathology this lesion was staged as carcinoma in situ. The differentiation between carcinoma in situ and a T1 tumour is difficult, especially when the lesions are sessile and when the mucosa and submucosa are not identified separately (a common finding). R, rectum; CX, cervix; UB, urinary bladder.
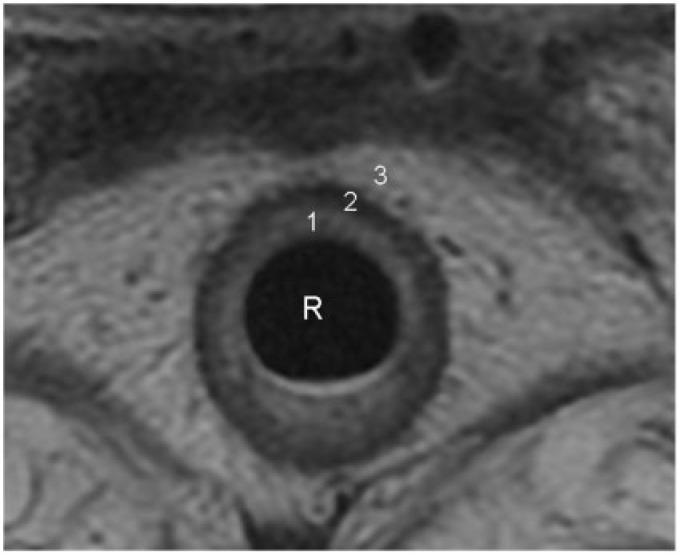
Figure 2.
Concentric layers of normal rectal wall demonstrated on an axial T2-weighted turbo spin-echo MR image. 1, the inner hyperintense layer that represents the mucosa and submucosa; 2, an intermediate hypointense layer that represents the muscularis propria; 3, an outer hyperintense layer that represents the perirectal fat. Further differentiation between mucosa and submucosa is occasionally possible when the submucosa is identified as a markedly hyperintense layer sandwiched between the mucosa and muscularis propria. R, rectal lumen.
Figure 3.
Axial (a) and sagittal (b) T2-weighted turbo spin-echo MR images of normal rectum demonstrating the mesorectum (asterisks) and mesorectal fascia (arrows). Perirectal fatty tissue lymph nodes, vessels, and several fibrous septa together constitute the mesorectum. The mesorectal fascia is a thin, low-signal intensity structure enveloping the mesorectum, better visualised along the posterolateral sectors, while anteriorly it is difficult to differentiate from the Denonvillier fascia (black arrows in a). Note the steep obliteration of the mesorectum in relation to the lower third of the rectum (b). This anatomical characteristic makes MRI interpretation of low rectal tumours more challenging. UB, urinary bladder; SV, seminal vesicles; R, rectum; P, prostate; A, anal canal.
Routes of tumour spread
Rectal cancers may invade regional and distant structures by various pathways including direct extension, lymphatic spread, and hematogenous metastases.
Lymphatogenous spread of rectal tumour from the upper rectum occurs along the lymphatics parallel to the superior rectal and the inferior mesenteric vessels. Tumours from lower rectum can spread along the lymphatics accompanying middle rectal vessels to the internal iliac nodes. The anal canal drains caudally along the inferior rectal vessels to the inguinal nodes. Metastasis into the para-aortic and inguinal nodes are considered non-regional, and involvement of these stations constitutes M1 disease[3].
The sites of hematogenous metastasis from rectal carcinoma are the liver followed by the lungs. Retroperitoneal, ovarian, peritoneal, or adrenal metastasis may rarely occur. Isolated pulmonary metastasis has been observed to be twice as common in cancer of the rectum compared with that of the colon[4], probably because the rectum is also drained by veins emptying into the inferior vena cava (especially the distal third of the rectum) which provides access to the pulmonary circulation bypassing the hepatic sieve. Communication of the portal and vertebral venous circulation via the Batson venous plexus provides an accessory anatomical route for dissemination to less common sites such as the vertebra and brain.
Initial staging
Rectal cancer staging is based on 2 main principles. First, staging is grouped by the TNM classification (Table 1) that enables differentiation between good and poor prognostic tumours to allow tailored therapy, and thereby reduce morbidity from overtreatment, while allowing aggressive treatment of high-risk patients. Second, defining the pertinent anatomy allows for planning of surgery and radiotherapy. The key points in determining local resectability and treatment planning of rectal cancer are summarised in Table 2.
Table 1.
TNM staging of colorectal cancer (based on American Joint Committee on Cancer Cancer Staging Manual, 7th edition)
| Stage | Finding |
|---|---|
| Tumour | |
| Tx | Primary tumour cannot be assessed |
| T0 | No evidence of primary tumour |
| T1 | Tumour invades submucosa |
| T2 | Tumour invades muscularis propria |
| T3 | Tumour invades through muscularis propria into perirectal tissues |
| T4a | Tumour penetrates to surface of visceral peritoneum |
| T4b | Tumour directly invades or is adherent to other organs or structures |
| Regional nodal metastases | |
| Nx | Regional nodes cannot be assessed |
| N0 | No regional node metastases |
| N1 | Metastases in 1–3 regional nodes |
| N2 | Metastases in 4 or more regional nodes |
| Distant metastases | |
| M0 | No distant metastases |
| M1a | Distant metastases confined to one organ/site |
| M1b | Metastases in more than one organ/site or peritoneum |
Table 2.
MRI and ultrasound criteria for T-staginga
| Stage | MRI findings | Ultrasound findings |
|---|---|---|
| T1 | Abnormal signal in the submucosal layer not extending into muscle coat | Breach/irregularity of the submucosa (middle hyperechoic layer) without alteration of the muscularis propria |
| T2 | Abnormal intermediate signal within muscularis propria | Distinct complete breach of the submucosa with invasion into/expansion of the muscularis propria (outer hypoechoic area) |
| T3 | Broad-based bulge or nodular projection or intermediate signal projecting beyond outer muscle coat | Overt infiltration into the perirectal fat |
| T4 | Extension of abnormal signal into adjacent organ or peritoneal reflection | Loss of normal hyperechoic interface between tumour and adjacent organ(s) |
aMR criteria adapted from Brown et al.[54]
Local staging
Before the advent of TME and neoadjuvant chemoradiotherapy, wide tumour-free margins in rectal cancers were more difficult to achieve and hence local recurrence rates were high. Aside from prognostication of tumours via T-staging, detailed local staging in assessing depth of mural invasion by tumour and distance of tumour from the circumferential mesorectal resection plane is crucial in rectal tumours. EUS, CT, and MRI have been used for this purpose.
Two-dimensional EUS is able to delineate 5 layers of the rectal wall, with accuracy of T-staging varying between 63% and 95%[5–7]. The technique is highly accurate for staging of superficial tumours, but less so for advanced rectal cancer because of the limited depth of acoustic penetration. Overstaging of tumours is common, which has been attributed to the steep learning curve, operator dependency, equipment deficiencies, and limitations in resolution and focal length of transducers[8]. It is also less suitable for evaluation of the mesorectal excision plane, as the mesorectal fascia is not identified at EUS. More recently, 3-dimensional ultrasound techniques have shown promise in determining more accurately the relationship of the tumour to the adjacent structures, with initial results showing superior accuracy in T-staging compared with 2-dimensional EUS[9].
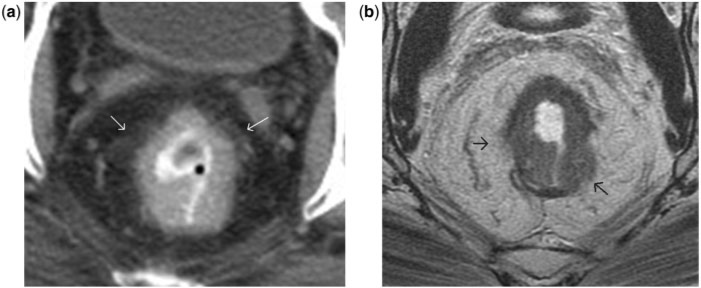
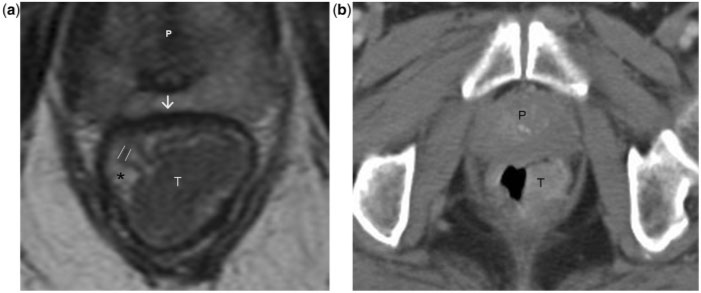
Early studies showed rather disappointing performance of CT, which had between 52% and 74% accuracy in determining local invasion[10,11]. However, multi-detector CT with higher spatial resolution may allow more accurate estimation of depth of mural invasion, and more recent studies have reported T-staging accuracies of up to 83–87%[12,13], particularly when multiplanar reconstructions were used. MDCT was also demonstrated to have high negative predictive value (85%) for involvement of the circumferential resection margin (CRM), but with overall tendency for tumour overstaging (Fig. 9)[14]. In general, CT is more accurate in detecting T3/T4 lesions than T1/T2 lesions[15]. This is because the low contrast and spatial resolution of CT does not allow a detailed evaluation of the different layers of the rectal wall (Figs. 5a and 9a).
Figure 9.
(a) Post-contrast axial CT image shows an annular rectal tumour. The interface between the rectum and mesorectum is irregular with perirectal fat stranding. This is suspicious for mesorectal infiltration, especially at 10- and 2-o’clock positions (arrows). (b) Axial T2-weighted MR image at a level corresponding to that in (a). Compared to CT, the tumour appears less invasive and largely restricted to the rectal wall. Unlike the CT image, MRI shows a sliver of muscularis propria separating the tumour from the mesorectum at the 10- and 2-o’clock positions. However, at the 5- and 9-o’clock positions (arrows), no intervening muscularis propria is seen between the tumour and mesorectal fat, and adjoining perirectal fat shows stranding. Thus MRI findings were more in favour of stage T3 disease. At surgical pathology, these regions had tumour invading the outer muscle layer but not extending beyond it (hence staged as T2 disease), and the fat stranding corresponded to peritumoural desmoplastic reaction. This example illustrates the superiority of MRI over CT in defining the loco-regional tumour extent by virtue of its improved soft-tissue resolution. It also demonstrates the limitation of MRI in differentiating advanced T2 from early T3 disease. Peritumoural desmoplastic reaction is often the cause for overstaging at MRI.
Figure 5.
Stage T1 rectal tumour. (a) Axial T2-weighted MR image shows a large rectal tumour of intermediate signal intensity. The rectal mucosa (parallel lines), submucosa (asterisk) and muscularis propria (arrow) are distinctly visualised in the high-resolution MR image. The tumour involves the mucosa and submucosa while the muscularis propria is preserved, consistent with T1 disease. (b) Post-contrast axial CT image at a level corresponding to that in (a) demonstrates the tumour but gives limited information on the depth of invasion. The limited soft-tissue resolution (compared to MRI) of CT precludes confident T-staging of the rectal tumour. T, tumour; P, prostate.
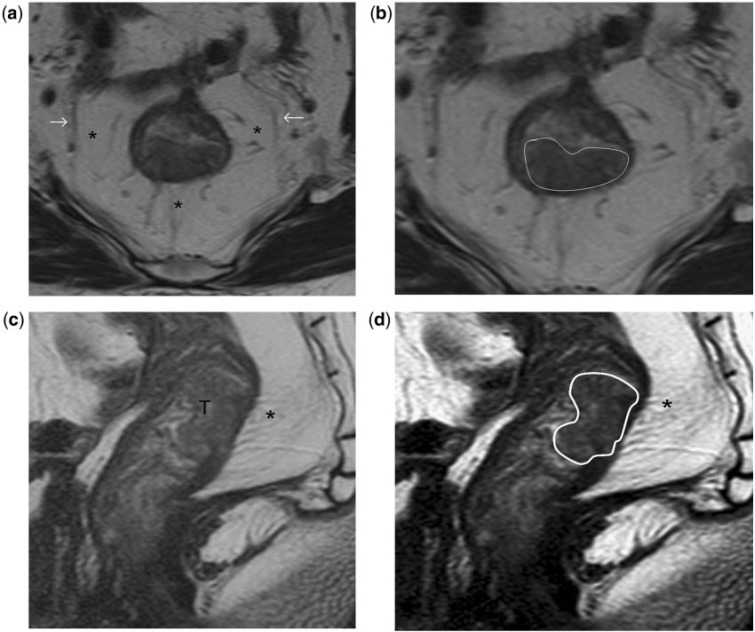
The technique of MRI for local rectal cancer staging has evolved since its first use in 1986. Initial studies were done with a body coil with consequent poor T-staging accuracies, as the layers of the rectal wall could not be differentiated. The development of endorectal coils made detailed imaging of the rectal wall possible, with improvement in T-staging accuracy of 81–85%[16,17]. However, endorectal coil techniques are less comfortable for the patient, have a smaller field of view that limits full evaluation of the mesorectal fascia, and cause technical problems with positioning of the coil in proximal rectal or stenotic segments. Advent of phased-array surface coils allowed for larger imaging fields while maintaining high spatial resolution. Phased-array MRI showed overall accuracies for T-staging between 65% and 86%, with sensitivities for prediction of T3 between 80% and 86% and specificity between 71% and 76%[6]. Most staging failures occur in differentiation between T1 (Fig. 5) and T2 (Fig. 6) lesions and between T2 and borderline T3 lesions. The former arises because the submucosa is generally not visualised on phased-array MRI. Difficulties in distinguishing desmoplastic reaction from tumour stranding result in the majority of T2/T3 staging failures (Fig. 9)[18]. Functional techniques such as diffusion-weighted MRI and perfusion MRI may hold promise with regard to differentiating fibrosis from malignant infiltration in the future, but more research on their added utility is needed.
Figure 6.
Stage T2 rectal tumour. (a, b) High-resolution T2-weighted axial MR images show the rectal tumour invading the muscularis propria posteriorly between the 4- and 8-o’clock positions. A thin, relatively hypointense stripe representing the muscularis propria is interposed between the mesorectal fat and as demonstrated in high- resolution T2-weighted sagittal MR images (c, d). (b) The tumour invades the muscularis propria but spares the mesorectum; hence it is staged as T2 disease. T, tumour. Asterisks indicate mesorectum; arrows indicate mesorectal fascia; tumour outlined in white in (b) and (d).
In a recent study, 3-Tesla (3T) MRI failed to demonstrate statistically significant improvement in staging accuracy[19]. The authors reported that while there was better visibility of the rectal wall at 3T, the inherent problem of distinguishing T2 tumours with desmoplasia and borderline T3 tumours with tumour stranding in the mesorectal fat was still difficult on MRI. This study was limited by small sample size (13 patients), and more research into the benefits of 3T MRI are necessary.
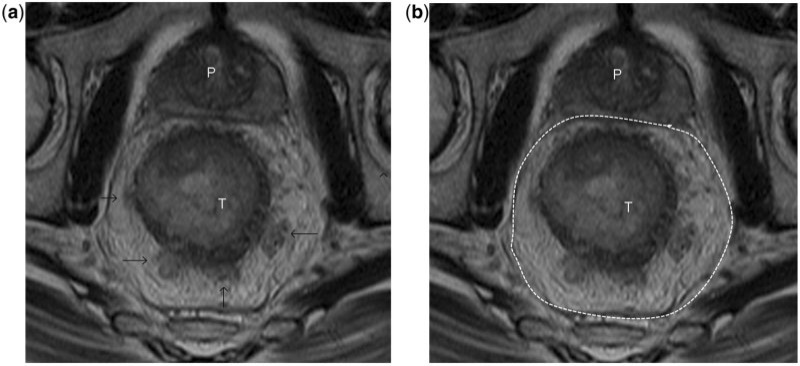
The major advantage over other modalities of MRI in local staging is its clear depiction of the mesorectal fascia (Fig. 3). Distance of the tumour to the mesorectal fascia is the single most important local prognostic factor and when this distance on pre-operative MRI is less, the risk of CRM involvement is increased (Figs. 7 and 8)[20]. CRM positivity carries a great risk of both local and distant recurrence. The critical distance of tumour to the mesorectal fascia is controversial, with some studies choosing 1 mm (e.g. the MERCURY trial[21]) and others 5 mm; the latter sacrifices specificity for sensitivity[18]. In the MERCURY prospective observational study, which used a 1-mm cut-off, the accuracy for prediction of a clear margin was 88% with a negative predictive value of 94%[21]. Administration of rectal enema reduces the distance between the tumour and the mesorectal fascia,[22] but no studies have investigated whether assessment of CRM status is influenced.
Figure 7.
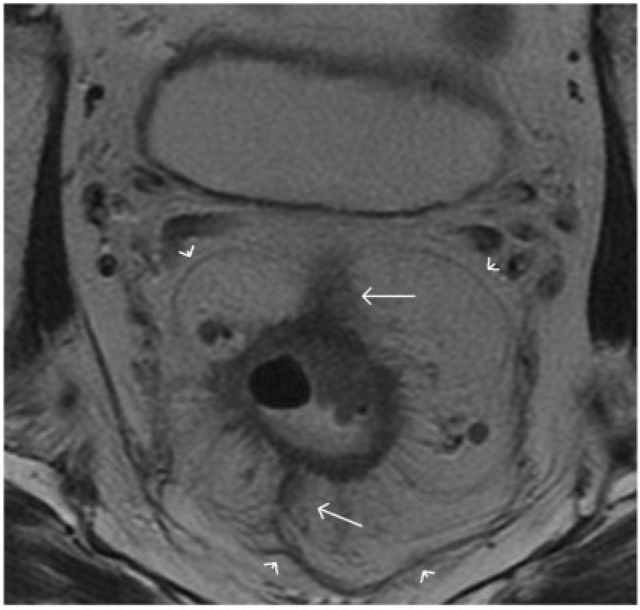
Stage T3 rectal tumour without involvement of mesorectal fascia. (a, b) High-resolution T2-weighted axial MR images show bulky annular rectal cancer that infiltrates into the mesorectum at multiple sites (arrows in a). There is no infiltration of the mesorectal fascia (outlined in white in b).
Figure 8.
Stage T3 tumour with involvement of mesorectal fascia. T2-weighted axial MR image shows circumferential mesorectal extension of the rectal tumour. At 12- and 7-o’clock positions it infiltrates (arrows) the mesorectal fascia (arrowheads).
Distance from the tumour to the anal sphincter complex is another important factor that influences surgical planning (Figs. 10 and 11). High-resolution MR images can exquisitely demonstrate the anal sphincter. Coronal images best depict the relation between the tumour and the anal sphincter complex.
Figure 10.
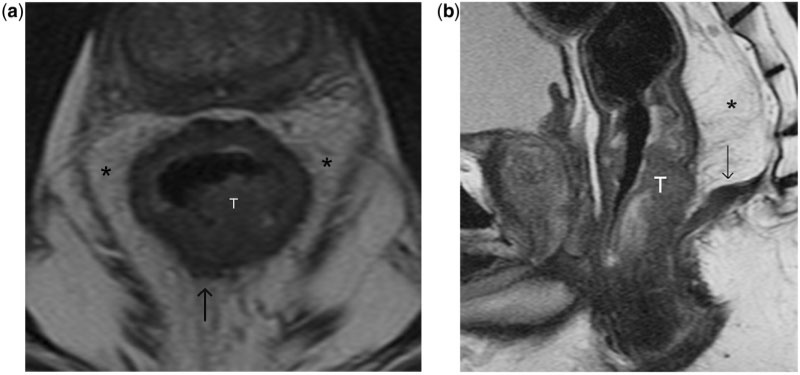
(a, b) High-resolution T2-weighted axial and sagittal MR images showing a polypoid low rectal tumour (T) that invades the mucosa, submucosa and muscularis propria along the posterior hemi-circumference. There are focal areas of tumour bulging (arrow in a) into the mesorectal fat consistent with T3 disease, confirmed at surgical pathology. Note the steep obliteration of the mesorectum (asterisk) in relation to the lower rectum. By virtue of its low rectal location, despite the minimal mesorectal infiltration, the tumour almost abuts the pelvic diaphragm (arrow in b), a finding that influences the surgical planning.
Figure 11.
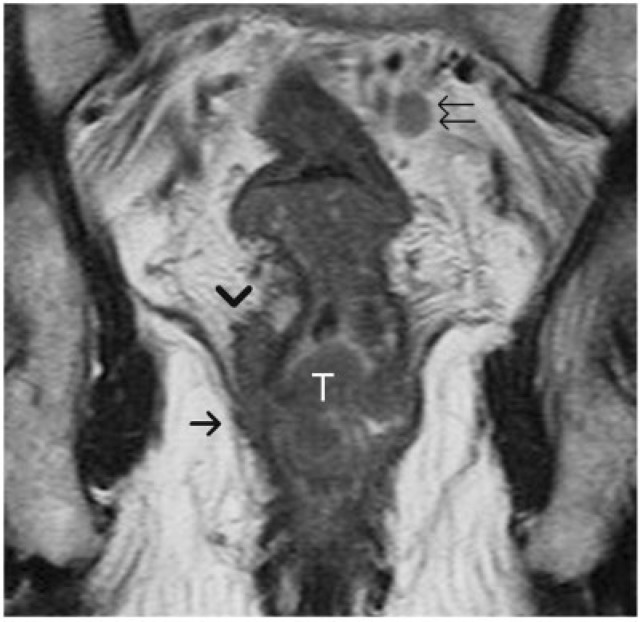
Locally advanced low rectal tumour. An annular tumour (T) is noted invading the mesorectum (arrowhead) and also involving the levator ani (arrow), consistent with T4 disease. The mesorectum around the lower third of rectum is usually narrow, hence if the tumour breaks the barrier of muscularis propria it can rapidly progress to stage T4 disease. Note the metastatic lymph node in the mesorectal fat (double arrows) with signal intensity comparable to that of the primary rectal tumour.
The MR and EUS criteria for assessment of T stage are presented in Table 3.
Table 3.
Key points to be identified at imaging for determining local resectability and treatment planning of rectal cancer
| Local factors | Location of tumour |
|---|---|
| Size and length of tumour | |
| T stage | |
| Key features affecting local recurrence/ surgical planes | Distance to mesorectal fascia |
| Involvement of peritoneum | |
| Involvement of anal sphincter complex | |
| Nodal involvement | Mesorectal nodes |
| Regional (inferior mesenteric artery and internal iliac chains) | |
| Other findings | Extramural venous invasion |
Nodal staging
There exists a strong relationship between the depth of spread through the muscularis propria and the risk of lymph node involvement. Lymph node involvement is an independent adverse prognostic factor, and the outcome of TME specimens is more adverse when 4 or more lymph nodes are involved[23].
Accurate detection of nodal disease with imaging remains challenging across all modalities. Distinction between benign and malignant nodes is mainly based on size and shape. Size criteria are moderately reliable at best. Size of lymph nodes may have no relation to the metastasis, as proven by the frequent histological finding of metastatic foci in sub-centimetre lymph nodes. In the past, only lymph nodes greater than 1 cm in diameter were considered positive and this often caused understaging with major prognostic and therapeutic failures, since as many as 94% of involved nodes can be smaller than 5 mm[24]. There is no consensus on the normal limit of size in the diagnosis of nodal metastases. It is prudent to use a combination of size, shape and internal architecture criteria together for nodal evaluation. However, a node larger than 8 mm in short-axis diameter in the pelvis or larger than 10 mm in the abdomen should generally be considered suspicious for metastases.
The reported EUS staging accuracy for nodal metastasis has been quoted to be from 64% to 84%[5]. Features of lymph nodes suspicious of metastatic disease include those larger than 5 mm (for mesorectal nodes), deeply hypoechoic or round in shape with irregular margins. Unfortunately, all of these may be present even in reactive lymph nodes. Moreover, EUS is not able to depict nodes that are outside the range of the transducer and cannot discriminate between nodes that are inside or outside the mesorectal fascia, since the latter is not identified on ultrasonography.
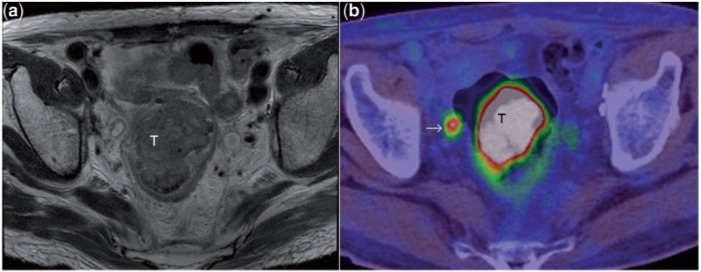
Nodal staging accuracy with CT has been quoted in the range of 54–70%, with sensitivity and specificity at 55% and 74%[6]. The addition of [18F]fluorodeoxyglucose (FDG) positron emission tomography (PET) aids in increasing the specificity of CT (Fig. 14). However, so far the sensitivity of FDG PET/CT has been disappointing for N-staging in rectal cancer, at 29%[25]. This is probably due to the limitation of low-resolution PET machines to detect small-volume disease and the “blooming effect” of the primary hot lesion overshadowing the nearest lymph nodes.
Figure 12.
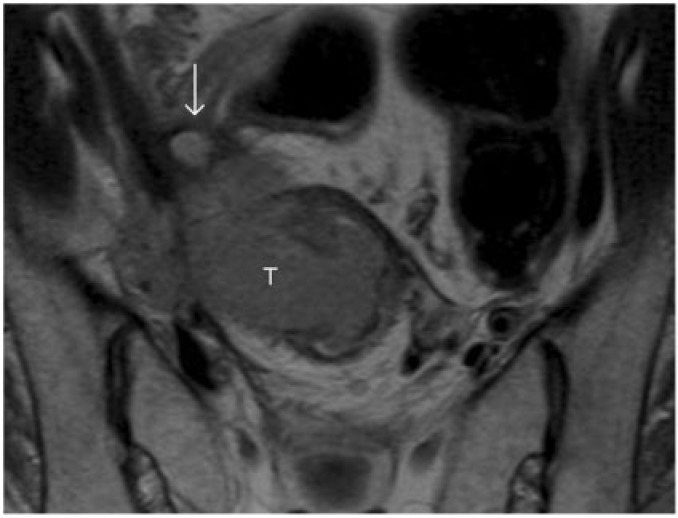
T2-weighted axial MR image shows a locally advanced rectal carcinoma (T) with direct invasion of the right lateral pelvic wall. Note the dilated right ureter (arrow).
Figure 13.
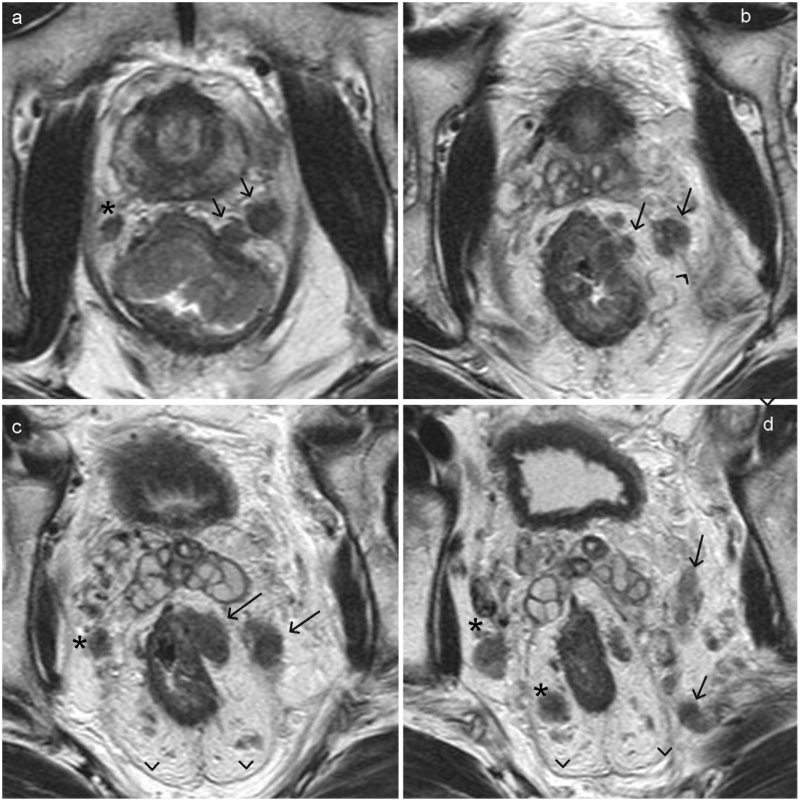
Extramural vascular invasion of rectal carcinoma. (a–d) Axial T2-weighted MR images arranged sequentially in a caudal to cranial direction. On the left side, there is extramural vascular invasion into a lateral rectal vein with further extension of tumour thrombus (arrow) beyond the mesorectal fascia (arrowhead) into the veins along the pelvic side wall. Note the metastatic lymph nodes in the mesorectal fat on the right side (asterisk) and also along the right pelvic wall.
Figure 14.
T2-weighted axial MR image (a) depicts a large rectal mass (T). PET/CT image (b) at a corresponding level shows the intense uptake of fluorodeoxyglucose (FDG) in the tumour. Note also the FDG avid focus (arrow) in the mesorectal fat, consistent with mesorectal lymph node metastasis. In this patient, MRI had shown a few sub-centimetre mesorectal nodes of indeterminate nature. The intense FDG uptake in the node shown confirmed its metastatic nature. Although FDG PET improves the specificity of lymph node characterisation as seen here, the sensitivity is limited[29].
Although modern high-resolution MR images allow visualisation of lymph nodes as small as 2 mm, reliable differentiation of malignant from benign nodes is not possible in very small nodes. Lymph node characterisation is more accurate in larger (>5 mm) nodes that can be evaluated for size, shape, border and signal intensity. In a study of 437 harvested nodes, the sensitivity was 85% and specificity 97%[26] if the criterion for a suspicious node included irregular borders or mixed signal intensity (Fig. 11).
The use of ultra-small superparamagnetic particles of iron oxide (USPIO) has great potential for differentiation of benign from malignant nodes. USPIO MR contrast agent is taken up by macrophages in normal lymph nodes, causing a decrease in signal intensity within the node on T2*-weighted MR images, owing to susceptibility artifacts. Thus an enlarged inflamed node will also show a significant decrease in signal intensity, whereas one which is involved by tumour will cause a region of increased signal intensity within the node where the macrophages are replaced by malignant cells. A recent study showed high sensitivity (93%) and specificity (96%) when nodes were analysed according to their signal patterns, and this method could assess even small nodes <5 mm in diameter[27]. However, USPIO contrast requires administration the day before imaging and has not been approved by the Food and Drug Administration (FDA) or the European Medicines Agency, limiting routine clinical use. Another contrast agent, Gadofosveset, is a blood-pool MR contrast agent that binds to albumin and was originally marketed for vascular MR imaging but is taken up by normal or reactive lymph nodes, allowing differentiation from metastatic nodes that are replaced by tumour and thus unable to take up the contrast. A prospective study has shown that this FDA-approved agent has high reproducibility and accuracy (area under the curve = 0.96), which was significantly improved compared with standard MRI for nodal staging of rectal cancer[28].
Diffusion-weighted imaging (DWI) has also been suggested as a method for assessment of malignancy in lymph nodes, based on the principle of higher cellular density and thus restricted diffusion in malignant tissues. However, there is a great degree of overlap in the diffusivity between malignant and benign nodes, probably due to inherent high cellularity of normal lymph nodes. Overall DWI is likely an excellent method for lymph node detection, but imperfect for discriminating metastatic from non-metastatic nodes[29].
Detection of liver metastases
The liver, being the first end-capillary bed, traps tumour cells and emboli and thus is the most common site of M1 disease, occurring in approximately 24% of newly diagnosed rectal cancers[30]. Aggressive hepatic resection of a limited number of colorectal cancer metastases offers the best opportunity for cure. Detection and accurate determination of the precise number and size of liver metastases is particularly important, as the therapeutic approach may change from surgery to chemotherapy.
Multi-slice contrast-enhanced CT is the most commonly used pre-operative staging investigation for detecting metastases. The portal-venous phase is generally considered adequate, especially in the era of multi-detector CT. The use of biphasic technique[31], which involves scanning in both arterial and portal venous phases, is controversial, although there has been anecdotal evidence that some hepatic metastases missed in the portal phase were visible in the arterial phase. At meta-analysis, per-lesion sensitivity for colorectal hepatic metastases was reported to be 63.8–74.4%, and per-patient sensitivity was 64.7–83.6%[32,33].
Detection of metastases with MRI requires the acquisition of multiple sequences and administration of intravenous contrast. An advantage of MRI is its ability to differentiate clearly benign lesions such as cysts and hemangiomas from metastases, as these entities remain hyperintense on heavily T2-weighted scans whereas metastases demonstrate lower intensity. Sensitivity estimates from a recent meta-analysis of 3391 patients showed per-patient sensitivity of 88.2% and per-lesion sensitivity of 80.3%, with significantly higher sensitivity for sub-centimetre lesions (60.2%) in comparison with CT (47.3%)[33]. This study also showed a statistically significant improvement in sensitivity estimates for MR studies performed after 2004 (84.9%). Interestingly, the meta-analysis failed to detect an improvement in per-lesion sensitivity of MR imaging performed with the use of various contrast media such as mangafodipir trisodium, superparamagnetic iron oxide, and nonspecific gadolinium-containing contrast material when compared with unenhanced MR imaging. This finding may be attributed to a lack of statistical power.
FDG PET/CT is able to quantify metabolic changes in tumour cells. Although some reports have shown FDG PET/CT to detect 30% more distant lesions compared with CT[34], a meta-analysis by Bipat’s group in 2005 indicated comparable per-lesion sensitivity for helical CT and FDG PET[32]. This was corroborated in a recent meta-analysis of prospective studies that found per-lesion sensitivity in the liver to be comparable with that of CT (81.4–74.4%)[33]. However, per-patient analysis revealed that FDG PET was significantly more sensitive than CT (P = 0.025) but not MR imaging (P = 0.653). Specificity estimates for all 3 modalities were comparably high, in excess of 92%. The pre-surgical role of PET/CT still needs further research given the considerations of costs and radiation exposure, but currently PET/CT can be considered for staging distant metastatic spread if radical surgery is an option.
Assessment of therapeutic response
The identification of good responders before definitive surgery is crucial in the era of pre-operative neo-adjuvant therapy. Complete and partial response has been found to be associated with better prognosis in most series, and in up to 25% of patients no residual tumour (pathological complete response) is seen on histological examination[35]. Accurate identification of responders and post-treatment stage may allow the surgical approach to be radically altered, from abdominoperineal resection to a sphincter-preserving operation.
Standardised imaging criteria such as the RECIST (response evaluation criteria in solid tumours) criteria to determine therapeutic response are mainly based on size[36]. However, apart from size reduction it is important to evaluate factors such as nodal status, circumferential resection margin, and peritoneal and sphincter involvement[35].
Endoscopic ultrasound
The accuracy of EUS in restaging rectal cancer locally appears less favourable, with reported accuracy rates ranging from 46% to 75%[5]. EUS studies comparing sonographic appearance and histopathology have shown that EUS cannot reliably differentiate between fibrosis and tumour[37]. In a study of 84 patients with locally advanced rectal cancer, EUS performed 4–6 weeks after chemoradiotherapy showed correct T-staging in only 29% of responders (15 of 51 patients), correct nodal staging in 57%, and poor correlation between the distance of the tumour from the anal verge and tumour location on EUS[38].
Computed tomography
The accuracy of CT in determining T and N staging post-chemoradiotherapy was examined in a recent prospective study of 90 patients with correct T stage in only 37% and nodal stage in 62%, the most frequent inaccuracy being overstaging[39]. However, circumferential resection margin involvement was correctly predicted in 71% of patients. The authors of this study concluded that imaging findings (CT, MRI and EUS) would have no impact on the therapeutic outcome of chemoradiation-treated patients with locally advanced cancer because of poor agreement with histopathological staging.
PET/CT
PET is unable to accurately evaluate anatomical change or predict CRM status[40], but is useful for assessing metabolic response of the tumour, which is reflected by a decrease in the standardised uptake values (SUVs) after CRT. Pre-therapy SUV values do not show good correlation with pathological response[41]. The literature is rich with studies showing that a decrease in SUV correlates with histological response in various tumours including rectal cancer[41–43], but there is still no universal agreement of the exact percentage cut-off between the pre- and post-response SUV values (response index) above which a patient is considered a responder. The optimal timing of the post-response scan is also a compromise between early scanning, which increases the probability of non-specific FDG uptake due to inflammatory reaction, and later scanning, which could unduly delay surgery.
Magnetic resonance imaging
Most early studies comparing post-therapy MRI and histopathology showed relatively poor accuracy, because of inability to differentiate the changes of post-chemoradiation fibrosis from residual tumour (Fig. 15). Fortunately, increased familiarity of the reactive changes that occur after CRT combined with technological advances enabling high-resolution scans through the plane of the tumour has improved MRI accuracy[35] (Fig. 15). Barbaro’s group reported an overall T-staging accuracy of 79% for MRI in 53 rectal cancer patients after CRT[44], with the main source of error being overstaging. Studies have shown a high negative predictive value (100%) of the ability of MRI to predict tumour clearance from the mesorectal fascia, although at the expense of many false positives, leading to a low positive predictive value (PPV) of 50–60%[45,46]. The percentage volume reduction rate of rectal cancer after chemoradiation therapy also has a high PPV (93.5%) for identifying responders when a cut-off of 70% volume reduction is used[44].
Figure 15.
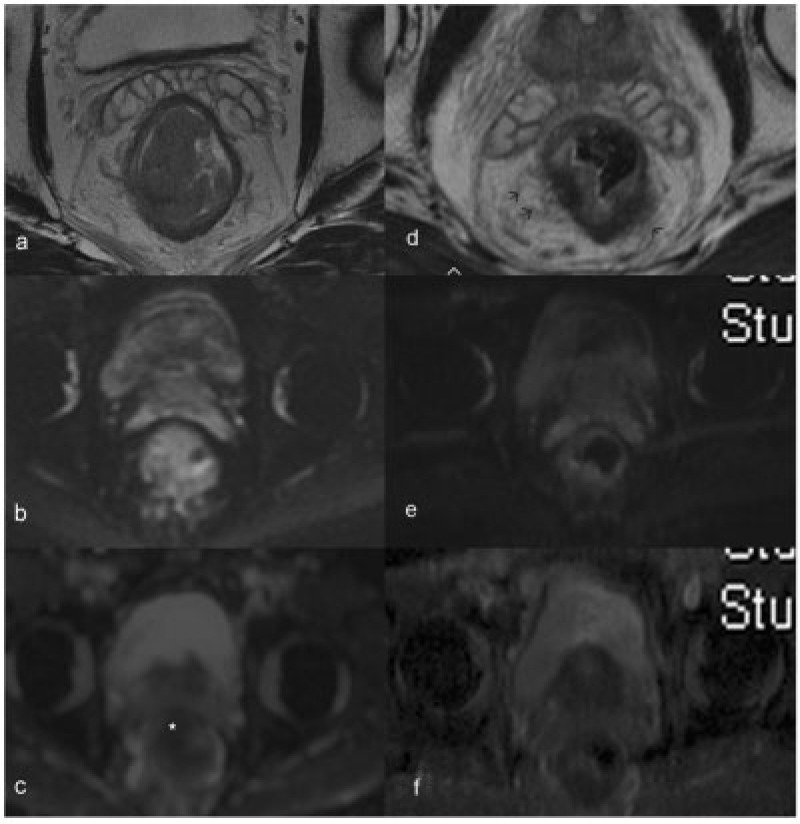
Pre- and post-neoadjuvant therapy images (a–c and d–f, respectively) of a patient with T3 rectal tumour, obtained at corresponding levels shown here. The axial T2-weighted image (a) shows a bulky tumour with mild infiltration into mesorectal fat. The tumour is bright on DWI (b) with restricted diffusion (star) seen on the ADC image (c). After neoadjuvant therapy, the tumour has markedly shrunk with mild residual mucosal thickening, as seen on the high-resolution T2-weighted image (d). The DW and ADC images do not show any residual diffusion-restricted areas. The fat stranding noted in the mesorectal fat (arrows in d) is indeterminate, since both residual tumour infiltration and post-radiation desmoplastic reaction can have a similar appearance. In this patient this appearance was deemed a desmoplastic reaction (later proved at surgical pathology) on the basis of the overall findings of good response.
The accuracy of MRI in secondary staging of lymph node disease after chemoradiation has been reported to be 65–88%, with sensitivities varying from 33% to 82% and specificity of 68–95%[45,47,48] depending on morphological and size criteria. Any proposed cut-off size for nodes is a compromise between sensitivity and specificity. After chemoradiation therapy, a change in the morphological appearance of mesorectal lymph nodes to uniform high T2 signal, indicating mucinous change, can result[47].
Diffusion-weighted imaging
DWI is an increasingly widespread MRI functional technique that exploits the difference in the random motion of water molecules in various tissues to create image contrast. Malignant tissues, owing to their high cellularity and proportion of intact cellular membranes, exhibit restriction of water diffusion, which can be quantified via the apparent diffusion coefficient (ADC) parameter (Fig. 15). In theory, DWI can monitor changes in cellular structure and integrity, which serve as a proxy for monitoring the cell lysis effects of successful chemoradiation therapy in tumour tissue[49].
In rectal cancer DWI has been used for prediction of response to chemoradiation. Pretreatment ADC values in patients with rectal cancer were found to be negatively correlated with response, presumably because higher pretreatment ADC values reflected necrotic tumours that were resistant to therapy[50]. In another study by Koh et al., high pretreatment mean ADC values of colorectal hepatic metastases were predictive of a poor response to chemotherapy[51]. In that study, DWI performed within 3 weeks of completion of chemotherapy showed an increase in mean ADC in metastatic lesions that responded to chemotherapy, which the authors proposed was due to a change from a more cellular pretreatment to a necrotic post-treatment phenotype. Paradoxically, Hein’s group found a significant decrease in mean ADC of rectal tumours that underwent DWI at 2, 3 and 4 weeks after treatment, which was attributed to cytotoxic oedema and fibrosis[52]. Clearly more research is needed to establish the exact temporal effects of successful therapy on ADC, as there is an interplay of necrosis, cytotoxic oedema and fibrosis.
Aside from its potential for prediction of response to chemoradiotherapy and monitoring of treatment response, the addition of DWI images to T2-weighted imaging has been shown to improve the prediction of tumour clearance in the mesorectal fascia after neoadjuvant chemoradiation therapy. In terms of mesorectal fascia tumour clearance or invasion, combined analysis of DW and T2-weighted images showed an impressive 89–93% accuracy, whereas accuracy was only 40–69% with T2-weighted images alone[53]. These encouraging results might be due to the ability of DWI to distinguish cellar tumoural tissue from nontumoural lesions such as radiation-induced fibrosis and inflammation within the mesorectal fascia[54].
Conclusions
Many imaging options are now available for the pre-operative detection and staging of patients with rectal cancer. If CT and PET/CT is the mainstay for metastatic work-up, EUS and MRI form the principal modalities for T-staging of disease. The deciding factor on which imaging modality to use is more often dependent on availability of resources, cost and institutional experience. Accurate restaging of rectal cancer and early monitoring of response after neoadjuvant therapy still remains a challenge to all modalities.
Footnotes
This paper is available online at http://www.cancerimaging.org. In the event of a change in the URL address, please use the DOI provided to locate the paper.
References
- 1.Abeloff M, Armitage J, Niederhuber J. Abeloff's clinical oncology. Sudbury, MA: Jones & Bartlett Learning; 2008. [Google Scholar]
- 2.Salerno G, Sinnatamby C, Branagan G, Daniels IR, Heald RJ, Moran BJ. Defining the rectum: surgically, radiologically and anatomically. Colorectal Dis. 2006;8(Suppl 3):5–9. doi: 10.1111/j.1463-1318.2006.01062.x. . PMid:16813584. [DOI] [PubMed] [Google Scholar]
- 3.McMahon CJ, Rofsky NM, Pedrosa I. Lymphatic metastases from pelvic tumors: anatomic classification, characterization, and staging. Radiology. 2009;254:31–46. doi: 10.1148/radiol.2541090361. . PMid:20032141. [DOI] [PubMed] [Google Scholar]
- 4.Tan KK, Lopes G de L, Sim R. How uncommon are isolated lung metastases in colorectal cancer? A review from database of 754 patients over 4 years. J Gastrointest Surg. 2009;13:642–648. doi: 10.1007/s11605-008-0757-7. . PMid:19082673. [DOI] [PubMed] [Google Scholar]
- 5.Tan KK, Tsang CB. Staging of rectal cancer—technique and interpretation of evaluating rectal adenocarcinoma, uT1–4, N disease: 2D and 3D evaluation. Semin Colon Rectal Surg. 2010;21:197–204. [Google Scholar]
- 6.Bipat S, Glas AS, Slors FJM, Zwinderman AH, Bossuyt PMM, Stoker J. Rectal cancer: local staging and assessment of lymph node involvement with endoluminal US, CT, and MR imaging—a meta-analysis. Radiology. 2004;232:773–783. doi: 10.1148/radiol.2323031368. . PMid:15273331. [DOI] [PubMed] [Google Scholar]
- 7.Mackay SG, Pager CK, Joseph D, Stewart PJ, Solomon MJ. Assessment of the accuracy of transrectal ultrasonography in anorectal neoplasia. Br J Surg. 2003;90:346–350. doi: 10.1002/bjs.4042. . PMid:12594671. [DOI] [PubMed] [Google Scholar]
- 8.Edelman BR, Weiser MR. Endorectal ultrasound: its role in the diagnosis and treatment of rectal cancer. Clin Colon Rectal Surg. 2008;21:167–177. doi: 10.1055/s-2008-1080996. . PMid:20011415. [DOI] [PMC free article] [PubMed] [Google Scholar]
- 9.Kim JC, Kim HC, Yu CS, et al. Efficacy of 3-dimensional endorectal ultrasonography compared with conventional ultrasonography and computed tomography in preoperative rectal cancer staging. Am J Surg. 2006;192:89–97. doi: 10.1016/j.amjsurg.2006.01.054. . PMid:16769283. [DOI] [PubMed] [Google Scholar]
- 10.Shank B, Dershaw DD, Caravelli J, Barth J, Enker W. A prospective study of the accuracy of preoperative computed tomographic staging of patients with biopsy-proven rectal carcinoma. Dis Colon Rectum. 1990;33:285–290. doi: 10.1007/BF02055469. . PMid:2323277. [DOI] [PubMed] [Google Scholar]
- 11.Zerhouni EA, Rutter C, Hamilton SR, et al. CT and MR imaging in the staging of colorectal carcinoma: report of the Radiology Diagnostic Oncology Group II. Radiology. 1996;200:443–451. doi: 10.1148/radiology.200.2.8685340. PMid:8685340. [DOI] [PubMed] [Google Scholar]
- 12.Sinha R, Verma R, Rajesh A, Richards CJ. Diagnostic value of multidetector row CT in rectal cancer staging: comparison of multiplanar and axial images with histopathology. Clin Radiol. 2006;61:924–931. doi: 10.1016/j.crad.2006.03.019. . PMid:17018304. [DOI] [PubMed] [Google Scholar]
- 13.Filippone A, Ambrosini R, Fuschi M, Marinelli T, Genovesi D, Bonomo L. Preoperative T and N staging of colorectal cancer: accuracy of contrast-enhanced multi-detector row CT colonography—initial experience. Radiology. 2004;231:83–90. doi: 10.1148/radiol.2311021152. . PMid:14990815. [DOI] [PubMed] [Google Scholar]
- 14.Taylor A, Slater A, Mapstone N, Taylor S, Halligan S. Staging rectal cancer: MRI compared to MDCT. Abdom Imaging. 2007;32:323–327. doi: 10.1007/s00261-006-9081-4. . PMid:16967240. [DOI] [PubMed] [Google Scholar]
- 15.Muthusamy VR, Chang KJ. Optimal methods for staging rectal cancer. Clin Cancer Res. 2007;13:6877s–6884s. doi: 10.1158/1078-0432.CCR-07-1137. . PMid:18006793. [DOI] [PubMed] [Google Scholar]
- 16.Gualdi GF, Casciani E, Guadalaxara A, d'Orta C, Polettini E, Pappalardo G. Local staging of rectal cancer with transrectal ultrasound and endorectal magnetic resonance imaging: comparison with histologic findings. Dis Colon Rectum. 2000;43:338–345. doi: 10.1007/BF02258299. . PMid:10733115. [DOI] [PubMed] [Google Scholar]
- 17.Schnall MD, Furth EE, Rosato EF, Kressel HY. Rectal tumor stage: correlation of endorectal MR imaging and pathologic findings. Radiology. 1994;190:709–714. doi: 10.1148/radiology.190.3.8115616. PMid:8115616. [DOI] [PubMed] [Google Scholar]
- 18.Beets-Tan RG, Beets GL, Vliegen RF, et al. Accuracy of magnetic resonance imaging in prediction of tumour-free resection margin in rectal cancer surgery. Lancet. 2001;17; 357:497–504. doi: 10.1016/s0140-6736(00)04040-x. [DOI] [PubMed] [Google Scholar]
- 19.Maas M, Lambregts DMJ, Lahaye MJ, et al. T-staging of rectal cancer: accuracy of 3.0 Tesla MRI compared with 1.5 Tesla. Abdom Imaging. 2012;37:475–481. doi: 10.1007/s00261-011-9770-5. . PMid:21674192. [DOI] [PMC free article] [PubMed] [Google Scholar]
- 20.Mathur P, Smith JJ, Ramsey C, et al. Comparison of CT and MRI in the pre-operative staging of rectal adenocarcinoma and prediction of circumferential resection margin involvement by MRI. Colorectal Dis. 2003;5:396–401. doi: 10.1046/j.1463-1318.2003.00537.x. . PMid:12925069. [DOI] [PubMed] [Google Scholar]
- 21.MERCURY Study Group. Diagnostic accuracy of preoperative magnetic resonance imaging in predicting curative resection of rectal cancer: prospective observational study. Br Med J. 2006;333:779. doi: 10.1136/bmj.38937.646400.55. [DOI] [PMC free article] [PubMed] [Google Scholar]
- 22.Slater A, Halligan S, Taylor SA, Marshall M. Distance between the rectal wall and mesorectal fascia measured by MRI: effect of rectal distension and implications for preoperative prediction of a tumour-free circumferential resection margin. Clin Radiol. 2006;61:65–70. doi: 10.1016/j.crad.2005.08.010. . PMid:16356818. [DOI] [PubMed] [Google Scholar]
- 23.Hermanek P, Merkel S, Fietkau R, Rödel C. Regional lymph node metastasis and locoregional recurrence of rectal carcinoma in the era of TNM surgery. Implications for treatment decisions. Int J Colorectal Dis. 2010;25:359–368. doi: 10.1007/s00384-009-0864-2. . PMid:20012295. [DOI] [PubMed] [Google Scholar]
- 24.Wang C, Zhou Z, Wang Z, et al. Patterns of neoplastic foci and lymph node micrometastasis within the mesorectum. Langenbecks Arch Surg. 2005;390:312–318. doi: 10.1007/s00423-005-0562-7. . PMid:16049726. [DOI] [PubMed] [Google Scholar]
- 25.Heriot A, Hicks R, Drummond E. Does positron emission tomography change management in primary rectal cancer? A prospective assessment. Dis Colon Rectum. 2004;47:451–458. doi: 10.1007/s10350-003-0089-3. . PMid:14978612. [DOI] [PubMed] [Google Scholar]
- 26.Brown G, Richards CJ, Bourne MW, et al. Morphologic predictors of lymph node status in rectal cancer with use of high-spatial resolution MR imaging with histopathologic comparison. Radiology. 2003;227:371–377. doi: 10.1148/radiol.2272011747. . PMid:12732695. [DOI] [PubMed] [Google Scholar]
- 27.Lahaye M, Engelen S, Kessels A. USPIO-enhanced MR imaging for nodal staging in patients with primary rectal cancer: predictive criteria. Radiology. 2008;246:804–811. doi: 10.1148/radiol.2463070221. . PMid:18195379. [DOI] [PubMed] [Google Scholar]
- 28.Lambregts DMJ, Beets GL, Maas M, et al. Accuracy of gadofosveset-enhanced MRI for nodal staging and restaging in rectal cancer. Ann Surg. 2011;253:539–545. doi: 10.1097/SLA.0b013e31820b01f1. . PMid:21239980. [DOI] [PubMed] [Google Scholar]
- 29.Koh DM, Amoozadeh YC, Blackledge MC, Collins DJC. Diffusion-weighted MR imaging. Springer Verlag; 2009. [Google Scholar]
- 30.Assumpcao L, Choti MA, Gleisner AL, et al. Patterns of recurrence following liver resection for colorectal metastases: effect of primary rectal tumor site. Arch Surg. 2008;143:743–749. doi: 10.1001/archsurg.143.8.743. . PMid:18711033. [DOI] [PMC free article] [PubMed] [Google Scholar]
- 31.Ward J, Naik KS, Guthrie JA, Wilson D, Robinson PJ. Hepatic lesion detection: comparison of MR imaging after the administration of superparamagnetic iron oxide with dual-phase CT by using alternative-free response receiver operating characteristic analysis. Radiology. 1999;210:459–466. doi: 10.1148/radiology.210.2.r99fe05459. [DOI] [PubMed] [Google Scholar]
- 32.Bipat S, van Leeuwen MS, Comans EFI, et al. Colorectal liver metastases: CT, MR imaging, and PET for diagnosis—meta-analysis. Radiology. 2005;237:123–131. doi: 10.1148/radiol.2371042060. . PMid:16100087. [DOI] [PubMed] [Google Scholar]
- 33.Niekel MC, Bipat S, Stoker J. Diagnostic imaging of colorectal liver metastases with CT, MR imaging, FDG PET, and/or FDG PET/CT: a meta-analysis of prospective studies including patients who have not previously undergone treatment. Radiology. 2010;257:674–684. doi: 10.1148/radiol.10100729. . PMid:20829538. [DOI] [PubMed] [Google Scholar]
- 34.Grassetto G, Marzola MC, Minicozzi A, Al-Nahhas A, Rubello D. F-18 FDG PET/CT in rectal carcinoma: where are we now? Clin Nucl Med. 2011;36:884–888. doi: 10.1097/RLU.0b013e318219b507. . PMid:21892038. [DOI] [PubMed] [Google Scholar]
- 35.Evans J, Patel U, Brown G. Rectal cancer: primary staging and assessment after chemoradiotherapy. Semin Radiat Oncol. 2011;21:169–177. doi: 10.1016/j.semradonc.2011.02.002. . PMid:21645861. [DOI] [PubMed] [Google Scholar]
- 36.Eisenhauer EA, Therasse P, Bogaerts J, et al. New response evaluation criteria in solid tumours: revised RECIST guideline (version 1.1) Eur J Cancer. 2009;45:228–247. doi: 10.1016/j.ejca.2008.10.026. . PMid:19097774. [DOI] [PubMed] [Google Scholar]
- 37.Gavioli M, Bagni A, Piccagli I, Fundaro S, Natalini G. Usefulness of endorectal ultrasound after preoperative radiotherapy in rectal cancer: comparison between sonographic and histopathologic changes. Dis Colon Rectum. 2000;43:1075–1083. doi: 10.1007/BF02236553. . PMid:10950005. [DOI] [PubMed] [Google Scholar]
- 38.Rau B, Hünerbein M, Barth C, et al. Accuracy of endorectal ultrasound after preoperative radiochemotherapy in locally advanced rectal cancer. Surg Endosc. 1999;13:980–984. doi: 10.1007/s004649901151. . PMid:10526031. [DOI] [PubMed] [Google Scholar]
- 39.Pomerri F, Pucciarelli S, Maretto I, et al. Prospective assessment of imaging after preoperative chemoradiotherapy for rectal cancer. Surgery. 2011;149:56–64. doi: 10.1016/j.surg.2010.03.025. . PMid:20452636. [DOI] [PubMed] [Google Scholar]
- 40.Runkel N. Chirurgie des kolorektalen Karzinoms. Coloproctology. 2010;31:110–121. doi: 10.1007/s00053-009-0011-0. [DOI] [Google Scholar]
- 41.Capirci C, Rampin L, Erba PA, et al. Sequential FDG-PET/CT reliably predicts response of locally advanced rectal cancer to neo-adjuvant chemo-radiation therapy. Eur J Nucl Med Mol Imaging. 2007;34:1583–1593. doi: 10.1007/s00259-007-0426-1. . PMid:17503039. [DOI] [PubMed] [Google Scholar]
- 42.Lordick F, Ott K, Krause B, Weber W. PET to assess early metabolic response and to guide treatment of adenocarcinoma of the oesophagogastric junction: the MUNICON phase II trial. Lancet Oncol. 2007;8:797–805. doi: 10.1016/S1470-2045(07)70244-9. . PMid:17693134. [DOI] [PubMed] [Google Scholar]
- 43.Cascini G, Avallone A, Delrio P. 18F-FDG PET is an early predictor of pathologic tumor response to preoperative radiochemotherapy in locally advanced rectal cancer. J Nucl Med. 2006;47:1241–1248. PMid:16883000. [PubMed] [Google Scholar]
- 44.Barbaro B, Fiorucci C, Tebala C, et al. Locally advanced rectal cancer: MR imaging in prediction of response after preoperative chemotherapy and radiation therapy. Radiology. 2009;250:730–739. doi: 10.1148/radiol.2503080310. . PMid:19244043. [DOI] [PubMed] [Google Scholar]
- 45.Chen C-C, Lee R-C, Lin J-K, Wang L-W, Yang S-H. How accurate is magnetic resonance imaging in restaging rectal cancer in patients receiving preoperative combined chemoradiotherapy? Dis Colon Rectum. 2005;48:722–728. doi: 10.1007/s10350-004-0851-1. . PMid:15747073. [DOI] [PubMed] [Google Scholar]
- 46.Vliegen RFA, Beets GL, Lammering G, et al. Mesorectal fascia invasion after neoadjuvant chemotherapy and radiation therapy for locally advanced rectal cancer: accuracy of MR imaging for prediction. Radiology. 2008;246:454–462. doi: 10.1148/radiol.2462070042. . PMid:18227541. [DOI] [PubMed] [Google Scholar]
- 47.Koh DM, Chau I, Tait D, Wotherspoon A, Cunningham D, Brown G. Evaluating mesorectal lymph nodes in rectal cancer before and after neoadjuvant chemoradiation using thin-section T2-weighted magnetic resonance imaging. Int J Radiat Oncol Biol Phys. 2008;71:456–461. doi: 10.1016/j.ijrobp.2007.10.016. . PMid:18164860. [DOI] [PubMed] [Google Scholar]
- 48.Suppiah A, Hunter IA, Cowley J, et al. Magnetic resonance imaging accuracy in assessing tumour down-staging following chemoradiation in rectal cancer. Colorectal Dis. 2009;11:249–253. doi: 10.1111/j.1463-1318.2008.01593.x. . PMid:18513192. [DOI] [PubMed] [Google Scholar]
- 49.Padhani AR, Liu G, Koh DM, et al. Diffusion weighted magnetic resonance imaging as a cancer biomarker: consensus and recommendations. Neoplasia. 2009;11:102–125. doi: 10.1593/neo.81328. PMid:19186405. [DOI] [PMC free article] [PubMed] [Google Scholar]
- 50.Dzik-Jurasz A, Domenig C, George M, et al. Diffusion MRI for prediction of response of rectal cancer to chemoradiation. Lancet. 2002;360:307–308. doi: 10.1016/S0140-6736(02)09520-X. . PMid:12147376. [DOI] [PubMed] [Google Scholar]
- 51.Koh DM, Scurr E, Collins D, et al. Predicting response of colorectal hepatic metastasis: value of pretreatment apparent diffusion coefficients. Am J Roentgenol. 2007;188:1001–1008. doi: 10.2214/AJR.06.0601. [DOI] [PubMed] [Google Scholar]
- 52.Hein PA, Kremser C, Judmaier W, et al. Diffusion-weighted magnetic resonance imaging for monitoring diffusion changes in rectal carcinoma during combined, preoperative chemoradiation: preliminary results of a prospective study. Eur J Radiol. 2003;45:214–222. doi: 10.1016/S0720-048X(02)00231-0. . PMid:12595106. [DOI] [PubMed] [Google Scholar]
- 53.Park MJ, Kim SH, Lee SJ, Jang KM, Rhim H. Locally advanced rectal cancer: added value of diffusion-weighted MR imaging for predicting tumor clearance of the mesorectal fascia after neoadjuvant chemotherapy and radiation therapy. Radiology. 2011;260:771–780. doi: 10.1148/radiol.11102135. . PMid:21846762. [DOI] [PubMed] [Google Scholar]
- 54.Brown G, Radcliffe AG, Newcombe RG, Dallimore NS, Bourne MW, Williams GT. Preoperative assessment of prognostic factors in rectal cancer using high-resolution magnetic resonance imaging. Br J Surg. 2003;90:355–364. doi: 10.1002/bjs.4034. . PMid:12594673. [DOI] [PubMed] [Google Scholar]


