

Abstract
Summary: zCall is a variant caller specifically designed for calling rare single-nucleotide polymorphisms from array-based technology. This caller is implemented as a post-processing step after a default calling algorithm has been applied. The algorithm uses the intensity profile of the common allele homozygote cluster to define the location of the other two genotype clusters. We demonstrate improved detection of rare alleles when applying zCall to samples that have both Illumina Infinium HumanExome BeadChip and exome sequencing data available.
Availability: http://atguweb.mgh.harvard.edu/apps/zcall.
Contact: bneale@broadinstitute.org
Supplementary Information: Supplementary data are available at Bioinformatics online.
1 INTRODUCTION
Array-based genotyping has been a cost-effective method to capture common variation in the population and has led to the discovery of genetic risk factors for a wide variety of diseases (Visscher et al., 2012). In most instances, the significantly associated single-nucleotide polymorphism (SNP) is not known to be causal but rather likely tags the causal variants through linkage disequilibrium. In contrast, the mapping of Mendelian diseases has been successful at identifying not only the gene of interest but also the specific variant or variants that are likely causal. Most of the causal alleles for Mendelian diseases have been found in the coding region of the human genome (i.e. the exome) (Botstein and Risch, 2003). With recent developments in sequencing, the human genetics community has aggregated an extensive list of coding region variants for the purposes of designing array-based genotyping platforms that capture these variants (e.g. the Illumina Infinium HumanExome BeadChip and the Affymetrix Axiom Exome Array Plate). The overwhelming majority of variation assayed on the exome chip has a minor allele frequency <1%.
Existing genotype callers were primarily designed for common variation (Korn et al., 2008; Ritchie et al., 2011). For rare variation, however, only the common allele homozygote cluster is well populated limiting the efficacy of clustering algorithms. To address this need, we developed a new method to accurately call rare variation for array-based genotyping called zCall.
2 METHODS
Array-based genotyping works by using two measures of intensity to separate points into clusters that correspond to a given genotype. Figure 1 shows a hypothetical cluster plot for a biallelic locus where there are three clusters labeled as AA, AB and BB. The three clusters can be separated by a vertical (x = tx) and horizontal (y = ty) line where tx and ty are defined from the mean and variance of the homozygote clusters (AA and BB) and scaled by a z-score threshold, z. Subsequently, genotypes are assigned to points based on their position with respect to tX and tY.
Fig. 1.
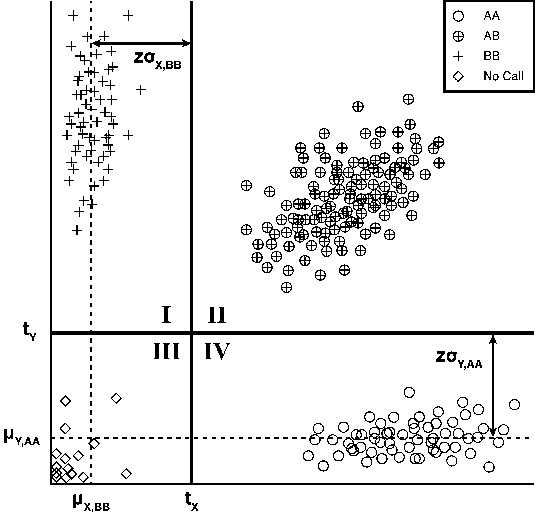
Example genotype intensity plot. Schematic of how zCall assigns genotypes to points based on the normalized intensity distribution of the homozygote clusters. In normalized intensity space, the common allele homozygote clusters lie along the x and y axes (circles and pluses) and the heterozygote cluster lies along the line y = x (circled pluses). The three genotype clusters can be separated by a vertical (x = tX) and horizontal line (y = tY) that are derived by solving for the location of z standard deviations from the mean in the direction of the minor axis of the cluster. After tX and tY have been defined, points are assigned genotypes based on their position relative to the thresholds. Points in Quadrant I are classified as homozygotes (BB), points in Quadrant II are classified as heterozygotes (AB), points in Quadrant III are classified as No Calls, and points in Quadrant IV are classified as homozygotes (AA)
For rare variants, we can directly calculate the threshold for the common allele homozygote based on the genotypes from a default caller such as GenCall (Illumina Inc., 2005). We then estimate the rare allele homozygote threshold through a linear regression model that relates the means and standard deviations of the X and Y intensities (μY,AA ~ μX,BB; σY,AA ~ σX,BB) using common sites (minor allele frequency >5%) where the clustering algorithms have been successful. To find the best z-score threshold, common sites are recalled using various values of z to find the best overall concordance.
The zCall algorithm is implemented as follows. Run a default genotype caller to obtain calls at all sites. Next, use linear regression to determine the relationship between the means and standard deviations of the X and Y intensities for common sites. Third, using those same common sites, find the optimal value of z. Finally, at each site recall genotypes using z and the linear regression to calculate tX and tY. Only missing genotypes should be recalled based on subsequent analysis.
3 RESULTS
We genotyped 9380 samples from a prior Swedish schizophrenia association study (Bergen et al., 2012) and 90 HapMap samples on the Illumina Infinium HumanExome BeadChip. As described in the Supplementary Methods, we used Illumina’s GenCall algorithm to generate two sets of genotype calls and Illumina’s GenomeStudio software to normalize raw intensities.
First, we used linear regression (R Development Core Team, 2010) to find the relationship between the means and standard deviations of the X and Y intensities from 10 538 autosomal, common sites using 4643 samples with genotype calls from a 9479 sample cluster file and found they were correlated ( = 0.069,
  = 0.027, P < 2 × 10⁻¹⁶) (Supplementary Table S1). Next, we found that z = 7 performed well to classify common variation (Supplementary Table S2). Finally, new genotypes were assigned based on thresholds calculated from the linear regression model with z = 7 and means and standard deviations calculated from 947 samples with GenCall genotype calls from a 90-sample cluster file.
To test how well zCall works for rare variation, we compared both GenCall and zCall exome chip genotype calls to whole-exome sequencing genotypes in 947 Swedish samples (Supplementary Methods). To assess rare variant performance, we used the SNP-wise concordance (SWC), which is calculated by dividing passing sites by the total number of sites. A SNP is considered passing when the only error is a common homozygote being called a No Call. For example, when considering singletons (i.e. one heterozygote), the heterozygote is called correctly as a heterozygote and no common homozygotes are called as heterozygotes. For 10 075 autosomal, singleton sites, the SWC between GenCall and whole-exome sequencing was 92.49% and 96.84%, respectively, for zCall. The main error mode of GenCall was calling the singleton heterozygote as a No Call (6.61%) while the main error mode of zCall is calling common allele homozygotes as heterozygotes (2.32%). By restricting zCall to missing genotype calls, we observed a SWC improvement to 99.12% (Supplementary Fig. S1).
We also tried using genotype calls from a larger cluster file (9479 samples), but the performance of zCall was slightly worse. Even though more singletons were called correctly when using a larger cluster file (SWC = 94.65% versus 92.49%), more genotype errors were made that cannot be recovered when only calling No Calls (SWC = 98.60% versus 99.12%). Therefore, zCall performs more effectively using a smaller cluster file.
We also assessed the effect of sample size on threshold definition. We used three sample sizes for threshold definition: 90, 947 and 9479. We found that 90 samples were insufficient to define the thresholds (SWC = 98.86%), but that there was no difference in SWC between 947 samples and 9479 samples (99.12% for both).
To provide an unbiased evaluation, we compared GenCall and zCall genotype calls to whole-exome sequencing data from 369 samples from the ARRA Autism Sequencing Consortium. For 10 712 singletons, we found the SWC using GenCall to be 93.12% and using zCall restricted to No Calls to be 99.27% (Supplementary Fig. S2). We also compared our method with optiCall (Shah et al., 2012) and found for 10 705 singletons, the SWC of optiCall was 98.21% versus 99.27% for zCall (Supplementary Fig. S3).
4 CONCLUSION
We have demonstrated that zCall improves the performance of GenCall to detect singletons by ~7% in two different datasets. By restricting to recalling missing genotypes, we minimize the number of errors introduced while increasing the sensitivity of the default caller for rare variation. Additionally, zCall allows for parallel calling once the thresholds have been defined. Overall, we demonstrate improved ability to capture rare variation over existing methods.
Supplementary Material
ACKNOWLEDGEMENTS
We thank the Genetic Analysis Platform, the Biological Samples Platform and the Genome Sequencing Platform at the Broad Institute for data generation.
Funding: The Swedish Council for Working Life and Social Research (FO 184/2000; 2001-2368); the National Institutes of Health (MH079126, MH089208, MH089025, MH089004, MH089175, MH089482); the Gerstner Family Foundation and the Stanley Medical Research Institute.
Conflict of Interest: None Declared.
REFERENCES
- Bergen SE, et al. Genome-wide association study in a Swedish population yields support for greater CNV and MHC involvement in schizophrenia compared to bipolar disorder. Mol. Psychiatry. 2012 doi: 10.1038/mp.2012.73. DOI: 10.1038/mp.2012.73. [DOI] [PMC free article] [PubMed] [Google Scholar]
- Botstein D, Risch N. Discovering genotypes underlying human phenotypes: past successes for mendelian disease, future approaches for complex disease. Nat. Genet. 2003;33:228–237. doi: 10.1038/ng1090. [DOI] [PubMed] [Google Scholar]
- Illumina Inc. Illumina GenCall Data Analysis Software. TECHNOLOGY SPOTLIGHT. 2005 Available at http://www.illumina.com/Documents/products/technotes/technote_gencall_data_analysis_software.pdf (8 August 2012) [Google Scholar]
- Korn JM, et al. Integrated genotype calling and association analysis of SNPs, common copy number polymorphisms and rare CNVs. Nat. Genet. 2008;40:1253–1260. doi: 10.1038/ng.237. [DOI] [PMC free article] [PubMed] [Google Scholar]
- R Development Core Team. R: A Language and Environment for Statistical Computing. Vienna, Austria: R Foundation for Statistical Computing; 2010. [Google Scholar]
- Ritchie M, et al. Comparing genotyping algorithms for Illumina’s Infinium whole-genome SNP BeadChips. BMC Bioinformatics. 2011;12:68. doi: 10.1186/1471-2105-12-68. [DOI] [PMC free article] [PubMed] [Google Scholar]
- Shah TS, et al. optiCall: a robust genotype-calling algorithm for rare, low frequency and common variants. Bioinformatics. 2012;28:1598–1603. doi: 10.1093/bioinformatics/bts180. [DOI] [PMC free article] [PubMed] [Google Scholar]
- Visscher PM, et al. Five years of GWAS discovery. Am. J. Hum. Genet. 2012;90:7–24. doi: 10.1016/j.ajhg.2011.11.029. [DOI] [PMC free article] [PubMed] [Google Scholar]
Associated Data
This section collects any data citations, data availability statements, or supplementary materials included in this article.