Summary
Background and objectives
The hemodialysis procedure may acutely induce regional left ventricular systolic dysfunction. This study evaluated the prevalence, time course, and associated patient- and dialysis-related factors of this entity and its association with outcome.
Design, setting, participants, & measurements
Hemodialysis patients (105) on a three times per week dialysis schedule were studied between March of 2009 and March of 2010. Echocardiography was performed before dialysis, at 60 and 180 minutes intradialysis, and at 30 minutes postdialysis. Hemodialysis-induced regional left ventricular systolic dysfunction was defined as an increase in wall motion score in more than or equal to two segments.
Results
Hemodialysis-induced regional left ventricular systolic dysfunction occurred in 29 (27%) patients; 17 patients developed regional left ventricular systolic dysfunction 60 minutes after onset of dialysis. Patients with hemodialysis-induced left ventricular systolic dysfunction were more often male, had higher left ventricular mass index, and had worse predialysis left ventricular systolic function (left ventricular ejection fraction). The course of blood volume, BP, heart rate, electrolytes, and acid–base parameters during dialysis did not differ significantly between the two groups. Patients with hemodialysis-induced regional left ventricular systolic dysfunction had a significantly higher mortality after correction for age, sex, dialysis vintage, diabetes, cardiovascular history, ultrafiltration volume, left ventricular mass index, and predialysis wall motion score index.
Conclusions
Hemodialysis induces regional wall motion abnormalities in a significant proportion of patients, and these changes are independently associated with increased mortality. Hemodialysis-induced regional left ventricular systolic dysfunction occurs early during hemodialysis and is not related to changes in blood volume, electrolytes, and acid–base parameters.
Introduction
Cardiac mortality and morbidity is much higher in hemodialysis patients compared with the general population (1,2). The excess mortality cannot be explained by traditional risk factors (3). It is increasingly recognized that the hemodialysis procedure itself may be a risk factor in developing cardiac dysfunction (4–7). By applying positron emission tomography scanning during hemodialysis, we and others showed that hemodialysis sessions reduce myocardial blood flow (8,9). In some patients, the fall in myocardial blood flow was severe enough to result in reversible left ventricular (LV) systolic dysfunction, especially in regions with the greatest fall in myocardial blood flow (8,9). Reversible regional LV systolic dysfunction during hemodialysis has also been shown in several relatively small studies using serial echocardiography (5,10). In a larger study population, the work by Burton et al. (11) recently showed that hemodialysis-induced LV systolic dysfunction occurred in more than one-half of their patients and was associated with higher all-cause mortality. However, the echocardiographic technique to assess the development of hemodialysis-induced LV systolic dysfunction in these studies (5,10,11) is not routinely used in clinical patient care. Moreover, the time course of this entity in relation to blood volume and hemodynamic changes is not well delineated. Also, the relationship between hemodialysis-induced LV systolic dysfunction and relevant patient characteristics, like predialysis LV function and LV mass, has not been studied in detail. Finally, the association between hemodialysis-induced LV systolic dysfunction and specific dialysis-related factors, such as electrolyte and acid–base shifts, is presently unknown but relevant, because these factors can influence cardiac function and are modifiable (12–15). In this study, we assessed >the acute effects of hemodialysis on global andregional LV systolic function by serial echocardiography before, during, and after dialysis using the routine systolic measurements for clinical practice that are recommended by the American Society of Echocardiography (16). In addition, we studied the association between hemodialysis-induced LV systolic dysfunction and patient- and dialysis-related factors and its impact on outcome.
Materials and Methods
Patients and Study Design
Hemodialysis patients from the Dialysis Center Groningen and the University Medical Center Groningen were eligible for this study if they were treated with hemodialysis for more than 3 months and were on a three time per week hemodialysis schedule. Patients with severe heart failure (New York Heart Association functional classification, stage IV) and patients who did not have an adequate window for echocardiography imaging were excluded.
Patients were studied at the dialysis session after the longest interdialytic interval (3 days). The dialysis duration was 4 hours. Patients’ characteristics were assessed at entry into the study. Diabetes was defined as fasting blood glucose>6 mmol/L or the use of antidiabetic drugs. Hypertension was defined as a predialysis systolic BP>140 mmHg and/or diastolic BP>90 mmHg or the use of antihypertensive drugs. Cardiovascular history was defined as any history of ischemic heart disease, congestive heart failure, coronary artery bypass grafting, percutaneous coronary intervention, stroke, or peripheral vascular disease.
BP and heart rate were measured 30 minutes before the start of hemodialysis, every 30 minutes during hemodialysis, and 30 minutes postdialysis. Blood samples were collected at the start of hemodialysis, 60 and 180 minutes intrahemodialysis, and the end of the dialysis session. Blood was sampled for the immediate determination of hematocrit, plasma albumin, acid–base parameters, sodium, potassium, magnesium, and total and ionized serum calcium levels. The change in blood volume was calculated from the change in hematocrit ([(Ht0/Ht1)−1]×100). Ht0 and Ht1 represent the hematocrit at the start of hemodialysis and during hemodialysis, respectively. Ultrafiltration rate was expressed in milliliters per hour per kilogram by dividing the ultrafiltration volume by dialysis session length and target weight as previously described (17). Equilibrated Kt/V was calculated from pre- and postdialysis plasma urea concentration according to the second generation logarithmic Daurgirdas equation (18). The nutritional status of the patients was assessed with the seven-point subjective global assessment. This seven-point subjective global assessment has been described and validated in dialysis patients in The Netherlands Cooperative Study on the Adequacy of Dialysis (19). A score of seven indicates a normal nutritional status, and a score of one indicates severe protein energy wasting. The study was performed according to the Declaration of Helsinki and approved by the Medical Ethical Committee of the University Medical Center Groningen. All patients gave written informed consent. The study was performed between March of 2009 and March of 2010.
Dialysis Settings
All patients were on bicarbonate dialysis with a low-flux polysulfone hollow-fiber dialyser (F8; Fresenius Medical Care, Bad Hamburg, Germany). Blood flow and dialysate flow rates were 250–350 ml/min and 500 ml/min, respectively. Dialysate temperature was 36.0°C in all patients. Dialysate composition was sodium (139 mmol/L), potassium (1.0 or 2.0 mmol/L), calcium (1.5 mmol/L), magnesium (0.5 mmol/L), chloride (108 mmol/L), bicarbonate (34 mmol/L), acetate (3.0 mmol/L), and glucose (1.0 g/L). We used constant ultrafiltration rate and dialysate conductivity. The water for hemodialysis complied with the requirements of the European Pharmacopoeia (<100 colony forming units/ml and <0.25 endotoxin units/ml). Patients received a light meal after the echocardiography at 60 minutes intradialysis. All patients were dialyzed in supine position, which was convenient for echocardiography and excluded the effect of posture changes on blood volume
Echocardiography Examination
A dedicated team of three experienced technicians performed two-dimensional echocardiography using a General Electric VIVID 7 system with a 2.5-mHz probe. Echocardiography was performed four times: before hemodialysis, at 60 and 180 minutes after the start of hemodialysis, and at 30 minutes after the end of hemodialysis. One experienced technician (Y.M.H.) performed all the analyses offline according to the guidelines of the European Society of Echocardiography (20). At least three consecutive heartbeats in each view were acquired. Global and regional systolic function was evaluated by left ventricular ejection fraction (LVEF) and wall motion score index (WMSI), respectively. LVEF was calculated using the biplane Simpson’s method. WMSI was evaluated according to the 16-segments model (as recommended by the American Society of Echocardiography) (16) by a single technician (Y.M.H) who was blinded to the order of echocardiography studies. For each patient, the number of LV regions (from a total of 16) that developed new (not present before hemodialysis) regional wall motion abnormalities (RWMAs) during hemodialysis was calculated. RWMA was defined as an increase in WMS in the specific LV segment occurring at 60 minutes intradialysis, 180 minutes intradialysis, or 30 minutes posthemodialysis compared with predialysis. Hemodialysis-induced LV systolic dysfunction was defined as the development of new RWMAs in two or more LV segments compared with predialysis.
LV mass index was calculated as described previously (21). Left ventricular hypertrophy (LVH) was defined as LV mass index>95 g/m2 for women and >115 g/m2 for men.
Statistical Analyses
Data are reported as mean ± SD for continuous variables with normal distributions, median (interquartile range [IQR]) for skewed variables, and number (percent) for categorical data. Comparisons with baseline were made by paired t, Wilcoxon signed rank, and chi-squared tests for parametric, nonparametric, and categorical variables, respectively. The survival curves for the patients with and without hemodialysis-induced LV systolic dysfunction were computed by the Kaplan–Meier method, and differences between the curves were compared by log-rank test. The multivariate Cox proportional hazards model was used to evaluate the association between hemodialysis-induced LV systolic dysfunction and all-cause mortality (adjusted for age, sex, dialysis vintage, diabetes, cardiovascular history, ultrafiltration volume, LV mass index, and predialysis WMSI). Two-sided P value 0.05 was considered significant. All statistical analyses were performed with STATA version 11 (StataCorp LP, College Station, TX).
Results
Patient Characteristics
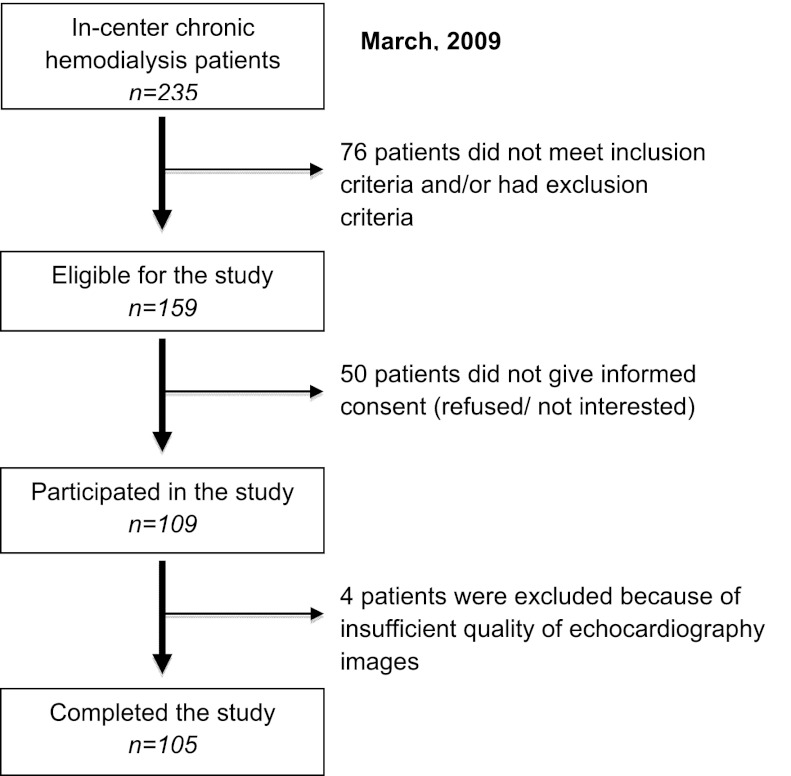
The recruitment process of participants is outlined in Figure 1; 109 patients participated in this study, and 4 patients were excluded from the analysis, because it was not possible to reliably assess the per-segment LV function during hemodialysis. The patient characteristics of the remaining 105 patients are shown in Table 1. The median (IQR) age was 66 (51–75) years, and 64.8% were male (Table 1). They had been treated with hemodialysis for a median of 21.4 (IQR=7.8–48.5) months; 22% of patients had diabetes, and 80% of patients had hypertension. The average total ultrafiltration volume and ultrafiltration rate during hemodialysis were 2.6±0.8 L and 8.5±2.6 ml/kg per hour, respectively (Table 1).
Figure 1.
Recruitment process of study participants.
Table 1.
Patient characteristics
| All Patients (n=105) | No Hemodialysis-Induced Regional LV Dysfunction (n=76) | Hemodialysis-Induced Regional LV Dysfunction (n=29) | P Value | |
|---|---|---|---|---|
| Median age in years (IQR) | 66 (51–75) | 64 (50–75) | 69 (58–78) | 0.18 |
| Male sex (n) | 68 (64.8%) | 45 (59.2%) | 23 (79.3%) | 0.05 |
| Median dialysis vintage in months (IQR) | 21.4 (7.8–48.5) | 24 (8.3–48.3) | 18.4 (5.5–49.7) | 0.69 |
| Diabetes (n) | 23 (21.9%) | 19 (25.0%) | 4 (13.8%) | 0.28 |
| Hypertension (n) | 84 (80.0%) | 61 (80.3%) | 23 (79.3%) | 0.95 |
| Cardiovascular history (n) | 23 (21.9%) | 15 (19.7%) | 8 (27.6%) | 0.39 |
| Median BMI (kg/m2; IQR) | 25.2 (23.0–28.1) | 25.2 (22.6–28.3) | 25.2 (23.2–27.8) | 0.88 |
| Primary renal disease (n) | ||||
| Hypertension | 17 (16.2%) | 12 (15.8%) | 5 (17.2%) | 0.86 |
| Diabetes | 13 (12.4%) | 11 (14.5%) | 2 (6.9%) | 0.29 |
| ADPKD | 14 (13.3%) | 10 (13.6%) | 4 (13.8%) | 0.93 |
| FSGS | 10 (9.5%) | 8 (10.5%) | 2 (6.9%) | 0.57 |
| IgA nephropathy | 4 (3.8%) | 4 (5.3%) | 0 | 0.21 |
| Chronic pyelonephritis | 1 (1.0%) | 1 (1.3%) | 0 | 0.54 |
| Glomerulonephritis | 13 (12.4%) | 10 (13.2%) | 3 (10.3%) | 0.70 |
| Other diagnoses | 16 (15.2%) | 10 (13.2%) | 6 (20.6%) | 0.21 |
| Unknown | 17 (16.2%) | 10 (13.2%) | 7 (24.1%) | 0.17 |
| Medication (n) | ||||
| Aspirin | 57 (54.3%) | 46 (60.5%) | 11 (37.9%) | 0.04 |
| CCB | 14 (13.3%) | 12 (15.8%) | 2 (6.9%) | 0.23 |
| β-Blocker | 60 (57.1%) | 45 (59.2%) | 15 (51.7%) | 0.49 |
| ACE inhibitor | 10 (9.5%) | 8 (10.5%) | 2 (6.9%) | 0.57 |
| ARB | 14 (13.3%) | 10 (13.2%) | 4 (13.8%) | 0.34 |
| Statin | 20 (19.1%) | 14 (18.4%) | 6 (20.7%) | 0.79 |
| Median SGA (IQR) | 6 (6–7) | 6 (6–7) | 6 (5–7) | 0.77 |
| Hematocrit (mean ± SD) | 35.0±3.7 | 35.1±4.0 | 34.6±3.0 | 0.53 |
| Median albumin (g/L; IQR) | 39 (37–41) | 39 (37–42) | 39 (37–41) | 0.64 |
| Median phosphate (mmol/L; IQR) | 1.7 (1.3–1.9) | 1.7 (1.3–2.0) | 1.6 (1.4–1.9) | 0.92 |
| Median Kt/V (IQR) | 4.3 (3.8–4.7) | 4.3 (3.8–4.7) | 4.0 (3.9–4.5) | 0.36 |
| Ultrafiltration volume (L; mean ± SD) | 2.6±0.8 | 2.5±0.7 | 2.60±0.9 | 0.83 |
| Ultrafiltration rate (ml/kg per hour; mean ± SD) | 8.5±2.6 | 8.6±2.5 | 8.3±3.0 | 0.59 |
| LV mass index (g/m2; mean ± SD) | 93.3±26.0 | 89.9±24.6 | 101.7±27.9 | 0.05 |
| LVH (n) | 25 (23.8%) | 19 (25%) | 6 (20.7%) | 0.64 |
| Median predialysis WMSI (IQR) | 1.00 (1.00–1.13) | 1.00 (1.00–1.03) | 1.21 (1.06–1.44) | <0.001 |
| Predialysis LVEF (mean ± SD) | 50.0%±10.4% | 51.8%±9.5% | 45.3%±10.4% | 0.008 |
LV, left ventricular; IQR, interquartile range; BMI, body mass index; ADPKD, adult dominant polycystic kidney disease; FSGS, focal segmental glomerulosclerosis; CCB, calcium channel blocker; ACE, angiotensin-converting enzyme; ARB, angiotensin receptor blocker; SGA, subjective global assessment; LVH, LV hypertrophy; WMSI, wall motion score index; LVEF, LV ejection fraction.
Echocardiographic Parameters
Thirty-seven (35.2%) and forty-two (40.0%) patients had prehemodialysis LVEF<50% and WMSI>1, respectively. LVH was present in 25 (23.8%) patients.
None of the participating patients had angina or any other symptom of myocardial ischemia during or after the hemodialysis session; 29 patients (27%) developed new RWMA in two or more LV segments at 60 minutes intradialysis, 180 minutes intradialysis, or 30 minutes postdialysis, and thus, they had hemodialysis-induced LV systolic dysfunction. Of these patients, 17 (59%) patients had RWMA in more than or equal to two segments at 60 minutes intradialysis, when their blood volume was only −0.9±4.5% lower compared with the start of hemodialysis.
As shown in Table 1, patients with hemodialysis-induced LV systolic dysfunction were more often male (P=0.05), had a higher LV mass index (P=0.05), had a higher predialysis WMSI (P<0.001), and had a lower predialysis LVEF (P=0.008). The proportion of patients with LVH did not differ significantly between patients with (21%) and without (25%) hemodialysis-induced LV systolic dysfunction (P=0.64).
Hemodynamic Parameters
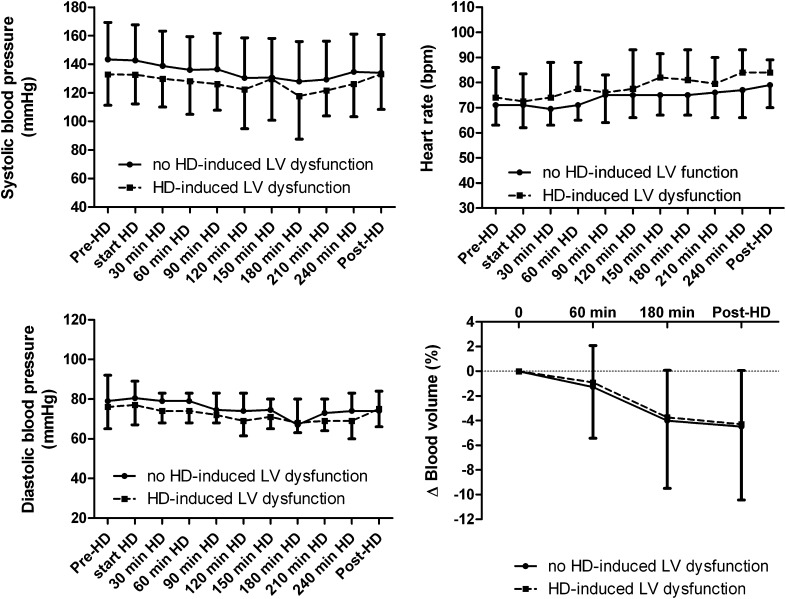
Figure 2 shows the course of systolic and diastolic BPs. Predialysis systolic BP was lower (132.9±21.7 versus 143.4±25.0, P=0.06) and predialysis heart rate was slightly higher (74 [IQR=66–86] versus 71 [IQR=63–82], P=0.30) in patients with compared with patients without hemodialysis-induced LV systolic dysfunction. The difference in predialysis heart rate and systolic BP between the two groups persisted until the end of the hemodialysis session. At the end of hemodialysis, heart rate tended to be higher in patients with compared with patients without hemodialysis-induced LV systolic dysfunction (84 [IQR=77–93] versus 77 [IQR=66–86], P=0.06).
Figure 2.
The course of systolic and diastolic BP, heart rate, and blood volume change in patients with and without hemodialysis-induced regional left ventricular (LV) systolic dysfunction (mean ± SD).
The total ultrafiltration volume and ultrafiltration rate during hemodialysis did not differ significantly between patients with and without hemodialysis-induced LV systolic dysfunction (Table 1). Blood volume decreased during hemodialysis as a result of ultrafiltration. At 60 minutes of hemodialysis,the change in blood volume was −0.9±4.5% and −1.2±3.4% in patients with and without hemodialysis-induced LV systolic dysfunction, respectively (P=0.41). At the end of the hemodialysis session, blood volume was significantly (P<0.001) lower compared with the start of hemodialysis in both groups (−4.3±6.1% and −4.5±4.6% in patients with and without hemodialysis-induced LV systolic dysfunction, respectively). As shown in Figure 2, the blood volume course did not differ between patients with and without hemodialysis-induced LV systolic dysfunction.
Acid–Base and Electrolyte Changes
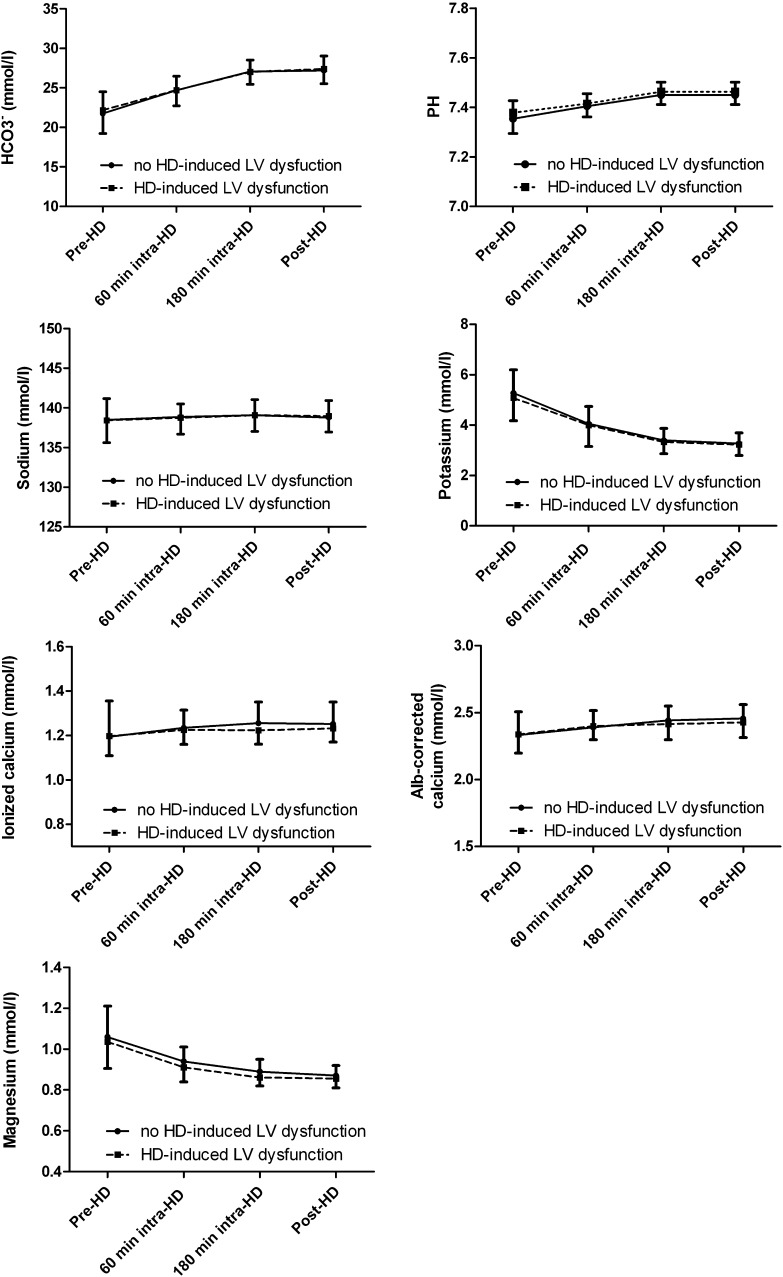
Plasma bicarbonate levels and blood pH rose significantly (P<0.001) during hemodialysis in both groups (Figure 3), but the course of bicarbonate levels and blood pH did not differ significantly between patients with and without hemodialysis-induced LV systolic dysfunction. As shown in Figure 3, plasma levels of sodium, potassium, ionized calcium, albumin-corrected calcium, and magnesium did not differ significantly between patients with and without hemodialysis-induced LV systolic dysfunction.
Figure 3.
The course of acid–base parameters (plasma bicarbonate and blood pH) and electrolytes (plasma sodium, potassium, ionized and albumin-corrected calcium, and magnesium levels) in patients with and without hemodialysis-induced regional LV systolic dysfunction (mean ± SD).
Prognostic Significance of Hemodialysis-Induced Regional LV Dysfunction
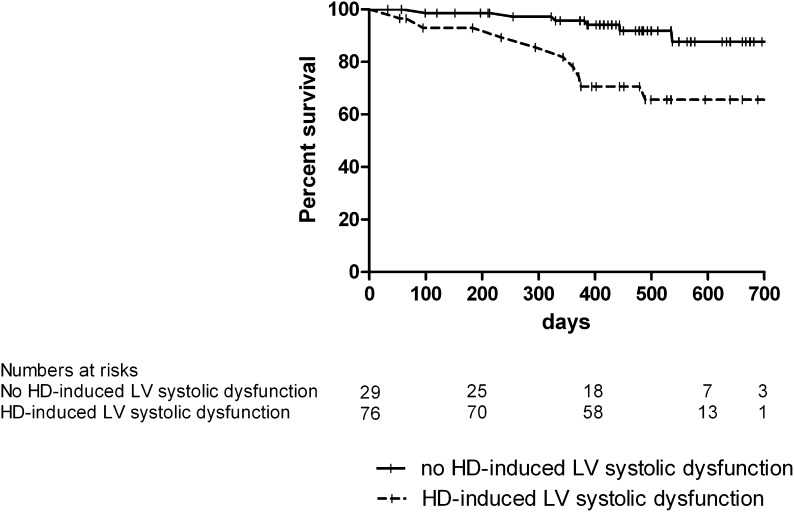
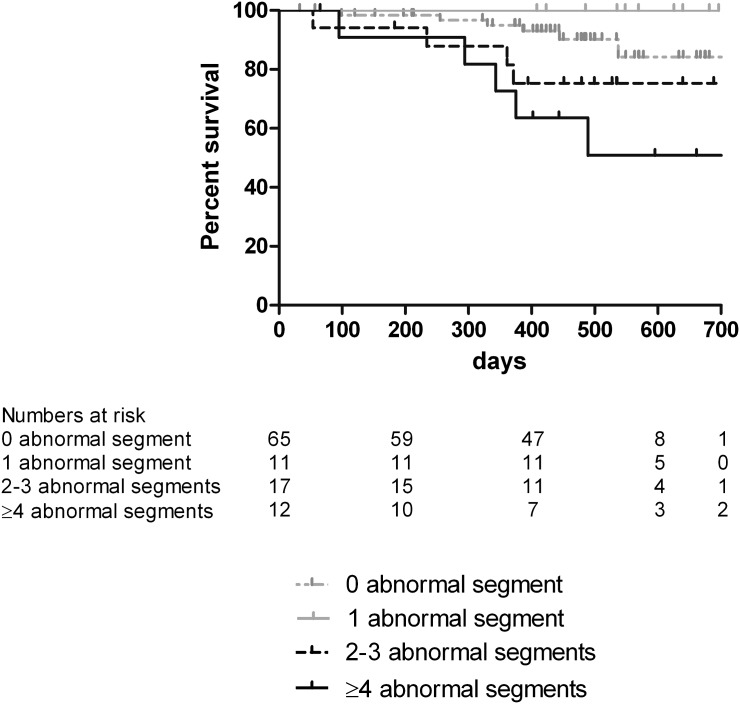
The median (range) duration of follow-up in surviving patients was 16.4 (12.3–24.5) months. The total follow-up time was 130.8 patient years. During follow-up, 9 (31%) patients that developed hemodialysis-induced LV systolic dysfunction and 6 (8%) patients that did not develop hemodialysis-induced LV dysfunction died (P=0.002) (Figure 4); 60% of deaths had a cardiac cause. The difference in mortality between the two groups remained statistically significant after correction for age, sex, dialysis vintage, diabetes, cardiovascular history, ultrafiltration volume, LV mass index, and predialysis WMSI (hazard ratio=4.6, confidence interval=1.15–18.5, P=0.03). As shown in Figure 5, survival worsened with an increased number of abnormal LV segments developing during hemodialysis (overall difference between groups by log-rank test was P=0.009).
Figure 4.
Kaplan–Meier curve of all-cause mortality in patients with and without hemodialysis-induced regional LV systolic dysfunction.
Figure 5.
Kaplan–Meier curve of all-cause mortality in patients who did not develop regional wall abnormalities and patients with an increasing number of LV segments developing regional wall motion abnormalities during hemodialysis.
Discussion
In this study, we found that LV regional systolic dysfunction developed during hemodialysis in about one-quarter of patients. In the majority of these patients, it occurred early during hemodialysis. Hemodialysis-induced regional LV systolic dysfunction was associated with male sex, higher LV mass index, and pre-existent LV dysfunction, but it was not associated with dialysis treatment-related factors, like changes in blood volume, electrolytes, or acid–base parameters. Hemodialysis-induced regional LV systolic dysfunction was independently associated with higher all-cause mortality.
The present study confirms earlier observations that hemodialysis may acutely induce regional LV dysfunction in a substantial proportion of patients (8,9,11,22). However, we found a lower prevalence of hemodialysis-induced regional LV dysfunction than previously reported (11). This finding may be explained by differences in the study population, like a lower proportion of patients with diabetes, cardiovascular history, and LVH in our study. A second explanation might be the difference in the method used for the evaluation of regional LV systolic dysfunction. We used standard echocardiographic evaluation of regional LV function according to the guidelines of the American Society of Echocardiography (16), which is validated for routine clinical application, whereas the work by Burton et al. (11) used the measurement of regional fractional shortening to evaluate regional LV systolic function. Although this method is quantitative and reproducible, it is not recommended in current practice guidelines.
A remarkable finding in our study was the observation that, in many patients, regional LV systolic dysfunction developed early during hemodialysis (i.e., within 1 hour of the start of the dialysis session). At that time, the decrease in blood volume was only marginal. Notably, the ultrafiltration volume and the ultrafiltration rate as well as the change in blood volume did not differ between patients with and without hemodialysis-induced regional LV systolic dysfunction. These observations suggest that intradialytic blood volume changes do not have a dominant role in the development of hemodialysis-induced regional LV dysfunction. In a previous study, using cardiac positron emission tomography scanning during hemodialysis, we also observed that the reduction in myocardial blood flow occurred early (within 30 minutes of the start of dialysis) during hemodialysis, even in the absence of ultrafiltration (8). In that study, there was no correlation between total ultrafiltration volume and the change in myocardial blood flow during hemodialysis. However, another study found that ultrafiltration volume was an independent predictor of the development of regional LV systolic dysfunction during hemodialysis (11).
In the present study, patients who developed hemodialysis-induced LV systolic dysfunction more often had an impaired LV systolic function before hemodialysis more often. This finding suggests that patients with impaired predialysis systolic function are more susceptible to the cardiac stress induced by the hemodialysis procedure. Alternatively, the impaired predialysis LV systolic function may be caused by repetitive hemodialysis-induced myocardial hypoperfusion (myocardial stunning), which may eventually result in fixed LV dysfunction (11). Interestingly, we found that patients who developed hemodialysis-induced LV systolic dysfunction had a higher LV mass index compared with patients with preserved LV systolic function during hemodialysis. It has previously been shown that a higher LV mass index in dialysis patients is associated with a relative reduction in capillary density (myocyte–capillary mismatch) (23), which may contribute to the development of ischemia.
Changes in electrolytes and acid–base parameters during hemodialysis are known to have cardiovascular effects (12–14,24,25) and might play a pathophysiological role in the development of hemodialysis-induced LV systolic dysfunction. In this study, we observed changes in electrolytes and acid–base parameters similar to those changes described previously (24,26). However, we found no significant differences between patients with and without hemodialysis-induced LV systolic dysfunction. Therefore, it is unlikely that electrolyte and acid–base changes during hemodialysis are involved in the pathogenesis of hemodialysis-induced regional LV systolic dysfunction.
Patients with hemodialysis-induced LV systolic dysfunction had a significantly higher mortality during a median follow-up of 16.4 months. In a previous study (11), it was similarly shown that hemodialysis-induced cardiac dysfunction was associated with poor survival after 1 year. In the present study, hemodialysis-induced regional LV dysfunction seemed to be an independent risk factor for all-cause mortality, because the association remained significant after correction for other important prognostic factors, such as age, sex, dialysis vintage, diabetes, cardiovascular history, ultrafiltration volume, LV mass index, and predialysis LV systolic function.
An important limitation of this study is the lack of angiographic evaluation of coronary arteries and therefore, the inability to correlate the echocardiographic findings with underlying coronary artery disease. This limitation should be considered in future studies on the effect of hemodialysis on LV function. A second limitation is the lack of a validated echocardiographic definition of hemodialysis-induced regional LV systolic dysfunction. In this study, hemodialysis-induced LV systolic dysfunction was defined as an increase in WMS in two or more LV segments compared with predialysis. The use of other cutoff values would have influenced the prevalence of this entity as well as its association with outcome, because survival decreased with an increasing number of segments developing abnormal function during hemodialysis. Our study has several strengths. First, this study is the largest study that evaluated the acute effect of hemodialysis on LV global and regional systolic function. Second, we used routine and clinically applicable echocardiographic methods to evaluate global and regional LV systolic function. Third, the echocardiographic analysis of regional LV systolic function was performed by a single technician who was blinded to the order of echocardiography studies.
In conclusion, hemodialysis induces RWMAs in a significant proportion of patients, and these changes are independently associated with increased mortality. Hemodialysis-induced regional LV systolic dysfunction occurs early during hemodialysis, and it is not related to changes in blood volume, electrolytes, and acid–base parameters.
Disclosures
None.
Acknowledgments
We thank the Dutch Kidney Foundation for financial support (Grant C08.2279). A.A.V. is a Clinical Established Investigator of the Netherlands Heart Foundation (2006T37).
This work was previously reported in abstract form (Solmaz et al., J Am Soc Nephrol 22: 495A–496A, 2011).
Footnotes
Published online ahead of print. Publication date available at www.cjasn.org.
References
- 1.Cheung AK, Sarnak MJ, Yan G, Berkoben M, Heyka R, Kaufman A, Lewis J, Rocco M, Toto R, Windus D, Ornt D, Levey AS, HEMO Study Group : Cardiac diseases in maintenance hemodialysis patients: Results of the HEMO Study. Kidney Int 65: 2380–2389, 2004 [DOI] [PubMed] [Google Scholar]
- 2.Foley RN, Parfrey PS, Sarnak MJ: Clinical epidemiology of cardiovascular disease in chronic renal disease. Am J Kidney Dis 32[Suppl 3]: S112–S119, 1998 [DOI] [PubMed] [Google Scholar]
- 3.Kalantar-Zadeh K, Block G, Humphreys MH, Kopple JD: Reverse epidemiology of cardiovascular risk factors in maintenance dialysis patients. Kidney Int 63: 793–808, 2003 [DOI] [PubMed] [Google Scholar]
- 4.Abe S, Yoshizawa M, Nakanishi N, Yazawa T, Yokota K, Honda M, Sloman G: Electrocardiographic abnormalities in patients receiving hemodialysis. Am Heart J 131: 1137–1144, 1996 [DOI] [PubMed] [Google Scholar]
- 5.Selby NM, Fluck RJ, Taal MW, McIntyre CW: Effects of acetate-free double-chamber hemodiafiltration and standard dialysis on systemic hemodynamics and troponin T levels. ASAIO J 52: 62–69, 2006 [DOI] [PubMed] [Google Scholar]
- 6.Wayand D, Baum H, Schätzle G, Schärf J, Neumeier D: Cardiac troponin T and I in end-stage renal failure. Clin Chem 46: 1345–1350, 2000 [PubMed] [Google Scholar]
- 7.Bleyer AJ, Hartman J, Brannon PC, Reeves-Daniel A, Satko SG, Russell G: Characteristics of sudden death in hemodialysis patients. Kidney Int 69: 2268–2273, 2006 [DOI] [PubMed] [Google Scholar]
- 8.Dasselaar JJ, Slart RH, Knip M, Pruim J, Tio RA, McIntyre CW, de Jong PE, Franssen CF: Haemodialysis is associated with a pronounced fall in myocardial perfusion. Nephrol Dial Transplant 24: 604–610, 2009 [DOI] [PubMed] [Google Scholar]
- 9.McIntyre CW, Burton JO, Selby NM, Leccisotti L, Korsheed S, Baker CS, Camici PG: Hemodialysis-induced cardiac dysfunction is associated with an acute reduction in global and segmental myocardial blood flow. Clin J Am Soc Nephrol 3: 19–26, 2008 [DOI] [PMC free article] [PubMed] [Google Scholar]
- 10.Selby NM, Burton JO, Chesterton LJ, McIntyre CW: Dialysis-induced regional left ventricular dysfunction is ameliorated by cooling the dialysate. Clin J Am Soc Nephrol 1: 1216–1225, 2006 [DOI] [PubMed] [Google Scholar]
- 11.Burton JO, Jefferies HJ, Selby NM, McIntyre CW: Hemodialysis-induced cardiac injury: Determinants and associated outcomes. Clin J Am Soc Nephrol 4: 914–920, 2009 [DOI] [PMC free article] [PubMed] [Google Scholar]
- 12.Rombolà G, Colussi G, De Ferrari ME, Frontini A, Minetti L: Cardiac arrhythmias and electrolyte changes during haemodialysis. Nephrol Dial Transplant 7: 318–322, 1992 [DOI] [PubMed] [Google Scholar]
- 13.Nakamura S, Ogata C, Aihara N, Sasaki O, Yoshihara F, Nakahama H, Inenaga T, Kimura G, Kawano Y: QTc dispersion in haemodialysis patients with cardiac complications. Nephrology (Carlton) 10: 113–118, 2005 [DOI] [PubMed] [Google Scholar]
- 14.van der Sande FM, Cheriex EC, van Kuijk WH, Leunissen KM: Effect of dialysate calcium concentrations on intradialytic blood pressure course in cardiac-compromised patients. Am J Kidney Dis 32: 125–131, 1998 [DOI] [PubMed] [Google Scholar]
- 15.Severi S, Vecchietti S, Cavalcanti S, Mancini E, Santoro A: Electrocardiographic changes during hemodiafiltration with different potassium removal rates. Blood Purif 21: 381–388, 2003 [DOI] [PubMed] [Google Scholar]
- 16.Lang RM, Bierig M, Devereux RB, Flachskampf FA, Foster E, Pellikka PA, Picard MH, Roman MJ, Seward J, Shanewise JS, Solomon SD, Spencer KT, Sutton MS, Stewart WJ, Chamber Quantification Writing Group. American Society of Echocardiography’s Guidelines and Standards Committee. European Association of Echocardiography : Recommendations for chamber quantification: A report from the American Society of Echocardiography’s Guidelines and Standards Committee and the Chamber Quantification Writing Group, developed in conjunction with the European Association of Echocardiography, a branch of the European Society of Cardiology. J Am Soc Echocardiogr 18: 1440–1463, 2005 [DOI] [PubMed] [Google Scholar]
- 17.Flythe JE, Kimmel SE, Brunelli SM: Rapid fluid removal during dialysis is associated with cardiovascular morbidity and mortality. Kidney Int 79: 250–257, 2011 [DOI] [PMC free article] [PubMed] [Google Scholar]
- 18.Daugirdas JT: Second generation logarithmic estimates of single-pool variable volume Kt/V: An analysis of error. J Am Soc Nephrol 4: 1205–1213, 1993 [DOI] [PubMed] [Google Scholar]
- 19.Visser R, Dekker FW, Boeschoten EW, Stevens P, Krediet RT: Reliability of the 7-point subjective global assessment scale in assessing nutritional status of dialysis patients. Adv Perit Dial 15: 222–225, 1999 [PubMed] [Google Scholar]
- 20.Lang RM, Bierig M, Devereux RB, Flachskampf FA, Foster E, Pellikka PA, Picard MH, Roman MJ, Seward J, Shanewise J, Solomon S, Spencer KT, St John Sutton M, Stewart W, American Society of Echocardiography’s Nomenclature and Standards Committee. Task Force on Chamber Quantification. American College of Cardiology Echocardiography Committee. American Heart Association. European Association of Echocardiography, European Society of Cardiology : Recommendations for chamber quantification. Eur J Echocardiogr 7: 79–108, 2006 [DOI] [PubMed] [Google Scholar]
- 21.Devereux RB, Alonso DR, Lutas EM, Gottlieb GJ, Campo E, Sachs I, Reichek N: Echocardiographic assessment of left ventricular hypertrophy: Comparison to necropsy findings. Am J Cardiol 57: 450–458, 1986 [DOI] [PubMed] [Google Scholar]
- 22.Burton JO, Jefferies HJ, Selby NM, McIntyre CW: Hemodialysis-induced repetitive myocardial injury results in global and segmental reduction in systolic cardiac function. Clin J Am Soc Nephrol 4: 1925–1931, 2009 [DOI] [PMC free article] [PubMed] [Google Scholar]
- 23.Amann K, Rychlík I, Miltenberger-Milteny G, Ritz E: Left ventricular hypertrophy in renal failure. Kidney Int Suppl 68: S78–S85, 1998 [DOI] [PubMed] [Google Scholar]
- 24.Toussaint N, Cooney P, Kerr PG: Review of dialysate calcium concentration in hemodialysis. Hemodial Int 10: 326–337, 2006 [DOI] [PubMed] [Google Scholar]
- 25.Genovesi S, Rivera R, Fabbrini P, Dossi C, Bonforte G, Mircoli L, Ferrari AU, Stella A, Stramba-Badiale M: Dynamic QT interval analysis in uraemic patients receiving chronic haemodialysis. J Hypertens 21: 1921–1926, 2003 [DOI] [PubMed] [Google Scholar]
- 26.Musso CG: Potassium metabolism in patients with chronic kidney disease. Part II: Patients on dialysis (stage 5). Int Urol Nephrol 36: 469–472, 2004 [DOI] [PubMed] [Google Scholar]


