

Background: GRP78 is aberrantly expressed on the surface of many different tumor cells where it functions as a growth factor-like receptor.
Results: SubA cleavage of cell-surface GRP78 abrogates signaling initiated by ligation of the GRP78 COOH-terminal.
Conclusion: SubA specifically cleaves cell-surface GPR78.
Significance: SubA is a powerful tool that can be used to specifically probe the functions of cell-surface GPR78.
Keywords: Calcium Signaling, Cancer, Caspase, Cell-surface Protein, Escherichia coli, Infectious Diseases
Abstract
GRP78, a molecular chaperone with critical endoplasmic reticulum functions, is aberrantly expressed on the surface of cancer cells, including prostate and melanoma. Here it functions as a pro-proliferative and anti-apoptotic signaling receptor via NH2-terminal domain ligation. Auto-antibodies to this domain may appear in cancer patient serum where they are a poor prognostic indicator. Conversely, GRP78 COOH-terminal domain ligation is pro-apoptotic and anti-proliferative. There is no method to disrupt cell-surface GRP78 without compromising the total GRP78 pool, making it difficult to study cell-surface GRP78 function. We studied six cell lines representing three cancer types. One cell line per group expresses high levels of cell-surface GRP78, and the other expresses low levels (human hepatoma: Hep3B and HepG2; human prostate cancer: PC3 and 1-LN; murine melanoma: B16F0 and B16F1). We investigated the effect of Escherichia coli subtilase cytoxin catalytic subunit (SubA) on GRP78. We report that SubA specifically cleaves cell-surface GRP78 on HepG2, 1-LN, and B16F1 cells without affecting intracellular GRP78. B16F0 cells (GRP78low) have lower amounts of cleaved cell-surface GRP78. SubA has no effect on Hep3B and PC3 cells. The predicted 28-kDa GRP78 COOH-terminal fragment is released into the culture medium by SubA treatment, and COOH-terminal domain signal transduction is abrogated, whereas pro-proliferative signaling mediated through NH2-terminal domain ligation is unaffected. These experiments clarify cell-surface GRP78 topology and demonstrate that the COOH-terminal domain is necessary for pro-apoptotic signal transduction occurring upon COOH-terminal antibody ligation. SubA is a powerful tool to specifically probe the functions of cell-surface GRP78.
Introduction
GRP78 is a well characterized molecular chaperone of the HSP70 family. It is present in the endoplasmic reticulum (ER)2 of all cell types, where it binds to nascent polypeptides and is responsible for sequestering these proteins until they can be properly folded and/or oligomerized. In a related role, GRP78 is important in the initiation of the unfolded protein response. An increase of unfolded proteins in the ER leads to the dissociation of GRP78 from the unfolded protein response mediators, PKR-like ER kinase (PERK), inositol-requiring enzyme 1 (IRE1), and activating transcription factor 6 (ATF6), thereby allowing these transcription factors to become active. The unfolded protein response ultimately acts to promote either survival or apoptotic pathways in response to ER stress. Normal cellular function is, therefore, reestablished by reducing intermediate protein aggregates, increasing protein folding, regulating Ca2+, and repressing translation (1). In addition to its role as a molecular chaperone in the ER, GRP78 is found in the cytoplasm, nucleus, and mitochondria, and it exists in secreted and plasma membrane-associated forms (2–6). At the plasma membrane, GRP78 acts as a signaling receptor for activated α2-macroglobulin (α2M*) (7, 8).
GRP78 at the cell surface is detected in multiple types of cancer cells both in vitro and in vivo and is usually not present on non-malignant cells (9, 10). Furthermore, the expression of GRP78 on the cell surface is associated with tumor progression, metastasis, and a poor prognosis (11). A recent report from our laboratory described the acceleration of murine melanoma growth by autoantibodies to GRP78 similar to those found in human cancer patients (12). The selective expression of GRP78 on multiple types of tumors as compared with normal tissues makes it a particularly enticing anticancer therapeutic target.
Cell-surface GRP78 responds differently to ligation depending on whether the ligand recognizes the NH2-terminal domain (NTD) or the COOH-terminal domain (CTD) of GRP78, both of which are located on the extracellular side of the cell membrane. Activated forms of the plasma proteinase inhibitor, α2M*, bind to the NTD of GRP78 and stimulate survival and proliferation in a number of cancer cell types (13, 14). The binding of α2M* to 1-LN prostate cancer cells promotes their proliferation in both a MAPK- and PI3K-dependent manner (15). Autoantibodies that recognize an epitope in the NTD of GRP78 often occur in prostate cancer (16), ovarian cancer (17), and melanoma (12) and are correlated with a poor prognosis. This epitope in the NTD of GRP78 is in the same ligand binding region that is bound by α2M*. In a manner antagonistic to the NTD signaling, exogenous CTD-reactive antibodies up-regulate p53 and promote apoptosis in prostate cancer cells (18).
The subtilase cytotoxin (SubAB) represents the fourth and most recently discovered family of AB5 toxins. It is produced by certain virulent strains of Shiga toxigenic Escherichia coli (STEC) and was first isolated from a strain of STEC that caused an outbreak of hemolytic uremic syndrome (HUS) in South Australia. The SubAB holotoxin is composed of a 35-kDa catalytic A subunit (SubA) and five 13-kDa B subunits (SubB). The A subunit contains the catalytic triad Asp, His, and Ser. Mutation of any of these three resides results in a catalytically inactive enzyme. Studies demonstrate that the serine protease activity is necessary for its cytotoxic effects. SubB mediates binding to glycan receptors on the cell surface and is necessary to trigger internalization and subsequent trafficking of the holotoxin to the ER (19). It is interesting to note that this process is clathrin-dependent and does not occur via lipid rafts (20). Notably, SubB binds preferentially to a non-human glycan, α2–3-linked N-glycolylneuraminic acid (Neu5Gc) (21). This glycan is not synthesized in humans; however, it is obtained through the ingestion of food derived from organisms that endogenously produce it.
The SubA serine proteinase displays extreme substrate specificity, and its only identified substrate is the ER chaperone, GRP78. SubA cleaves GRP78 between the amino acid residues Leu416 and Leu417. This cleavage site is located within the hinge region between the ATPase and COOH-terminal protein binding domains, and cleavage at this site leads to the production of a 28-kDa COOH-terminal fragment (22). Previous studies show that cleavage of ER GRP78 by SubAB leads to induction of the unfolded protein response through activation of PKR-like ER kinase (PERK), inositol-requiring enzyme 1 (IRE1), and activating transcription factor 6 (ATF6) (23–25). Additionally, treatment of cells with SubAB leads to apoptosis due to induction of the Bax/Bak-dependent apoptotic pathways (26).
In this study we report the novel observation that SubA specifically cleaves cell-surface GRP78. We used six different cells lines from three separate cancers (human hepatoma, human prostate cancer, and murine melanoma) for these studies. Two cell lines from each cancer type were chosen with one cell line expressing high levels of cell-surface GRP78 and the other expressing low levels of cell-surface GRP78. We show that in cells that highly express cell-surface GRP78, SubA treatment abrogates the effects of CTD-reactive antibodies to GRP78, whereas in cells that express little or no cell-surface GRP78, both SubA and antibody treatment have virtually no effect. Additionally, cleavage of the CTD of GRP78 by SubA has no effect on signaling initiated through the NTD, indicating that SubA treatment is not only specific to GRP78 but does not affect signaling pathways other than those triggered by CTD binding. The fact that this phenomenon was seen in all cell lines studied suggests that SubA can be used to investigate the functions of cell-surface GRP78 in a wide variety of cell types, and the fact that SubA treatment has no effect on cells that do not express cell-surface GRP78 demonstrates the specificity of this enzyme. Moreover, this exquisite substrate specificity of SubA for GRP78 suggests that it may be of great utility in targeting cancer cells.
EXPERIMENTAL PROCEDURES
Antibodies and Proteins
Anti-GRP78 N20 (catalog #SC-1050) and C20 (catalog #SC-1051) antibodies and the MTJ-1 antibody (catalog #SC-104898) were purchased from Santa Cruz Biotechnology (Santa Cruz, CA). Non-immune goat IgG was purchased from Sigma. α2M isolated from human plasma was used to prepare the receptor-recognized form (α2M-MeNH2) α2M*, as previously described (27). A recombinant murine cDNA expression construct encoding full-length recombinant GRP78 (rGRP78) with a His6 tag in pET15b was the kind gift of Dr Sylvie Blond. This rGRP78 was expressed and purified as previously described (28). SubAB, SubAA272B, SubA, and SubAA272 were purified as previously described (19, 22).
Cell Culture
HepG2, Hep3B, B16F0, B16F1, and PC3 cells were purchased from the American Type Culture Collection. 1-LN cells were a kind gift from Dr. Phillip Walther (Duke University Medical Center, Durham, NC). HepG2 and Hep3B cells were grown in minimum essential medium Eagle's (MEME) containing 10% FBS, 100 units/ml penicillin, 100 μg/ml streptomycin, 1 mm sodium pyruvate, and 1× nonessential amino acids. B16F1 and B16F0 cells were grown in Dulbecco's modified essential medium containing 10% FBS, 100 units/ml penicillin, and 100 μg/ml streptomycin. PC3 and 1LN cells were grown in RPMI 1640 medium containing 10% FBS, 100 units/ml penicillin, and 100 μg/ml streptomycin. All cells were maintained in a humidified 37 °C incubator at 5% CO2 in logarithmic growth in 75-cm2 flasks.
Cleavage of Cell-surface GRP78
All cells were grown to 90% confluence in the appropriate complete medium and then washed twice with PBS and placed in the appropriate serum-free medium for 8 h with 1 μg of SubAB, SubAA272B, SubA, or SubAA272 per 1 × 10⁶ cells. For the time course experiments, cells were seeded at 1 × 10⁶ in 6-well plates and allowed to grow for 24 h. The cells were washed once with the appropriate serum-free medium and treated with 1 μg of SubA or SubAA272 per 1 × 10⁶ cells for 24 h in the appropriate serum-free medium. Supernatants and cells were collected at 0, 1, 2, 4, 12, and 24 h.
Cell Surface Biotinylation
Cells were biotinylated using the Pierce cell surface protein isolation kit (Pierce) according to the manufacturer's instructions.
Western Blot Analysis
Cell culture supernatants from all cells that were treated with subtilase enzymes were collected and concentrated 10× in centrifugal filter units (Millipore, Billerica, MA). The cells were lysed in radioimmune precipitation assay buffer (50 mm Tris, 150 mm NaCl, 0.1% SDS, 0.5% sodium deoxycholate, and 1% Triton-X100) containing proteinase and phosphatase inhibitors (Halt Protease and Phosphatase Inhibitor Mixture, Pierce). The protein concentrations of all samples were quantified using a commercially available BCA kit (Bio-Rad). Ten μg of protein per sample was separated by SDS-PAGE and transferred to nitrocellulose. Membranes were probed with C20 antibody (0.2 mg/ml, diluted 1:500) followed by secondary anti-goat IgG antibody conjugated to an IR-700 nm label (Rockland, Gilbertsville, PA). The probed membranes were scanned on a Li-Cor Odyssey instrument (Li-Cor Biosciences, Lincoln, NE).
Microscopy
All cells were grown on chamber slides in complete medium overnight. The cells were washed once with complete medium and were then left untreated or treated with 1 μg of SubA or SubAA272 per 1 × 10⁶ cells for 8 h. The cells were washed with Hanks' balanced salt solution containing 1 mm CaCl2 and MgCl2 and were fixed for 30 min at room temperature in 1% fresh formaldehyde in PBS. The slides were then incubated in 5% nonfat milk in PBS for 90 min at room temperature. Excess blocking buffer was drained from the slide, and the cells were incubated with the primary goat anti-GRP78 C20 or anti-GRP78 N20 in 1% nonfat milk in PBS overnight at 4 °C. As a negative control, cells were incubated with non-immune goat IgG. The cells were then rinsed 3 times in PBST (PBS with 0.01% Tween 20) and incubated with a secondary antibody containing a 1:1000 dilution of Alexa Fluor 488-conjugated rabbit anti-goat IgG for 90 min at 4 °C in the dark. Finally, the cells were washed 3 times with PBST, and coverslips were then placed on the 1.0-mm-thick microscopy slides using ProLong Gold Antifade Reagent with DAPI (Invitrogen). The slides were dried and stored at −20 °C in the dark. Fluorescence microscopy was performed using a Zeiss Axio Observer fluorescence microscope with a Zeiss HBO arc lamp and power supply and a 100×/1.4 Ph3 Plan Apochromat oil immersion lens (Carl Zeiss).
Proliferation Assays
Cells in log-phase growth were seeded at 5 × 10³ cells per well and allowed to grow for 24 h in 96-well plates. They were washed once with the appropriate serum-free medium and were then left untreated or treated with 1 μg of SubA or SubAA272 per 1 × 10⁶ cells for 4 h. They were washed once with the appropriate serum-free media, and the medium was replaced with the appropriate complete medium or antibody preparation in serum-free medium supplemented with 1 μg of SubA or SubAA272 per 1 × 10⁶ cells. The cells were incubated overnight. The next morning 0.5 μCi [3H]thymidine was added to each well. Proliferation continued for 8 h until the media were removed, and the cells were dissociated in 10× trypsin-EDTA and harvested using a 12-channel micro-harvester (Skatron Instruments, Molecular Devices, Downington, PA). The samples were counted in a scintillation counter. All of the conditions were performed in quadruplicate, and the experiments were repeated at least twice.
Total Akt and Phospho-Akt Assays
Cells in log-phase growth were seeded at 5 × 10⁵ cells per well and allowed to grow for 24 h in 6-well plates. They were washed once with the appropriate serum-free medium and were then left untreated or treated with 1 μg/ml SubA or SubAA272 per 1 × 10⁶ cells for 8 h. The medium was replaced, and cells were treated with 100 pm α2M*, 10 μg/ml N20, 10 μg/ml C20, 10 μg/ml goat IgG, or left untreated for 15 min at 37 °C. Cells were then washed and lysed in radioimmune precipitation assay buffer containing 6 m urea and proteinase and phosphatase inhibitors on ice for 15 min. Cell lysates were analyzed for total Akt and phospho-Akt by ELISA according to the manufacturer's instructions (R&D Systems, Minneapolis, MN). All conditions were performed in triplicate and were repeated at least twice. For Ca2+ dependence assays, the experiments were performed as described above; however, before treatment with the stimuli, the cells were incubated with 10 μm BAPTA-AM (Invitrogen) for 1 h.
Apoptosis Assay
Cells in log-phase growth were seeded at 2 × 10⁴ cells per well and allowed to grow for 24 h in white-sided 96-well plates. They were washed once with the appropriate serum-free medium and were then left untreated or treated with 1 μg of SubA or SubAA272 per 1 × 10⁶ cells for 8 h. The media were replaced with the appropriate complete medium or antibody preparation supplemented with 1 μg of SubA or SubAA272 per 1 × 10⁶ cells. After 16 h, cells were assayed using the Caspase-Glo® 3/7 Assay System (Promega, Madison, WI) according to the manufacturer's instructions. The samples were counted on a luminometer, and all conditions were performed in quadruplicate and were repeated at least twice.
Flow Cytometry
Cells were seeded at 1 × 10⁶ per well in a 6-well plate and allowed to grow for 24 h. They were washed once with the appropriate complete medium and treated with 1 μg of SubA or SubAA272 per 1 × 10⁶ cells for 8 h in the appropriate complete medium. After 8 h, cells were scraped and resuspended at 1 × 10⁶/ml in Hanks' balanced salt solution with 0.5% BSA. Cells were stained with 5 μg per 1 × 10⁶ cells of anti-GRP78 C20, N20 (Santa Cruz Biotechnology) or non-immune goat IgG for 1 h at 4 °C. Cells were washed twice with PBS, and FITC-labeled secondary goat IgG antibody was added at a final concentration of 1 μg/106 cells for 30 min at 4 °C. We used 7-amino actinomycin D (BD Biosciences) according to the manufacturer's instructions for the exclusion of dead cells. Samples were analyzed on a Guava EasyCyte Plus (Millipore), and data were analyzed with FlowJo 7.5 (Ashland, OR). Experiments were performed at least three times.
Calcium Signaling Studies
Cells were seeded at 1 × 10⁴ cells per dish in glass-bottomed 35-mm Petri dishes and were allowed to grow overnight. The next day the cells were washed with complete medium and treated with 1 μg of SubA or SubAS272A per 1 × 10⁶ cells for 8 h in the appropriate complete medium. After 8 h, FURA-2/AM (Invitrogen) was added to the cells at a final concentration of 4 μm for 60 min at 37 °C in the dark. Human FcR Block (Miltenyi, Auburn, CA) was added for the final 10 min at 4 °C in the dark. Cells were washed twice with Hanks' balanced salt solution, and relative [Ca2+]i was subsequently measured using digital imaging microscopy as previously described (29). After obtaining base-line measurements, 10 μg of either anti-GRP78 N20 or C20 antibody or non-immune goat IgG was added, and multiple measurements were taken every 5 s over 10 min. [Ca2+]i of these cells in response to antibody treatment was indicated by the ratio of emitted fluorescence of cytoplasmic FURA-2/AM caused by alternating 340- and 380-nm light excitations (340 nm/380 nm). We collected data from 5–10 cells per high power microscope field, and experiments were repeated three times. The data were analyzed with SimplePCI 6 (Hamamatsu Corp., Serwickley, PA).
Statistical Analysis
All statistical analyses were performed with GraphPad Prism, Version 5.0 (GraphPad Software, Inc., La Jolla, CA).
RESULTS
SubA Cleaves rGRP78 with the Same Kinetics as SubAB
The holoenzyme SubAB cleaves both recombinant and endogenous GRP78 (22). SubA is the catalytic subunit and should, therefore, cleave rGRP78 in a manner analogous to that of the holoenzyme. Additionally, the catalytically inactive S272A mutant of SubA should not cleave GRP78. To test this, rGRP78 was subjected to cleavage by either SubA or SubAA272 at 1 μg/ml for up to 24 h. Untreated rGRP78 migrated at 75 kDa, and rGRP78 treated with SubAB and SubA showed the appearance of a 28- and a 48-kDa band and a decrease in the 75-kDa band starting as early as 5 min (Fig. 1, A and B). In contrast, the SubAA272 did not cleave rGRP78, even at 24 h (Fig. 1C).
FIGURE 1.
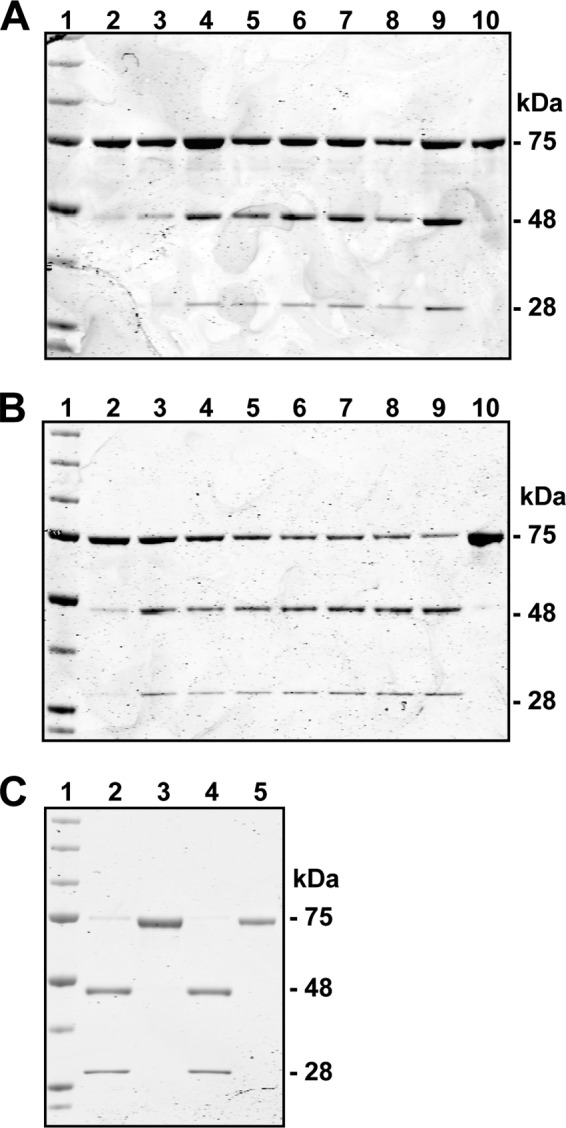
SubA cleaves rGRP78 with similar kinetics as SubAB. A–C, rGRP78 is cleaved by SubAB and SubA, but not SubAA272. A, SubAB lanes: 1, marker; 2, 1 min; 3, 5 min; 4, 10 min; 5, 20 min; 6, 30 min; 7, 40 min; 8, 50 min; 9, 60 min; 10, rGRP78. B, SubA lanes are the same as in panel A. C, shown is the 24-h time point after cleavage. Lanes: 1, marker; 2, SubAB; 3, SubAA272; 4, SubA; 5, rGRP78. These protein gels were stained with Coomassie Brilliant Blue.
SubA Cleaves Cell-surface GRP78 Specifically
SubA by itself cannot enter cells, because it is the B subunit that binds to its cognate glycan receptors on cells and triggers the internalization and subsequent intracellular trafficking of the holoenzyme (21). However, because SubA remains catalytically active without the B subunit, it should cleave cell-surface GRP78. We tested this hypothesis by treating six different cell lines with SubAB, SubAA272B, SubA, or SubAA272. For the following experiments, we utilized six different cells lines representing three different cancers, and for each cancer type, one cell line expressed high levels of cell-surface GRP78, and the other cell line expressed low or no cell-surface GRP78 (see “Flow cytometry”).3 The HepG2 and Hep3B cell lines are human hepatoma cell lines and express high and low levels of cell-surface GRP78, respectively. The 1-LN and PC3 cell lines are human prostate cancer cell lines and express high and almost undetectable levels of cell-surface GRP78, respectively. The highly metastatic 1-LN cell line is derived from the less metastatic PC3 cell line. B16F0 and B16F1 cells are murine melanoma cell lines and express high and low levels of cell-surface GRP78, respectively. The B16F1 cell line is derived from the B16F0 cell line. The cells were grown to confluency and then treated with 1 μg of enzyme per 1 × 10⁶ cells overnight at 37 °C. The concentrated cell culture supernatants were analyzed by Western blot for full-length GRP78 and fragments thereof. We show that the treatment of HepG2, 1-LN, B16F1, and to a much lesser extent, B16F0 cells, with SubAB and SubA, but not SubAA272B or SubAA272, leads to the accumulation of a 28-kDa species in the cell culture supernatant of these cells. This protein is identified as a fragment of GRP78 by immunoblotting with anti-GRP78 C20 antibody (Fig. 2A). PC3 and Hep3B cells express very low amounts of cell-surface GRP78, and the 28-kDa species was not detected in the cell culture supernatant. Although SubAB also cleaved cell-surface GRP78, the cells looked very unhealthy. All of the cell lines treated with SubAB were rounded in appearance and were becoming less adherent (data not shown), and this was most likely due to the cleavage of ER GRP78, which ultimately leads to cell death (22). However, the SubA-treated cells appeared similar to the untreated control cells (data not shown), indicating that treatment with this enzyme alone is not harmful to cells.
FIGURE 2.

SubAB and SubA cleave cell-surface GRP78 on HepG2, 1-LN, B16F1, and to a lesser extent, B16F0 cells. A, all cell lines were treated with 1 μg of enzyme per 1 × 10⁶ cells overnight at 37 °C. Cell culture supernatants were concentrated and resolved by SDS-PAGE. Proteins were transferred to nitrocellulose and probed with the anti-GRP78 C20 antibody. Lanes: 1, SubAB; 2, SubAA272B; 3, SubA; 4, SubAA272; 5, untreated control. Only lanes 1 and 3 for the HepG2, 1-LN, B16F0, and B16F1 cells show the appearance of a 28-kDa species. Hep3B and PC3 do not express cell-surface GRP78 to be cleaved. B, all cell lines were biotinylated, and the cell culture supernatants were treated as in panel A. Lanes: 1, untreated control; 2, SubA; 3, SubAA272. Only lane 2, the SubA-treated cells, shows the appearance of a 28-kDa species that is biotin-reactive for the HepG2, 1-LN, B16F0, and B16F1 cells. Hep3B and PC3 cells show no such band. C, the cell culture supernatants were again resolved by SDS-PAGE, transferred to nitrocellulose, and probed using the anti-GRP78 C20 antibody to demonstrate that the biotin reactive band is the 28-kDa GRP78-CTD. The lanes are the same as in panel B. Only lane 2, the SubA-treated cells, shows the appearance of a 28-kDa species that is C20-reactive for the HepG2, 1-LN, B16F0, and B16F1 cells. Hep3B and PC3 show no such band. D, all cell lines were treated with 1 μg of enzyme per 1 × 10⁶ cells for 24 h at 37 °C. Cell culture supernatants were collected at 0, 1, 2, 4, 12, and 24 h and concentrated and resolved by SDS-PAGE. Proteins were transferred to nitrocellulose and probed with C20 antibody. Lanes: 1, 0 h; 2, 1 h; 3, 2 h; 4, 4 h; 5, 12 h; 6, 24 h. Only the SubA-treated cells show the appearance of the 28-kDa cleavage product as early as 1 h for the HepG2 and 1-LN cells, 4 h for the B16F1 cells, and 12 h for the B16F0 cells. Hep3B and PC3 do not express cell-surface GRP78 to be cleaved. E, all cells from this experiment were harvested at the above indicated time points. The cells were lysed and analyzed for intracellular GRP78 expression by immunoblot to demonstrate that cleavage of cell-surface GRP78 does not change intracellular GRP78 expression levels. Lanes are the same as those described in panel A. There was no increase in intracellular GRP78 expression when all cell lines are treated with SubA or SubAA272. The band at 42 kDa is the reference protein, β-actin.
To ensure that the cleaved fragment of GRP78 was released from cell-surface GRP78, we biotinylated the surface of these cells using a cell-impermeable, cleavable biotinylation reagent that labels exposed primary amines on the cell surface (Pierce). After biotinylation, the cells were treated in the same manner as above. Again, cleavage of cells with SubA led to the accumulation of a 28-kDa species in the cell culture supernatant that interacted with both an anti-biotin antibody (Fig. 2B) and with the C20 antibody (Fig. 2C) for HepG2, 1-LN, B16F1, and to a much lesser extent, B16F0 cells. PC3 and Hep3B cells had no biotin-reactive or C20-reactive species in the cell culture supernatant because they have very little cell-surface GRP78. This confirms that the GRP78 cleavage product was a cleavage product of the GRP78 CTD at the cell surface and was not released from internal stores.
To investigate the kinetics of cell-surface GRP78 cleavage, we performed a time course experiment of GRP78 cleavage on the surface of all six cell lines. The cells were grown to confluency and then left untreated or treated with 1 μg of SubA or SubAA272 per 1 × 10⁶ cells for 0, 1, 2, 4, 12, and 24 h at 37 °C. Concentrated cell culture supernatants were analyzed for the 28-kDa fragment of GRP78. We show that SubA cleavage of cell-surface GRP78 is detectable as early as 1 h and continues for up to 24 h for cells that have detectable levels of cell-surface GRP78. SubAA272 does not cleave cell-surface GRP78 at any of the time points (Fig. 2D). Cells were also harvested and analyzed for intracellular GRP78 expression by immunoblotting with the C20 antibody. This was performed to ensure that enzymatic cleavage of cell-surface GRP78 did not affect intracellular GRP78 expression levels. None of the treatment groups in any of the cell lines showed an increase in intracellular GRP78 expression over time compared with the untreated control (Fig. 2E), indicating that cleavage of cell-surface GRP78 does not affect intracellular GRP78 levels.
Cleavage of Cell-surface GRP78 Reduces CTD Antibody Binding
To visually demonstrate that cell-surface GRP78 is cleaved, we analyzed untreated, SubA-treated, or SubAA272-treated cells by fluorescence microscopy. The cells were seeded on chamber slides and were treated with 1 μg of SubA or SubAA272 per 1 × 10⁶ cells or left untreated. Unpermeabilized, fixed cells were then stained with the anti-GRP78 C20 antibody and were visualized by fluorescence microscopy. We demonstrate that the cleavage by SubA of cell-surface GRP78 on HepG2, 1-LN, B16F1, and to a much lesser extent, B16F0 cells, completely abolishes the fluorescent signal when stained with anti-GRP78 C20 (Fig. 3). The SubAA272-treated cells were stained similarly to the untreated control cells. PC3 and Hep3B cells did not have a detectable GRP78 immunofluorescence signal when stained with anti-GRP78 C20 antibody because these cells do not express cell-surface GRP78. In contrast, anti-GRP78 N20 staining was unaffected by cell-surface GRP78 cleavage for all cell lines (supplemental Fig. 1 shows the controls for this experiment).
FIGURE 3.

Cleavage of cell-surface GRP78 by SubA is detectable by immunofluorescence microscopy. All cell lines were left untreated or treated with 1 μg/ml SubA or SubAA272 per 1 × 10⁶ cells for 8 h at 37 °C before staining with anti-GRP78 C20 antibody and visualization via fluorescence microscopy. Untreated HepG2, 1-LN, B16F1, and to a lesser extent, B16F0 cells show GRP78 staining over the entire cell-surface. Hep3B and PC3 express negligible cell-surface GRP78, and no immunofluorescence signal is detected in these cell lines. SubA-treated HepG2, 1-LN, B16F1, and more faintly, B16F0 cells, show a significant reduction in cell-surface GRP78 staining compared with untreated and SubAA272-treated cells. SubAA272-treated cells show a similar staining pattern to that seen in the untreated control cells.
Cell-surface GRP78 Cleavage Is Detectable by Flow Cytometry
Cell-surface GRP78 is easily detectable by flow cytometry using both NTD- and CTD-reactive antibodies (12). Therefore, cleavage of cell-surface GRP78 by SubA should at least diminish the signal obtained by staining with C20 antibody, if not fully abolish it. In contrast, the signal obtained by staining with the N20 antibody should not be affected unless cleavage of the CTD induces a conformational change that affects NTD antibody binding.
To test this hypothesis, we stained all six cell lines treated with the various subtilase enzymes with N20, C20, or non-immune goat IgG for analysis by flow cytometry. We show that treatment of cells with SubA, but not SubAA272, reduces the GRP78 signal when stained with the C20 antibody for cell lines that express cell-surface GRP78 (Fig. 4 and Table 1); however, the signal is unchanged when stained with N20 antibody (supplemental Table 1 shows the controls for this experiment). This indicates that cleavage of the CTD of GRP78 is detectable through loss of signal by flow cytometry and that this cleavage does not induce a conformational change in the NTD of the protein.
FIGURE 4.

Cleavage of cell-surface GRP78 is detectable by flow cytometry. A–F, all cell lines were left untreated or were treated with 1 μg of SubA or SubAA272 per 1 × 10⁶ cells for 8 h at 37 °C before staining with the anti-GRP78 C20 antibody and subsequent flow cytometric analysis. SubA cleavage of cell-surface GRP78 is detectable by flow cytometry for HepG2 (B), 1-LN (D), B16F1 (F), and to a much lesser extent Hep3B (A) and B16F0 (E) cells when stained with the anti-GRP78 C20 antibody. PC3 cells were not stained with this antibody (C). SubAA272-treated cells are stained similarly to the untreated control cells.
TABLE 1.
Flow cytometry analysis of enzyme-treated and -untreated cell lines
Values are the mean fluorescence intensity (MFI) of cell-surface GRP78 staining.
| Cell line | C20 |
||
|---|---|---|---|
| Untreated | SubA | SubA272 | |
| MFI | |||
| Hep3B | 8.46 | 4.09 | 8.3 |
| HepG2 | 18.26 | 7.92 | 18.56 |
| PC3 | 4.22 | 4.55 | 4.27 |
| 1-LN | 24.52 | 8.71 | 27.98 |
| B16F0 | 7.26 | 3.08 | 9.62 |
| B16F1 | 23.77 | 5.99 | 22.48 |
To determine whether enzyme treatment leads to increased cell death, we also stained the cells with 7-amino actinomycin D, which does not pass through intact cell membranes. Our analyses indicate that treatment with 1 μg of SubA or SubAA272 per 1 × 10⁶ cells for 8 h does not significantly affect cell viability (Table 2 and supplemental Table 2 shows the controls for this experiment).
TABLE 2.
Cell viability of enzyme treated and untreated cells
Values are the percent live cells as determined by flow cytometric analysis of 7-amino actinomycin D exclusion.
| Cell line | C20 |
||
|---|---|---|---|
| Untreated | SubA | SubA272 | |
| % Live cells | |||
| Hep3B | 85.77 | 83.36 | 73.87 |
| HepG2 | 87.73 | 88.26 | 87.06 |
| PC3 | 80.71 | 83.62 | 80.14 |
| 1-LN | 83.71 | 84.79 | 78.61 |
| B16F0 | 80.86 | 78.86 | 73.98 |
| B16F1 | 85.13 | 83.91 | 86.36 |
Cell-surface GRP78 Cleavage Abrogates CTD Antibody-induced Proliferation Inhibition
We have shown in DU145 and 1-LN prostate cancer cell lines that anti-CTD antibodies to GRP78 inhibit proliferation as measured by [3H]thymidine uptake (18). In this study we cleaved cell-surface GRP78 with SubA and determined whether cell proliferation was affected when treated with the C20 or N20 antibody. Untreated cells and SubAA272-treated cells demonstrated a dose-dependent inhibition of proliferation when treated with 0.1, 1.0, and 10.0 μg/ml of C20 (supplemental Table 3). However, the SubA-treated cells did not show any inhibition of proliferation, and this effect was significant compared with both the untreated and SubAA272-treated cells, and the untreated and SubAA272-treated cells were not significantly different from each other (Fig. 5 and Table 3). Treatment with N20 antibody after SubA cleavage increased proliferation in a manner similar to that of the untreated and SubAA272-treated cells. The goat IgG control did not affect proliferation in any of the treatment groups. Overall, the results of these experiments demonstrate that proliferation induced by the N20 antibody is not affected by SubA cleavage of the GRP78 CTD. However, SubA cleavage does abrogate the inhibition of proliferation caused by the C20 antibody in the cell lines that express cell-surface GRP78.
FIGURE 5.

Cleavage of cell-surface GRP78 by SubA inhibits cell death induced by the CTD antibody but does not affect proliferation induced by the NTD antibody. A–F, all cell lines were left untreated or were treated with 1 μg of SubA or SubAA272 per 1 × 10⁶ cells before treatment with the appropriate antibody and subsequent tritiated thymidine uptake assay. Samples: 1, 10 μg/ml N20; 2, 10 μg/ml C20; 3, 10 μg/ml goat IgG; 4, untreated; 5, 100 pm α2M*; 6, 1 μm STS. A and C, Hep3B and PC3 cells are not significantly affected by either anti-GRP78 C20 or N20 antibody treatment because they express little-to-no cell-surface GRP78. B, D, E, and F, HepG2, 1-LN, B16F1, and to a lesser extent B16F0 cells significantly proliferate in response to the anti-GRP78 N20 antibody. Treatment of these cell lines with the anti-GRP78 C20 antibody results in a significant inhibition of proliferation. For the SubA-treated HepG2, 1-LN, B16F1, and to a lesser extent B16F0 cells, this inhibition of proliferation was abrogated; however, the response to the anti-GRP78 N20 antibody was unchanged. SubA272-treated cells respond similarly to the untreated control cells for all cell lines. α2M* (100 pm) is the positive, proliferative control for cell lines that express cell-surface GRP78, and STS (1 μm) is the cell death control for all cell lines. Values are the mean cpm ± S.E. The means were compared in a two-way ANOVA with a Bonferroni post-test. The post-tests compared the means to the mean goat IgG value for each cell line and concentration within each enzyme treatment group. ***, p < 0.001; **, p < 0.01; *, p < 0.05.
TABLE 3.
Proliferation of enzyme-treated and -untreated cell lines in response to antibody stimulation
Values are the mean cpm ± S.E. The means were compared in a two-way ANOVA with a Bonferroni post-test. The post-test compared the means to the mean goat IgG value for each cell line and concentration with each enzyme treatment group. ***, p < 0.001; **, p < 0.01; *, p < 0.05.
| Antibody | Human hepatoma |
Human prostate cancer |
Murine melanoma |
|||
|---|---|---|---|---|---|---|
| Hep3B | HepG2 | PC3 | 1-LN | B16F0 | B16F1 | |
| cpm ± S.E | cpm ± S.E | cpm ± S.E | ||||
| Untreated control | ||||||
| C20, 10 μg/ml | 1,469 ± 131 | 2,219 ± 719* | 7,648 ± 173 | 1,974 ± 204*** | 12,082 ± 637* | 13,821 ± 1,994*** |
| N20, 10 μg/ml | 1,705 ± 220 | 40,658 ± 2,412*** | 8,319 ± 1,079 | 79,159 ± 3,579*** | 25,118 ± 1,309* | 106,814 ± 1,926*** |
| Goat IgG, 10 μg/ml | 1,963 ± 592 | 16,325 ± 2,057 | 7,928 ± 564 | 15,576 ± 1,753 | 18,400 ± 1,683 | 60,113 ± 1,665 |
| STS, 1 μm | 336 ± 74 | 297 ± 105 | 178 ± 20 | 322 ± 30 | 473 ± 80 | 7,910 ± 752 |
| α2M*, 100 pm | 2,893 ± 479 | 335,226 ± 1,860 | 7,993 ± 752 | 46,131 ± 3,953 | 31,437 ± 3,091 | 110,372 ± 4,397 |
| Medium only | 2,740 ± 253 | 21,913 ± 2,780 | 8,281 ± 981 | 12,851 ± 3,351 | 22,080 ± 310 | 63,322 ± 6,478 |
| SubA-treated | ||||||
| C20, 10 μg/ml | 1,726 ± 138 | 15,341 ± 934 | 7,465 ± 286 | 19,975 ± 717 | 14,818 ± 924 | 55,242 ± 675 |
| N20, 10 μg/ml | 2,032 ± 317 | 36,690 ± 2,410*** | 8,888 ± 1,856 | 76,679 ± 5,225*** | 21,732 ± 650* | 100,152 ± 2,926*** |
| Goat IgG, 10 μg/ml | 1,785 ± 81 | 19,639 ± 1,418 | 7,425 ± 416 | 17,140 ± 2,860 | 16,466 ± 2,878 | 62,408 ± 2,855 |
| STS, 1 μm | 238 ± 62 | 232 ± 39 | 181 ± 22 | 427 ± 35 | 131 ± 14 | 5,142 ± 215 |
| α2M*, 100 pm | 2,930 ± 266 | 34,443 ± 3246 | 9,595 ± 1,320 | 40,076 ± 1,895 | 28,426 ± 2,410 | 101,423 ± 1,294 |
| Medium only | 3,355 ± 674 | 19,850 ± 925 | 9,341 ± 2657 | 15,310 ± 2,248 | 22,604 ± 1,266 | 65,179 ± 1,069 |
| SubA272-treated | ||||||
| C20, 10 | 1,456 ± 159 | 1,985 ± 232*** | 7,620 ± 543 | 2,024 ± 265*** | 10,083 ± 720** | 18,980 ± 1,617*** |
| N20, 10 | 2,683 ± 431 | 34,006 ± 2,511*** | 8,809 ± 1,214 | 89,648 ± 2,754*** | 25,764 ± 975** | 92,411 ± 1,740*** |
| Goat IgG 10, | 2,128 ± 551 | 13,884 ± 1,509 | 7,069 ± 1,699 | 16,994 ± 234 | 17,622 ± 1,746 | 68327 ± 9,434 |
| STS, 1 μm | 593 ± 58 | 412 ± 96 | 294 ± 7 | 383 ± 33 | 575 ± 82 | 5,465 ± 1,092 |
| α2M*, 100 pm | 2,696 ± 268 | 35,337 ± 5737 | 8,259 ± 445 | 47,302 ± 723 | 29,253 ± 2,428 | 95,889 ± 1,546 |
| Medium only | 3,131 ± 464 | 17,982 ± 2,418 | 8,270 ± 1,477 | 18,619 ± 4,991 | 20,761 ± 1,229 | 61,291 ± 4,422 |
We have previously shown that phosphorylation of Akt is a necessary signaling step in the proliferation pathway that is activated by ligation of the NTD of GRP78 (15). For this study, where we specifically investigate CTD signaling and the effects of SubA on these events, Akt phosphorylation is not directly relevant because Akt is phosphorylated in response to ligation of the NTD of GRP78. However, to ensure that CTD cleavage of cell-surface GRP78 does not affect Akt phosphorylation triggered by NTD ligation, we analyzed untreated, SubA-treated, and SubAA272-treated cells for both total Akt and phospho-Akt levels. Cells were treated with 1 μg of enzyme per 1 × 10⁶ cells for 8 h followed by stimulation with 100 pm α2M*, 1 μm staurosporine (STS), 10 μg/ml N20, 10 μg/ml C20, 10 μg/ml goat IgG, or left untreated for 15 min at 37 °C. Cells lysates were analyzed by total and phospho-Akt ELISA and show that in all treatment groups Akt is phosphorylated to a similar degree when stimulated with α2M* or N20, whereas stimulation with C20 or goat IgG does not lead to increases in Akt phosphorylation for cell lines that express cell-surface GRP78 (Fig. 6 and Table 4). These results are consistent with previous results from our laboratory (30) and indicate that cleavage of the GRP78 CTD does not affect the NTD and that the signaling components associated with the NTD remain intact.
FIGURE 6.

Cleavage of cell-surface GRP78 by SubA does not affect Akt phosphorylation. A–F, all cell lines were left untreated or were treated with 1 μg of SubA or SubAA272 per 1 × 10⁶ cells before treatment with the appropriate antibody and subsequent phospho-Akt and total Akt ELISAs. Samples: 1, untreated; 2, 100 pm α2M*; 3, 1 μm STS; 4, 10 μg/ml N20; 5, 10 μg/ml C20; 6, 10 μg/ml goat IgG. A and C, Hep3B and PC3 cells do not phosphorylate Akt in response to anti-GRP78 N20 antibody treatment. They also do not respond to anti-GRP78 C20 antibody treatment because they express little-to-no cell-surface GRP78. B, D, E, and F, HepG2, 1-LN, B16F1, and to a much lesser extent B16F0 cells significantly phosphorylate Akt in response to the anti-GRP78 N20 antibody. Treatment of these cell lines with the anti-GRP78 C20 antibody has no effect on the Akt phosphorylation state. For the SubA-treated HepG2, 1-LN, B16F1, and B16F0 cells, phospho-Akt increases in response to the anti-GRP78 N20 antibody are unchanged. SubA272-treated cells respond similarly to the untreated control cells for all cell lines. α2M* (100 pm) is the positive signaling control for cell lines that express cell-surface GRP78, and STS (1 μm) is the cell death control for all cell lines. Values are the mean ratio of phospho-Akt/total Akt ± S.E. The means were compared in a two-way ANOVA with Bonferroni post-tests. The post-test compared the means to the mean goat IgG value for each cell line and concentration within each enzyme treatment group. ***, p < 0.001; **, p < 0.01; *, p < 0.05.
TABLE 4.
Akt activation of enzyme treated and untreated cell lines in response to antibody stimulation
Values are the mean ratio of phospho-Akt/total Akt ± S.E (pAkt/total Akt ± S.E). The means were compared in a two-way ANOVA with a Bonferroni post-test. The post-test compared the means to the mean goat IgG value for each cell line and concentration within each enzyme treatment group. ***, p < 0.001; **p < 0.01; *, p < 0.05.
| Antibody | Human hepatoma |
Human prostate cancer |
Murine melanoma |
|||
|---|---|---|---|---|---|---|
| Hep3B | HepG2 | PC3 | 1-LN | B16F0 | B16F1 | |
| pAkt/total Akt ± S.E | pAkt/total Akt ± S.E | pAkt/total Akt ± S.E | ||||
| Untreated control | ||||||
| C20, 10 μg/ml | 1.126 ± 0.110 | 0.223 ± 0.035 | 3.122 ± 0.447 | 0.553 ± 0.058 | 0.095 ± 0.020 | 0.216 ± 0.044 |
| N20, 10 μg/ml | 1.219 ± 0.088 | 0.521 ± 0.030*** | 2.853 ± 0.487 | 1.407 ± 0.067*** | 0.153 ± 0.003 | 0.619 ± 0.044*** |
| Goat IgG 10, μg/ml | 1.013 ± 0.088 | 0.157 ± 0.005 | 3.122 ± 0.557 | 0.338 ± 0.067 | 0.123 ± 0.003 | 0.183 ± 0.027 |
| STS, 1 μm | 1.071 ± 0.022 | 0.194 ± 0.025 | 1.034 ± 0.025 | 0.665 ± 0.047 | 0.087 ± 0.003 | 0.204 ± 0.051 |
| α2M*, 100 pm | 1.012 ± 0.034 | 0.396 ± 0.048 | 2.359 ± 0.127 | 1.48 ± 0.233 | 0.157 ± 0.011 | 0.591 ± 0.043 |
| Medium only | 1.109 ± 0.125 | 0.116 ± 0.010 | 2.744 ± 0.594 | 0.498 ± 0.035 | 0.104 ± 0.021 | 0.21 ± 0.024 |
| SubA-treated | ||||||
| C20, 10 μg/ml | 0.930 ± 0.047 | 0.176 ± 0.025 | 2.605 ± 0.050 | 0.606 ± 0.093 | 0.128 ± 0.004 | 0.190 ± 0.017 |
| N20, 10 μg/ml | 1.020 ± 0.030 | 0.505 ± 0.014*** | 3.214 ± 0.167 | 1.477 ± 0.260*** | 0.156 ± 0.004* | 0.630 ± 0.059*** |
| Goat IgG, 10 μg/ml | 0.898 ± 0.039 | 0.193 ± 0.010 | 2.570 ± 0.396 | 0.665 ± 0.096 | 0.123 ± 0.004 | 0.233 ± 0.019 |
| STS, 1 μm | 0.862 ± 0.071 | 0.142 ± 0.027 | 2.235 ± 0.277 | 0.453 ± 0.050 | 0.132 ± 0.005 | 0.264 ± 0.030 |
| α2M*, 100 pm | 0.915 ± 0.022 | 0.441 ± 0.061 | 3.002 ± 0.236 | 1.098 ± 0.247 | 0.213 ± 0.007 | 0.544 ± 0.030 |
| Medium only | 0.932 ± 0.089 | 0.135 ± 0.015 | 2.705 ± 0.485 | 0.491 ± 0.046 | 0.146 ± 0.015 | 0.229 ± 0.026 |
| SubA272-treated | ||||||
| C20, 10 μg/ml | 1.068 ± 0.031 | 0.296 ± 0.046 | 2.625 ± 0.262 | 0.509 ± 0.066 | 0.101 ± 0.006 | 0.322 ± 0.30 |
| N20, 10 μg/ml | 1.099 ± 0.076 | 0.623 ± 0.016*** | 2.982 ± 0.534 | 1.537 ± 0.050*** | 0.150 ± 0.007 | 0.577 ± 0.078*** |
| Goat IgG, 10 μg/ml | 0.933 ± 0.028 | 0.243 ± 0.036 | 2.601 ± 0.085 | 0.729 ± 0.072 | 0.121 ± 0.013 | 0.207 ± 0.054 |
| STS, 1 μm | 0.967 ± 0.097 | 0.194 ± 0.023 | 1.475 ± 0.214 | 0.287 ± 0.035 | 0.087 ± 0.001 | 0.271 ± 0.041 |
| α2M*, 100 pm | 1.162 ± 0.072 | 0.407 ± 0.047 | 2.673 ± 0.423 | 1.136 ± 0.075 | 0.176 ± 0.038 | 0.587 ± 0.046 |
| Medium only | 1.094 ± 0.101 | 0.114 ± 0.010 | 3.043 ± 0.470 | 0.312 ± 0.037 | 0.124 ± 0.007 | 0.302 ± 0.023 |
SubA Cleavage of Cell-surface GRP78 Abrogates Caspase 3/7 Activation
In addition to testing for inhibition of proliferation, we directly tested the ability of CTD antibodies to cause apoptosis as measured by activation of the effector caspases 3/7. For the HepG2, 1-LN, B16F1, and to a lesser extent, B16F0 cells, the untreated and SubAA272-treated cells showed caspase 3/7 activation when treated with 0.1, 1.0, or 10.0 μg/ml of C20 antibody (supplemental Table 4). However at the highest concentration of C20, the SubA-treated cells from these cell lines showed significantly less caspase 3/7 activation compared with the other two treatment groups (Fig. 7 and Table 5). This suggests that the CTD of GRP78 is indeed responsible for transducing the apoptotic signal initiated by ligation with the CTD-reactive antibody, C20. Treatment with N20 produced similar results for all three treatment groups. For the PC3 and Hep3B cell lines, both enzyme and antibody treatment had no effect on caspase 3/7 activation. The positive control, STS, activated caspase 3/7 to a similar degree in all treatment groups.
FIGURE 7.

Cleavage of cell-surface GRP78 by SubA abrogates apoptosis caused by the anti-GRP78 CTD antibody. A–F, all cell lines were left untreated or were treated with 1 μg of SubA or SubAA272 per 1 × 10⁶ cells before treatment with the appropriate antibody and subsequent caspase 3/7 activation assay. Samples: 1, 10 μg/ml N20; 2, 10 μg/ml C20; 3, 10 μg/ml goat IgG; 4, untreated; 5, 100 pm α2M*; 6, 1 μm STS. A and C, Hep3B and PC3 cells do not activate caspase 3/7 in response to any treatment except the control, STS, because they express little-to-no cell-surface GRP78. B, D, E, and F, HepG2, 1-LN, B16F1, and to a lesser extent B16F0 cells activate caspase 3/7 in response to the anti-GRP78 C20 antibody. SubA treatment of these cell lines abrogates this response. SubA272-treated cells respond similarly to the control untreated cells. STS (1 μm) is the cell death control for all cell lines. Values are the mean relative light units (RLU) ± S.E. The means were compared in a two-way ANOVA with Bonferroni post-tests. The post-tests compared the means of the N20- and C20-treated groups to the mean goat IgG value for each cell line and concentration within each enzyme treatment group. ***, p < 0.001; **, p < 0.01; *, p < 0.05. The SubA-treated cells were also compared with the untreated control and SubA272-treated cells for each cell line using the above analysis method.
TABLE 5.
Caspase 3/7 activation of enzyme treated and untreated cell lines in response to antibody stimulation
Values are the mean relative light units (RLU) ± S.E. The means were compared in a two-way ANOVA with a Bonferroni post-test. The post-test compared the means of the N20- and C20-treated groups to the mean goat IgG value for each cell line and concentration within each enzyme treatment group. ***, p < 0.001; **, p < 0.01; *, p < 0.05. The SubA-treated cells were also compared to the untreated control and SubA272-treated cells using the above analysis method.
| Antibody | Human hepatoma |
Human prostate cancer |
Murine melanoma |
|||
|---|---|---|---|---|---|---|
| Hep3B | HepG2 | PC3 | 1-LN | B16F0 | B16F1 | |
| RLU | RLU | RLU | ||||
| Untreated control | ||||||
| C20, 10 μg/ml | 30.1 ± 1.6 | 30.1 ± 1.6*** | 32.4 ± 2.9 | 143.0 ± 2.0***a | 53.4 ± 5.7*** | 253.6 ± 19.0***a |
| N20, 10 μg/ml | 33.9 ± 2.1 | 32.0 ± 3.6 | 34.5 ± 1.7 | 44.3 ± 1.5 | 18.5 ± 1.2 | 38.5 ± 5.4 |
| Goat IgG, 10 μg/ml | 29.3 ± 1.3 | 29.3 ± 1.3 | 34.2 ± 1.2 | 44.5 ± 2.3 | 22.6 ± 1.7 | 48.1 ± 5.3 |
| STS, 1 μm | 463.2 ± 7.1 | 351.7 ± 7.3 | 106 ± 38.9 | 118.0 ± 4.1 | 344.9 ± 19.9 | 531.5 ± 63.4 |
| α2M*, 100 pm | 33.8 ± 3.6 | 31.9 ± 3.6 | 38.1 ± 2.6 | 54.0 ± 5.3 | 28.9 ± 4.3 | 52.7 ± 3.4 |
| Medium only | 31.3 ± 1.9 | 17.5 ± 2.2 | 38.9 ± 1.0 | 43.7 ± 1.8 | 24.7 ± 2.3 | 42.7 ± 4.7 |
| SubA-treated | ||||||
| C20, 10 | 42.1 ± 1.1 | 33.9 ± 1.8 | 27.1 ± 1.7 | 68.7 1.3** | 43.1 ± 0.6 | 37.1 ± 3.2 |
| N20, 10 μg/ml | 34.6 ± 1.0 | 24.6 ± 1.1 | 28.4 ± 0.6 | 46.2 ± 2.3 | 44.4 ± 1.5 | 34.4 ± 4.3 |
| Goat IgG, 10 μg/ml | 40.9 ± 2.1 | 30.9 ± 2.3 | 25.8 ± 1.4 | 36.1 ± 5.7 | 34.0 ± 2.4 | 70.8 ± 3.6 |
| STS, 1 μm | 308.0 ± 8.0 | 309.5 ± 6.5 | 119.9 ± 2.3 | 174.7 ± 14.0 | 392.1 ± 19.7 | 328.8 ± 8.5 |
| α2M*, 100 pm | 30.4 ± 1.6 | 27.3 ± 2.1 | 38.4 ± 1.6 | 49.8 ± 1.9 | 45.3 ± 1.2 | 36.2 ± 1.9 |
| Medium only | 31.2 ± 3.0 | 29.9 ± 2.0 | 29.8 ± 1.2 | 36.5 ± 1.4 | 41.0 ± 109 | 41.8 ± 7.4 |
| SubA272-treated | ||||||
| C20, 10 μg/ml | 21.77 ± 1.3 | 157.7 ± 6.1*** | 20.2 ± 1.0 | 109.3 ± 3.6***b | 52.7 ± 4.2*** | 212.7 ± 5.9***a |
| N20, 10 μg/ml | 22.9 ± 2.1 | 30.0 ± 5.1 | 19.9 ± 0.9 | 27.9 ± 1.7 | 29.1 ± 1.4 | 41.6 ± 1.4 |
| Goat IgG, 10 μg/ml | 21.5 ± 1.8 | 37.0 ± 1.5 | 19.3 ± 0.9 | 26.6 ± 3.2 | 33.5 ± 1.8 | 38.0 ± 2.4 |
| STS, 1 μm | 331.2 ± 13.4 | 240.9 ± 2.1 | 153.0 ± 15.2 | 119.4 ± 37.5 | 316.2 ± 13.0 | 383.9 ± 11.0 |
| α2M*, 100 pm | 28.9 ± 2.2 | 27.5 ± 1.7 | 37.3 ± 1.1 | 30.2 ± 4.6 | 26.6 ± 2.8 | 40.8 ± 2.3 |
| Medium only | 24.7 ± 2.7 | 28.2 ± 5.4 | 20.4 ± 1.0 | 14.1 ± 2.0 | 28.8 ± 5.2 | 42.6 ± 1.6 |
a p < 0.001.
b p < 0.01.
SubA Cleavage of Cell-surface GRP78 Abolishes the Ca2+ Signal Induced by the CTD Antibody
Previous work in our laboratory has shown that binding of α2M*, NTD antibodies, and CTD antibodies cause the release of Ca2+ from intracellular stores (31). Here, we show that cleavage by SubA abrogates the Ca2+ signaling induced by the CTD antibody C20 as compared with both the untreated and SubAA272-treated for HepG2 and 1-LN cells (Fig. 8 and Table 6). The untreated and SubAA272-treated cells were not significantly different from each other. Similar to both the proliferation and apoptosis data, the signal induced by treatment with N20 is not affected by SubA treatment and is proportional to that of the untreated and SubAA272-treated cells (supplemental Table 5 shows the controls for this experiment). Again, this suggests that the cleavage of the CTD of GRP78 does not affect functions of the NTD of GRP78. For Hep3B cells, there was a very slight increase in Ca2+ signal observed with both the N20 and C20 antibodies (Fig. 8, Table 6, and supplemental Table 5); however, this effect was not significant and was most likely due to the fact that Hep3B cells express a very low copy number of cell-surface GRP78. For the PC3 cells, there was no Ca2+ signal with either the N20 or C20 antibody, and this is because PC3 cells do not express cell-surface GRP78 (Fig. 8, Table 6, and supplemental Table 5). Notably, we observed that treatment with N20 or C20 induced no Ca2+ signal in both B16F0 and B16F1 cells (Fig. 8, Table 6 and supplemental Table 5); however, both cell lines induce Akt phosphorylation when stimulated with the N20 antibody and α2M*, suggesting that in these cell lines, Akt phosphorylation is Ca2+-independent. To test this hypothesis, we repeated the Akt phosphorylation studies using BAPTA-AM, a cell-permeable Ca2+ chelator. We treated the cells as described previously, except that we incubated the cells with 10 μm BAPTA-AM for 1 h before stimulation with the antibodies or α2M*. We show that even in the absence of Ca2+, Akt is phosphorylated in response to N20 and α2M* stimulation (Fig. 9 and Table 7). These results indicate that in B16F0 and B16F1 cells, Akt phosphorylation in response to NTD ligation by α2M* and the N20 antibody is Ca2+-independent.
FIGURE 8.

Cleavage of cell-surface GRP78 by SubA abolishes the intracellular calcium release induced by the anti-GRP78 CTD antibody A, B, C, D, E, and F. All cell lines were left untreated or were treated with 1 μg of SubA or SubAS272A per 1 × 10⁶ cells before treatment with the appropriate antibody and subsequent Ca2+ imaging assay. A and C, Hep3B (A) and PC3 (C) cells do not release intracellular Ca2+ in response to the anti-GRP78 C20 antibody because they express little-to-no cell-surface GRP78. B and D, HepG2 (B) and 1-LN (D) cells release Ca2+ from intracellular stores when stimulated with the anti-GRP78 C20 antibody, and this response is completely abolished when these cell lines are treated with SubA. SubAS272A-treated cells respond similarly to the untreated controls. E and F, the murine melanoma cell lines B16F0 (E) and B16F1 (F) do not release Ca2+ upon anti-GRP78 C20 stimulation even though these cell lines respond to this antibody as demonstrated by caspase 3/7 activation and inhibition of proliferation.
TABLE 6.
Ca2+ signaling in enzyme-treated and -untreated cell lines in response to antibody stimulation
Values are the mean area under the curve (AUC).
| Antibody | Human hepatoma |
Human prostate cancer |
Murine melanoma |
|||
|---|---|---|---|---|---|---|
| Hep3B | HepG2 | PC3 | 1-LN | B16F0 | B16F1 | |
| AUC | AUC | AUC | ||||
| Untreated, control, C20, 10 μg/ml | 3.93 | 18.07 | 0 | 14.0 | 0 | 0 |
| SubA-treated C20, 10 μg/ml | 0 | 0 | 0 | 3.52 | 0 | 0 |
| SubA272-treated C20, 10 μg/ml | 0 | 18.3 | 0 | 23.15 | 0 | 0 |
FIGURE 9.

Akt phosphorylation is independent of calcium in B16F0 and B16F1 cell lines. A and B, both cell lines were left untreated or were treated with 1 μg of SubA or SubAA272 per 1 × 10⁶ cells before treatment with the cell-permeable Ca2+ chelator, BAPTA-AM, the appropriate antibody, and subsequent phospho-Akt and total Akt ELISAs. Samples: 1, untreated; 2, 100 pm α2M*; 3, 1 μm STS; 4, 10 μg/ml N20; 5, 10 μg/ml C20; 6, 10 μg/ml goat IgG. A and B, B16F1 and to a much lesser extent B16F0 cells significantly phosphorylate Akt in response to the anti-GRP78 N20 antibody. Treatment of these cell lines with the anti-GRP78 C20 antibody has no effect on the Akt phosphorylation state. For the SubA-treated B16F1 and B16F0 cells, phospho-Akt levels are unchanged in response to the anti-GRP78 N20 antibody. SubA272-treated cells respond similarly to the untreated control cells for all cell lines. α2M* (100 pm) is the positive signaling control for cell lines that express cell-surface GRP78, and STS (1 μm) is the cell death control for all cell lines. Values are the mean ratio of phospho-Akt/total Akt ± S.E. The means were compared in a two-way ANOVA with Bonferroni post-tests. The post-tests compared the means to the mean goat IgG value for each cell line and concentration within each enzyme treatment group. ***, p < 0.001; *, p < 0.05.
TABLE 7.
Akt activation of enzyme-treated and -untreated murine melanoma cell lines in response to antibody stimulation in the presence of the cell-permeable Ca2+ chelator, BAPTA-AM
Values are the mean ratio of phospho-Akt/total Akt ± S.E (pAkt/total Akt ± S.E). The means were compared in a two-way ANOVA with a Bonferroni post-test. The post-test compared the means to the mean goat IgG value for each cell line and concentration within each enzyme treatment group. ***, p < 0.001; *, p < 0.05.
| Antibody | Untreated control |
SubA-treated |
SubA272-treated |
|||
|---|---|---|---|---|---|---|
| B16F0 | B16F1 | B16F0 | B16F1 | B16F0 | B16F1 | |
| pAkt/total Akt ± S.E | pAkt/total Akt ± S.E | pAkt/total Akt ± S.E | ||||
| C20, 10 μg/ml | 0.350 ± 0.120 | 0.477 ± 0.636 | 0.340 ± 0.164 | 0.462 ± 0.037 | 0.478 ± 0.201 | 0.614 ± 0.022 |
| N20, 10 μg/ml | 0.833 ± 0.070 | 1.524 ± 0.103*** | 0.759 ± 0.083 | 1.820 ± 0.075*** | 0.836 ± 0.050* | 1.606 ± 0.191*** |
| Goat IgG, 10 μg/ml | 0.554 ± 0.088 | 0.563 ± 0.082 | 0.477 ± 0.034 | 0.562 ± 0.078 | 0.406 ± 0.014 | 0.700 ± 0.091 |
| STS, 1 μm | 0.230 ± 0.096 | 0.422 ± 0.061 | 0.252 ± 0.005 | 0.317 ± 0.030 | 0.438 ± 0.068 | 0.531 ± 0.046 |
| α2M*, 100 pm | 0.872 ± 0.086 | 1.374 ± 0.194 | 0.887 ± 0.028 | 1.292 ± 0.163 | 0.901 ± 0.022 | 1.592 ± 0.222 |
| Medium only | 0.403 ± 0.226 | 0.487 ± 0.066 | 0.388 ± 0.207 | 0.518 ± 0.056 | 0.384 ± 0.134 | 0.489 ± 0.013 |
DISCUSSION
In these studies we unequivocally show that cell-surface GRP78 is specifically cleaved by the catalytic subunit of the subtilase cytotoxin, SubAB, the only member of a new family of AB5 toxins. We show that the cleavage product is detectable in the cell culture supernatants of SubA- and SubAB-treated, but not SubAA272B-, or SubAA272- treated cells, and that cell-surface GRP78 cleavage does not affect intracellular GRP78 expression levels. We also show that the loss of this portion of GRP78 results in a decrease of CTD antibody staining as detected by fluorescence microscopy and flow cytometry. Cleavage of the COOH-terminal 28-kDa of GRP78 abrogates apoptosis caused by ligation of CTD antibodies to GRP78. Finally, we show that cleavage of GRP78 by SubA results in a decrease in the Ca2+ signaling induced by CTD antibody binding to GRP78. Cleavage of cell-surface GRP78 by SubA has broad implications not only for the study of GRP78 but the study of its role on the cell surface in cancer and infectious disease as a whole.
It is interesting to note that SubA is capable of cleaving cell-surface GRP78 on cells to a greater extent than the holotoxin, SubAB. The likely explanation is that if the B subunit is present, it will direct rapid binding to its cognate receptors on the cell surface and trigger uptake of the holotoxin. Thus, the A subunit is prevented from interacting significantly with cell-surface GRP78. Also, any holotoxin that remains on the cell surface bound to its glycan receptor will not be free to interact with GRP78. This may also explain the relatively high concentrations of SubA needed to achieve cell-surface GRP78 cleavage. Because there is no targeting subunit, a higher concentration of enzyme is needed to obtain the localized concentration of enzyme necessary for cleavage.
The presence of GRP78 in many cellular compartments (e.g. the ER, cytoplasm, nucleus, mitochondria, secretome, and cell surface) makes this protein difficult to study within any single compartment. Until now, the available methods of reducing GRP78 expression, such as RNAi knockdown and heterozygous mouse generation, reduced global GRP78 expression without consideration for the cellular compartment of interest. In fact, GRP78 knock-out mice are embryonically lethal (32), and although conditional/temporal knockouts have been developed to overcome this problem (33), they do not address individual cellular compartments. RNAi knockdown of GRP78 also reduces the entire pool of GRP78 in a cell, although 100% knockdown is never attained. The specificity of SubA for cell-surface GRP78 as well as its inability to be internalized provides a very elegant tool for studying cell-surface GRP78 without interference from intracellular processes dependent upon GRP78. Cleavage of cell-surface GRP78 by SubA allows us to study the receptor functions of GRP78 without the nonspecific effects caused by knockdown or cleavage of ER GRP78.
Previous studies using transmembrane prediction programs have suggested that GRP78 has four potential transmembrane domains at the cell surface: I (amino acids (aa) 1–17), II (aa 29–45), III (aa 222–242), and IV (aa 414–431) (34). However, the studies performed here demonstrate that at least residues 416–417 are exposed on the cell surface, as this is the sole SubA cleavage site, and we observe cell-surface cleavage. Other reports propose that GRP78 is tethered to the cell surface via the DNA J like protein, MTJ-1 (35). However, we have observed that MTJ-1 is not detectable on HepG2, Hep3B, 1-LN, PC3, B16F0, or B16F1 cell membranes.3 It is known that cell-surface GRP78 has a number of binding partners, including the teratocarcinoma-derived growth factor I (Cripto), the LDL receptor-related protein-1 (LRP1), the voltage-dependent anion channel (VDAC), and the major histocompatibility complex class I (MHC-I), depending on the cell type (36). Therefore, it is possible that GRP78 associates with one of the above proteins or a new, unidentified binding partner in these cells. It may also associate with another member of the DNA J protein family; however, further investigation is warranted to determine the mechanism by which GRP78 is displayed on the surface of these cells. In fact, further investigation may show that GRP78 has different binding partners depending on the cell line and type of cancer from which the cell line is derived. Overall, although the predicted transmembrane domains I through III and part of IV may indeed be actual transmembrane domains, at least the first three residues of predicted transmembrane domain IV are exposed to the extracellular space.
We also show that cleavage of the CTD of cell-surface GRP78 results in an abrogation of signaling initiated by CTD antibody ligation of GRP78; however, signaling initiated by ligation of anti-NTD GRP78 antibodies was unaffected for the cell lines that expressed cell-surface GRP78. The anti-GRP78 antibodies or enzyme treatment did not affect the cell lines with little or no cell-surface GRP78 expression. Anti-CTD antibodies to GRP78 induce apoptosis via a p53-dependent mechanism (18) while also decreasing expression of the anti-apoptotic protein Bcl-2 and increasing the expression of the pro-apoptotic proteins BAD, BAX, and BAK (30). The levels of the cleaved caspases 3, 7, 8, and 9 were also elevated when cell-surface GRP78 was ligated with a CTD antibody (30). We have also shown that NTD agonists promote cell survival and proliferation through activation of PI3K and Akt (30).
We have previously studied the Ca2+ release induced by anti-GRP78 antibodies isolated from the sera of prostate cancer patients on the highly metastatic prostate cancer cell line, 1-LN (31). Here, we used the N20 and C20 antibodies to induce Ca2+ signaling in several cell lines. Again, for the cell lines that express cell-surface GRP78, both the N20 and C20 antibodies induce the release of Ca2+. However, the C20-induced Ca2+ release is abrogated by SubA cleavage of the CTD of GRP78, whereas Ca2+ release by the NTD-reactive N20 antibody is completely unaffected in these SubA-treated cells. This suggests that the COOH terminus of GRP78 does not interact with the NH2 terminus of GRP78 and is not necessary for signaling through the NH2 terminus. In effect, the two termini act as separate signaling compartments. For the cell lines that do not express cell-surface GRP78, enzyme treatment or antibody stimulation had no effect, meaning that there was no release of Ca2+. It is interesting to note that the B16F0 and B16F1 cell lines did not release Ca2+ in response to antibody treatment. However, these cells do proliferate in response to treatment with the anti-GRP78 N20 antibody in an Akt-dependent manner, which is often a Ca2+-dependent process. To determine whether these cell lines phosphorylate Akt independent of Ca2+, we repeated the Akt assays in the presence of the cell-permeable chelator, BAPTA-AM. Again, we observed that Akt was phosphorylated in the absence of Ca2+, indicating that at least in these two cell lines, Akt phosphorylation is Ca2+-independent. This phenomenon has been observed in several other cell types, including macrophages (37), endothelial cells (38), and smooth muscle cells (39), where Akt activation by a variety of stimuli was achieved despite the chelation of Ca2+. Although the results with the B16F0 and B16F1 cell lines regarding Ca2+ dependence/independence are primarily interesting, these findings have no direct bearing on our studies, because we are specifically investigating GRP78 CTD-dependent signaling.
This proposed selective ligand determination of differential GRP78 signaling is not completely without precedent. Several lines of evidence from the 7-transmembrane domain and adrenergic receptor fields indicate that different adrenergic drugs can exhibit “biased agonism” when interacting with a single receptor type. The immediate branch-point in this system is selectivity for signaling via G-proteins or β-arrestins, with significantly different biological sequelae. This model has been explored both in vitro and in vivo using the β2-adrenergic receptors and angiotensin type 1 receptors as models (40–42). Furthermore, regional bias in signaling has been demonstrated using the protease-activated receptors (PAR) as models, in which distinct patterns of PAR coupling to effector molecules depends on differential regional interactions with proteinases. This regional selectivity also leads to considerably different biological outcomes (43).
The proliferation and apoptosis data presented here indicate that the CTD is indeed the region of GRP78 that is important for initiating apoptosis. This unequivocally confirms previous studies in our laboratory that indicate that the CTD of GRP78 is the site that transduces the apoptotic signal. The abrogation of signaling when HepG2, 1-LN, B16F1, and to a lesser extent, B16F0 cells, are treated with SubA suggests that the cleavage of the CTD of GRP78 would be protective against apoptosis caused by potential circulating CTD-reactive antibodies.
GRP78 has been identified as a receptor for Dengue virus on HepG2 cells. It has been shown that NTD antibodies inhibit Dengue virus entry, whereas CTD antibodies enhance Dengue virus entry (44). This suggests that cleavage of cell-surface GRP78 by SubA or otherwise interfering with CTD availability may be a unique strategy for combating this disease.
In summary, the studies presented here demonstrate that cell-surface GRP78 is specifically cleaved by the catalytic subunit of the Escherichia coli subtilase cytotoxin and that this cleavage occurs in a variety of cell types that express cell-surface GRP78. Cells that do not express GRP78 are unaffected by SubA treatment. The findings presented here demonstrate that SubA specifically cleaves cell-surface GRP78 and specifically abrogates GRP78 CTD signaling. This provides us with a unique tool to study the receptor function of GRP78 on a variety of cell types without disturbing the intracellular compartments where GRP78 performs functions necessary for cell survival.
Supplementary Material

This article contains supplemental Fig. 1 and Tables 1–5.
R. Ray, G. G. de Ridder, J. P. Eu, A. W. Paton, J. C. Paton, and S. V. Pizzo, unpublished observation.
- ER
- endoplasmic reticulum
- α2M*
- activated α2-macroglobulin
- NTD
- NH2-terminal domain
- CTD
- COOH-terminal domain
- SubA and SubB
- subtilase cytotoxin A and B subunits, respectively
- STS
- staurosporine
- rGRP78
- recombinant GRP78
- ANOVA
- analysis of variance
- PKR
- pancreatic elf2α kinase.
REFERENCES
- 1. Quinones Q. J., de Ridder G. G., Pizzo S. V. (2008) GRP78. A chaperone with diverse roles beyond the endoplasmic reticulum. Histol. Histopathol. 23, 1409–1416 [DOI] [PubMed] [Google Scholar]
- 2. Ni M., Zhou H., Wey S., Baumeister P., Lee A. S. (2009) Regulation of PERK signaling and leukemic cell survival by a novel cytosolic isoform of the UPR regulator GRP78/BiP. PLoS One 4, e6868. [DOI] [PMC free article] [PubMed] [Google Scholar]
- 3. Reddy R. K., Mao C., Baumeister P., Austin R. C., Kaufman R. J., Lee A. S. (2003) Endoplasmic reticulum chaperone protein GRP78 protects cells from apoptosis induced by topoisomerase inhibitors. Role of ATP binding site in suppression of caspase-7 activation. J. Biol. Chem. 278, 20915–20924 [DOI] [PubMed] [Google Scholar]
- 4. Sun F. C., Wei S., Li C. W., Chang Y. S., Chao C. C., Lai Y. K. (2006) Localization of GRP78 to mitochondria under the unfolded protein response. Biochem. J. 396, 31–39 [DOI] [PMC free article] [PubMed] [Google Scholar]
- 5. Kern J., Untergasser G., Zenzmaier C., Sarg B., Gastl G., Gunsilius E., Steurer M. (2009) GRP-78 secreted by tumor cells blocks the antiangiogenic activity of bortezomib. Blood 114, 3960–3967 [DOI] [PubMed] [Google Scholar]
- 6. Berger C. L., Dong Z., Hanlon D., Bisaccia E., Edelson R. L. (1997) A lymphocyte cell surface heat shock protein homologous to the endoplasmic reticulum chaperone, immunoglobulin heavy chain binding protein BIP. Int. J. Cancer 71, 1077–1085 [DOI] [PubMed] [Google Scholar]
- 7. Misra U. K., Gonzalez-Gronow M., Gawdi G., Wang F., Pizzo S. V. (2004) A novel receptor function for the heat shock protein Grp78. Silencing of Grp78 gene expression attenuates α2M*-induced signaling. Cell Signal 16, 929–938 [DOI] [PubMed] [Google Scholar]
- 8. Misra U. K., Gonzalez-Gronow M., Gawdi G., Hart J. P., Johnson C. E., Pizzo S. V. (2002) The role of Grp 78 in α2-macroglobulin-induced signal transduction. Evidence from RNA interference that the low density lipoprotein receptor-related protein is associated with, but not necessary for, GRP 78-mediated signal transduction. J. Biol. Chem. 277, 42082–42087 [DOI] [PubMed] [Google Scholar]
- 9. Arap M. A., Lahdenranta J., Mintz P. J., Hajitou A., Sarkis A. S., Arap W., Pasqualini R. (2004) Cell surface expression of the stress response chaperone GRP78 enables tumor targeting by circulating ligands. Cancer Cell 6, 275–284 [DOI] [PubMed] [Google Scholar]
- 10. Kim Y., Lillo A. M., Steiniger S. C., Liu Y., Ballatore C., Anichini A., Mortarini R., Kaufmann G. F., Zhou B., Felding-Habermann B., Janda K. D. (2006) Targeting heat shock proteins on cancer cells. Selection, characterization, and cell-penetrating properties of a peptidic GRP78 ligand. Biochemistry 45, 9434–9444 [DOI] [PubMed] [Google Scholar]
- 11. Lee A. S. (2007) GRP78 induction in cancer. Therapeutic and prognostic implications. Cancer Res. 67, 3496–3499 [DOI] [PubMed] [Google Scholar]
- 12. de Ridder G. G., Gonzalez-Gronow M., Ray R., Pizzo S. V. (2010) Autoantibodies against cell surface GRP78 promote tumor growth in a murine model of melanoma. Melanoma Res. 21, 35–43 [DOI] [PMC free article] [PubMed] [Google Scholar]
- 13. Misra U. K., Sharma T., Pizzo S. V. (2005) Ligation of cell surface-associated glucose-regulated protein 78 by receptor-recognized forms of α2-macroglobulin. Activation of p21-activated protein kinase-2-dependent signaling in murine peritoneal macrophages. J. Immunol. 175, 2525–2533 [DOI] [PubMed] [Google Scholar]
- 14. Misra U. K., Deedwania R., Pizzo S. V. (2005) Binding of activated α2-macroglobulin to its cell surface receptor GRP78 in 1-LN prostate cancer cells regulates PAK-2-dependent activation of LIMK. J. Biol. Chem. 280, 26278–26286 [DOI] [PMC free article] [PubMed] [Google Scholar]
- 15. Misra U. K., Deedwania R., Pizzo S. V. (2006) Activation and cross-talk between Akt, NF-κB, and unfolded protein response signaling in 1-LN prostate cancer cells consequent to ligation of cell surface-associated GRP78. J. Biol. Chem. 281, 13694–13707 [DOI] [PubMed] [Google Scholar]
- 16. Mintz P. J., Kim J., Do K. A., Wang X., Zinner R. G., Cristofanilli M., Arap M. A., Hong W. K., Troncoso P., Logothetis C. J., Pasqualini R., Arap W. (2003) Fingerprinting the circulating repertoire of antibodies from cancer patients. Nat. Biotechnol. 21, 57–63 [DOI] [PubMed] [Google Scholar]
- 17. Cohen M., Petignat P. (2011) Purified autoantibodies against glucose-regulated protein 78 (GRP78) promote apoptosis and decrease invasiveness of ovarian cancer cells. Cancer Lett. 309, 104–109 [DOI] [PubMed] [Google Scholar]
- 18. Misra U. K., Mowery Y., Kaczowka S., Pizzo S. V. (2009) Ligation of cancer cell surface GRP78 with antibodies directed against its COOH-terminal domain up-regulates p53 activity and promotes apoptosis. Mol. Cancer Ther. 8, 1350–1362 [DOI] [PubMed] [Google Scholar]
- 19. Paton A. W., Srimanote P., Talbot U. M., Wang H., Paton J. C. (2004) A new family of potent AB(5) cytotoxins produced by Shiga toxigenic Escherichia coli. J. Exp. Med. 200, 35–46 [DOI] [PMC free article] [PubMed] [Google Scholar]
- 20. Chong D. C., Paton J. C., Thorpe C. M., Paton A. W. (2008) Clathrin-dependent trafficking of subtilase cytotoxin, a novel AB5 toxin that targets the endoplasmic reticulum chaperone BiP. Cell. Microbiol. 10, 795–806 [DOI] [PubMed] [Google Scholar]
- 21. Byres E., Paton A. W., Paton J. C., Löfling J. C., Smith D. F., Wilce M. C., Talbot U. M., Chong D. C., Yu H., Huang S., Chen X., Varki N. M., Varki A., Rossjohn J., Beddoe T. (2008) Incorporation of a non-human glycan mediates human susceptibility to a bacterial toxin. Nature 456, 648–652 [DOI] [PMC free article] [PubMed] [Google Scholar]
- 22. Paton A. W., Beddoe T., Thorpe C. M., Whisstock J. C., Wilce M. C., Rossjohn J., Talbot U. M., Paton J. C. (2006) AB5 subtilase cytotoxin inactivates the endoplasmic reticulum chaperone BiP. Nature 443, 548–552 [DOI] [PubMed] [Google Scholar]
- 23. Yamazaki H., Hiramatsu N., Hayakawa K., Tagawa Y., Okamura M., Ogata R., Huang T., Nakajima S., Yao J., Paton A. W., Paton J. C., Kitamura M. (2009) Activation of the Akt-NF-κB pathway by subtilase cytotoxin through the ATF6 branch of the unfolded protein response. J. Immunol. 183, 1480–1487 [DOI] [PMC free article] [PubMed] [Google Scholar]
- 24. Zhao Y., Tian T., Huang T., Nakajima S., Saito Y., Takahashi S., Yao J., Paton A. W., Paton J. C., Kitamura M. (2011) Subtilase cytotoxin activates MAP kinases through PERK and IRE1 branches of the unfolded protein response. Toxicol. Sci. 120, 79–86 [DOI] [PubMed] [Google Scholar]
- 25. Wolfson J. J., May K. L., Thorpe C. M., Jandhyala D. M., Paton J. C., Paton A. W. (2008) Subtilase cytotoxin activates PERK, IRE1 and ATF6 endoplasmic reticulum stress-signaling pathways. Cell. Microbiol. 10, 1775–1786 [DOI] [PMC free article] [PubMed] [Google Scholar]
- 26. May K. L., Paton J. C., Paton A. W. (2010) Escherichia coli subtilase cytotoxin induces apoptosis regulated by host Bcl-2 family proteins Bax/Bak. Infect. Immun. 78, 4691–4696 [DOI] [PMC free article] [PubMed] [Google Scholar]
- 27. Imber M. J., Pizzo S. V. (1981) Clearance and binding of two electrophoretic “fast” forms of human α 2-macroglobulin. J. Biol. Chem. 256, 8134–8139 [PubMed] [Google Scholar]
- 28. King L. S., Berg M., Chevalier M., Carey A., Elguindi E. C., Blond S. Y. (2001) Isolation, expression, and characterization of fully functional nontoxic BiP/GRP78 mutants. Protein Expr. Purif. 22, 148–158 [DOI] [PubMed] [Google Scholar]
- 29. Stiber J., Hawkins A., Zhang Z. S., Wang S., Burch J., Graham V., Ward C. C., Seth M., Finch E., Malouf N., Williams R. S., Eu J. P., Rosenberg P. (2008) STIM1 signaling controls store-operated calcium entry required for development and contractile function in skeletal muscle. Nat Cell Biol. 10, 688–697 [DOI] [PMC free article] [PubMed] [Google Scholar]
- 30. Misra U. K., Pizzo S. V. (2010) Ligation of cell surface GRP78 with antibody directed against the COOH-terminal domain of GRP78 suppresses Ras/MAPK and PI 3-kinase/AKT signaling while promoting caspase activation in human prostate cancer cells. Cancer Biol. Ther. 9, 142–152 [DOI] [PubMed] [Google Scholar]
- 31. Gonzalez-Gronow M., Cuchacovich M., Llanos C., Urzua C., Gawdi G., Pizzo S. V. (2006) Prostate cancer cell proliferation in vitro is modulated by antibodies against glucose-regulated protein 78 isolated from patient serum. Cancer Res. 66, 11424–11431 [DOI] [PubMed] [Google Scholar]
- 32. Luo S., Mao C., Lee B., Lee A. S. (2006) GRP78/BiP is required for cell proliferation and protecting the inner cell mass from apoptosis during early mouse embryonic development. Mol. Cell. Biol. 26, 5688–5697 [DOI] [PMC free article] [PubMed] [Google Scholar]
- 33. Kim S., Wang M., Lee A. S., Thompson R. F. (2011) Impaired eyeblink conditioning in 78-kDa glucose-regulated protein (GRP78)/immunoglobulin binding protein (BiP) conditional knockout mice. Behav. Neurosci. 125, 404–411 [DOI] [PubMed] [Google Scholar]
- 34. Zhang Y., Liu R., Ni M., Gill P., Lee A. S. (2010) Cell surface relocalization of the endoplasmic reticulum chaperone and unfolded protein response regulator GRP78/BiP. J. Biol. Chem. 285, 15065–15075 [DOI] [PMC free article] [PubMed] [Google Scholar]
- 35. Misra U. K., Gonzalez-Gronow M., Gawdi G., Pizzo S. V. (2005) The role of MTJ-1 in cell surface translocation of GRP78, a receptor for α2-macroglobulin-dependent signaling. J. Immunol. 174, 2092–2097 [DOI] [PubMed] [Google Scholar]
- 36. Gonzalez-Gronow M., Selim M. A., Papalas J., Pizzo S. V. (2009) GRP78. A multifunctional receptor on the cell surface. Antioxid. Redox Signal. 11, 2299–2306 [DOI] [PubMed] [Google Scholar]
- 37. Lee S. H., Park D. W., Park S. C., Park Y. K., Hong S. Y., Kim J. R., Lee C. H., Baek S. H. (2009) Calcium-independent phospholipase A2β-Akt signaling is involved in lipopolysaccharide-induced NADPH oxidase 1 expression and foam cell formation. J. Immunol. 183, 7497–7504 [DOI] [PubMed] [Google Scholar]
- 38. Takahashi S., Mendelsohn M. E. (2003) Synergistic activation of endothelial nitric-oxide synthase (eNOS) by HSP90 and Akt. Calcium-independent eNOS activation involves formation of an HSP90-Akt-CaM-bound eNOS complex. J. Biol. Chem. 278, 30821–30827 [DOI] [PubMed] [Google Scholar]
- 39. Dugourd C., Gervais M., Corvol P., Monnot C. (2003) Akt is a major downstream target of PI 3-kinase involved in angiotensin II-induced proliferation. Hypertension 41, 882–890 [DOI] [PubMed] [Google Scholar]
- 40. Violin J. D., DeWire S. M., Yamashita D., Rominger D. H., Nguyen L., Schiller K., Whalen E. J., Gowen M., Lark M. W. (2010) Selectively engaging β-arrestins at the angiotensin II type 1 receptor reduces blood pressure and increases cardiac performance. J. Pharmacol. Exp. Ther. 335, 572–579 [DOI] [PubMed] [Google Scholar]
- 41. Drake M. T., Violin J. D., Whalen E. J., Wisler J. W., Shenoy S. K., Lefkowitz R. J. (2008) β-Arrestin-biased agonism at the β2-adrenergic receptor. J. Biol. Chem. 283, 5669–5676 [DOI] [PubMed] [Google Scholar]
- 42. Violin J. D., Lefkowitz R. J. (2007) β-Arrestin-biased ligands at seven-transmembrane receptors. Trends Pharmacol. Sci. 28, 416–422 [DOI] [PubMed] [Google Scholar]
- 43. Russo A., Soh U. J., Trejo J. (2009) Proteases display biased agonism at protease-activated receptors. Location matters! Mol. Interv. 9, 87–96 [DOI] [PMC free article] [PubMed] [Google Scholar]
- 44. Jindadamrongwech S., Thepparit C., Smith D. R. (2004) Identification of GRP 78 (BiP) as a liver cell expressed receptor element for dengue virus serotype 2. Arch. Virol. 149, 915–927 [DOI] [PubMed] [Google Scholar]
Associated Data
This section collects any data citations, data availability statements, or supplementary materials included in this article.