

Abstract
Background
Alcohol consumption is a major risk factor for injuries; however, international data on this burden are limited. This article presents new methods to quantify the burden of injuries attributable to alcohol consumption and quantifies the number of deaths, potential years of life lost (PYLL), and disability-adjusted life years (DALYs) lost from injuries attributable to alcohol consumption for 2004.
Methods
Data on drinking indicators were obtained from the Comparative Risk Assessment study. Data on mortality, PYLL, and DALYs for injuries were obtained from the World Health Organization. Alcohol-attributable fractions were calculated based on a new risk modeling methodology, which accounts for average and heavy drinking occasions. 95% confidence intervals (CIs) were calculated using a Monte Carlo simulation method.
Results
In 2004, 851,900 (95% CI: 419,400 to 1,282,500) deaths, 19,051,000 (95% CI: 9,767,000 to 28,243,000) PYLL, and 21,688,000 (95% CI: 11,097,000 to 32,385,000) DALYs for people 15 years and older were due to injuries attributable to alcohol consumption. With respect to the total number of deaths, harms to others were responsible for 15.1% of alcohol-attributable injury deaths, 14.5% of alcohol-attributable injury PYLL, and 11.35% of alcohol-attributable injury DALYs. The overall burden of injuries attributable to alcohol consumption corresponds to 17.3% of all injury deaths, 16.7% of all PYLL, and 13.6% of all DALYs caused by injuries, or 1.4% of all deaths, 2.0% of all PYLL, and 1.4% of all DALYs in 2004.
Conclusions
The novel methodology described in this article to calculate the burden of injuries attributable to alcohol consumption improves on previous methodology by more accurately calculating the burden of injuries attributable to one’s own drinking, and for the first time, calculates the burden of injuries attributable to the alcohol consumption of others. The burden of injuries attributable to alcohol consumption is large and is entirely avoidable, and policies and strategies to reduce it are recommended.
Keywords: Alcohol, Injury, Attributable fraction, Burden of disease, Mortality, Years of potential life lost
Introduction
Alcohol consumption is the sixth leading cause of death and the third leading cause of disability-adjusted life years (DALYs) lost globally, with injuries accounting for a large part of the alcohol-attributable burden of disease [1,2]. Previous research, with varying study designs such as cross-sectional studies [3], case-crossover studies [4], case–control studies [5], systematic reviews, and meta-analyses [6,7] has shown a strong association between alcohol consumption and many types of intentional and unintentional injuries. Moreover, it has been shown that alcohol consumption fulfills the standard epidemiological criteria of causality for many injury outcomes [8]. However, reporting of the burden of injuries has not kept pace with new methodology to calculate alcohol-attributable risk. Previous global estimates of the alcohol-attributable burden of injuries were calculated using simplistic methods based on one country and then scaling these estimates according to average volume of consumption and patterns of drinking [9]. The most recently proposed method of calculating the alcohol-attributable burden of disease did not account for injuries caused by other people’s drinking (the burden of which has been estimated to be substantial [10,11]) or account for the overlap in binge consumption and average consumption, which leads to an overestimation of the alcohol-attributable injuries caused to the drinker [12].
In this article we present new methodology to calculate the alcohol-attributable burden of disease for injuries using formulas that take into consideration the main drivers of alcohol-attributable risk – namely average daily consumption and binge drinking. This calculation of the global burden of injuries attributable to alcohol is possibly due, in part, to the persistent relationship between alcohol consumption and injury risk which has remained strikingly similar throughout the last 50 years of observational research [13,14] and across cultural and geographical boundaries [15-18]. This means that, although drinking patterns may vary across countries, cultures, and age and sex groups, the same risk function can be used for all countries to determine injury burden estimates based on country-specific drinking behavior. This information can be aggregated to regional or global levels to gain a more accurate comparative picture.
It is the aim of this article to utilize the new methodology outlined herein to estimate the burden of alcohol-attributable injuries caused to the drinker and to others, and to estimate for 2004 the global burden of injuries attributable to alcohol consumption in terms of mortality, potential years of life lost (PYLL), and DALYs for each Global Burden of Disease (GBD) region.
Methods
Our methodology has two steps: [1] calculation of the injury-, sex-, age-, consumption-, and region-specific alcohol-attributable fractions (AAFs) and [2] application of these AAFs to mortality, PYLL, and DALY data.
Definition of regions and population data
The GBD regions (2005) are based on geography, child and adult mortality, and major causes of death [19]. Population estimates by country in 2004 were based on data obtained from the 2008 revisions of the United Nations Population Division [20].
Step 1: Calculation of the AAFs by sex and alcohol consumption
Alcohol consumption measures
Two dimensions of alcohol consumption play a role in affecting the probability of injury: binge drinking and average daily alcohol consumption.
A binge drinker was defined as a person who consumed at least five drinks (for men) or four drinks (for women) of alcohol on at least one occasion in the past month, assuming that the average drink size is 12 g of pure ethanol. Estimates for the prevalence of binge drinkers, current drinkers, and past year abstainers were obtained from the 2005 Comparative Risk Assessment (CRA) study [19].
Average daily alcohol consumption was calculated based on 80% of per capita consumption of alcohol (to account for alcohol not consumed) and the prevalence of current drinkers. Total adult (age 15 years and over) per capita alcohol consumption for 2004 for each region was calculated by adding the estimated recorded and unrecorded adult per capita consumption and then subtracting tourist (the amount of alcohol consumed by citizens of other countries) adult per capita consumption [21].
Estimates of recorded adult per capita alcohol consumption were obtained from the Global Information System on Alcohol and Health database [22]. These estimates were based on government records (taxation), industry publications for the production and sales of alcohol, and data from the Food and Agriculture Organization [22]. Unrecorded and tourist adult per capita consumption estimates were taken from the ongoing CRA study [22]. The main sources for unrecorded consumption were home production, alcohol intended for industrial, technical, and medical uses, and illegal production or importation of alcohol [22]. As no variance estimates for unrecorded and tourist alcohol consumption existed, we estimated the variance to be five times that of the variance of recorded alcohol consumption proportionate to the mean [23].
For this study we used two different types of drinking days: binge drinking days and average drinking days. Prevalence of binge drinkers and the frequency of binge drinking days and alcohol consumption on binge drinking days (for binge drinkers) were obtained from the 2005 CRA study. Average alcohol consumption on nonbinge drinking days (defined as a drinking day that was not a binge drinking day) was assumed to be the same for binge drinkers and nonbinge drinkers. Average alcohol consumption on nonbinge drinking days was calculated such that every day that a person was not binge drinking was considered to be an average drinking day. The volume of alcohol consumed on an average drinking day was then calculated using per capita consumption and binge drinking consumption, such that the amount of alcohol consumed on the nonbinge drinking days plus the amount of alcohol consumed on binge drinking days was equal to 80% of per capita alcohol consumption.
Risk relations
Sources for relative risk (RR) functions by GBD code are outlined in Table 1. Alcohol-attributable harms were calculated if a meta-analysis existed. The RR functions for injuries, expressed as a function of alcohol consumption in grams per occasion (x), are as follows [6]:where RRMVA represents the RR for motor vehicle accidents, and RRNon-MVA represents the RR for nonmotor vehicle accidents. These RR functions are based on epidemiological studies that measure postinjury blood alcohol content and, thus, can be used to calculate a person’s risk on an average drinking day and on a binge drinking day.
Table 1.
Injury categories and the source of the relative risk relationships with alcohol consumption
| Condition | GBD code | ICD-10 codes | Relative risk source |
|---|---|---|---|
| Unintentional injuries |
III A |
|
|
| Motor vehicle accidents |
III A 1 |
§ |
Taylor et al., 2010 [6] for relative risk |
| Poisonings |
III A 2 |
X40-X49 |
Taylor et al., 2010 [6] for relative risk |
| Falls |
III A 3 |
W00-W19 |
Taylor et al., 2010 [6] for relative risk |
| Fires |
III A 4 |
X00-X09 |
Taylor et al., 2010 [6] for relative risk |
| Drowning |
III A 5 |
W65-W74 |
Taylor et al., 2010 [6] for relative risk |
| Other Unintentional injuries |
III A 6 |
†Rest of V-series and W20-W64, W 75-W99, X10-X39, X50-X59, Y40-Y86, Y88, and Y89 |
Taylor et al., 2010 [6] for relative risk |
| Intentional injuries |
III B |
|
|
| Self-inflicted injuries |
III B 1 |
X60-X84 and Y87.0 |
Taylor et al., 2010 [6] for relative risk |
| Violence |
III B 2 |
X85-Y09, Y87.1 |
Taylor et al., 2010 [6] for relative risk |
| Other intentional injuries | III B 4 | † | Taylor et al., 2010 [6] for relative risk |
§ V021–V029, V031–V039, V041–V049, V092, V093, V123–V129, V133–V139, V143–V149, V194–V196, V203–V209, V213–V219, V223–V229, V233–V239, V243–V249,V253–V259, V263–V269, V273– V279, V283–V289, V294–V299, V304–V309, V314–V319, V324–V329, V334–V339, V344–V349, V354–V359, V364–V369, V374–V379, V384–V389, V394–V399, V404–V409, V414–V419, V424–V429, V434–V439, V444–V449, V454–V459, V464– V469, V474–V479, V484–V489, V494–V499, V504–V509, V514–V519, V524–V529, V534–V539, V544–V549, V554–V559, V564–V569, V574–V579, V584–V589, V594–V599, V604–V609, V614–V619, V624–V629, V634–V639, V644–V649, V654– V659, V664–V669, V674–V679, V684–V689, V694–V699, V704–V709, V714–V719, V724–V729, V734–V739, V744–V749, V754–V759, V764–V769, V774–V779, V784–V789, V794–V799, V803–V805, V811, V821, V830–V833, V840–V843, V850– V853, V860–V863, V870–V878, V892. †Rest of V = V-series MINUS §.
Estimating the AAFs for harms caused to oneself
The AAFs for injuries were modeled according to methodology that takes into account two dimensions of alcohol consumption:
1 binge drinking (both the number of occasions and the amount consumed per occasion)
2 average daily alcohol consumption (on nonbinge drinking days)
When calculating the AAFs, we also included alcohol metabolism rates for men and women to calculate a person’s time at risk of an injury outcome, according to methods outlined by Taylor and colleagues [12].
The AAFs for intentional and unintentional injuries attributable to alcohol consumption were calculated as follows: where Pabs represents the prevalence of current abstainers, and Pcurrent(binge) and Pcurrent(non-binge) are the prevalence of current drinkers who engage in binge drinking and the prevalence of current drinkers who do not engage in binge drinking, respectively. The RRs were calculated separately for current drinkers who engage in binge drinking and current drinkers who do not engage in binge drinking. RRcurrent(non-binge) was calculated as follows: and RRcurrent(binge) was calculated as follows: where risk on average drinking days (RRaverage) was calculated as follows: and where risk on binge drinking days (RRbinge) was calculated as follows: where Pdayatrisk represents the proportion of a day at risk given an alcohol consumption on that day (x), and RRinjury is the relative risk for injury given an amount of alcohol consumed (x), where x is the amount of alcohol consumed on binge drinking days for RRbinge and the amount of alcohol consumed on nonbinge drinking days for RRaverage*Pdayatrisk is calculated based on the average rate at which alcohol is metabolized.
Since these AAFs were calculated based on samples of emergency room patients, we estimated the AAF for mortality from motor vehicle accidents by multiplying the AAF for morbidity for motor vehicle accidents by 3/2. Similarly, to estimate the AAF for mortality due to nonmotor vehicle accidents, we multiplied the AAF for morbidity for nonmotor vehicle accidents by 9/4. These methods were based on two studies that compared blood alcohol levels of emergency room patients with blood alcohol levels obtained from coroners’ reports of patients who died from an injury [24,25].
For women, the AAF for motor vehicle accidents was calculated by multiplying the AAF for motor vehicle accidents for men by the product of the per capita consumption of alcohol for women divided by the per capita consumption of alcohol for men.
Estimating the AAFs for harms caused to others
The AAFs for deaths and morbidity caused by drinkers to others due to motor vehicle accidents were calculated based on recent data reported by Laslett et al., 2011 [11]. The AAFs for the alcohol-attributable injuries to others were calculated as follows: where AAFOtherage represents the AAF for motor vehicle accident injuries caused by others, AAFselfcountryi represents the AAF for motor vehicle accident injuries caused to oneself for an entire country i, and AAFselfagecountryi represents the AAF for motor vehicle accident injuries caused to oneself for each specific age group. AAFselfAustralia represents the AAF for motor vehicle accident injuries caused to oneself in Australia, and AAFotherageAustralia represents the AAF for motor vehicle accident injuries caused by others for each specific age group in Australia.
The AAFs for deaths and injuries caused by an assault by someone who had been drinking were calculated based on recent data reported by Laslett et al., 2011. These AAFs were calculated as follows: where AAFAssaultage_countryi represents the age-specific AAF for deaths or injuries caused by assault, AAFAssault_countryi represents the AAF for assaults for an entire country, AAFAssault_Australia represents the AAF for deaths or injuries caused by assaults for Australia and AAFAssaultage_Australiai represents the AAF for deaths or injuries caused by assaults for each specific age group in Australia.
Estimating the 95% confidence intervals for the AAFs
The 95% confidence intervals (CIs) for the AAFs were calculated using a Monte Carlo approach, with 40,000 simulations that estimated the lowest-level parameters used in the AAF formulas [23]. For the AAFs of binge and average consumption for each simulation, we generated estimates for the prevalence of past year abstainers from which a prevalence of current drinkers was estimated. Additionally, we generated estimates of the RR function betas and the formula used to calculate the average rate at which alcohol is metabolized, which, in turn, was used to calculate Pdayatrisk. For the calculation of the 95% CIs, we also generated estimates for the prevalence of binge drinkers among current drinkers and the average number of drinks consumed on binge drinking occasions and on nonbinge drinking occasions. The resulting 40,000 AAF estimates for binge and average consumption were used to calculate the variance of the AAFs and the 95% CIs for each disease category.
Step 2: Application of the AAFs to region-specific mortality, PYLL, and DALY data
This step required multiplying the sex-, age-, consumption- ,and injury-specific AAFs by mortality, PYLL, and DALY data, respectively.
Estimates of mortality and morbidity
To quantify the burden of injuries attributable to alcohol consumption we used an event-based measure (mortality) and time-based measures (PYLL and DALYs). DALYs combine years of life lost due to premature mortality and years lived with disabilities. Comprehensive revision estimates for 2004 of mortality, PYLL, and DALYs for the 160 GBD disease and injury categories were provided by the World Health Organization (WHO)[26]. Methods to estimate the mortality, PYLL, and DALYs in the GBD project are described elsewhere [27,28]. Estimates of mortality, PYLL, and DALYs were available for each country, which were used to calculate regional estimates. This meant that for each region, sex-, age-, injury-, and consumption-specific AAFs were applied to sex-, age-, and injury-specific outcome data.
All statistics and analyses were performed using R version 2.11.1.
Results
Table 2 outlines the prevalence of current drinkers, people who engage in binge drinking, average number of binge drinking days in a year, the average number of drinks consumed during a binge drinking occasion, and the per capita consumption by sex for each CRA region. Men exhibited a higher per capita consumption and a higher prevalence of current drinkers and of binge drinkers than did women in every region. The prevalence of current drinkers and per capita consumption varied greatly, with Western Europe having the highest prevalence of current drinkers and North Africa/Middle East having the lowest prevalence of current drinkers. Eastern Europe had the highest per capita consumption for men and women, while Southern Asia had the lowest per capita consumption for women and North Africa/Middle East had the lowest for men.
Table 2.
Drinking indicators by Global Burden of Disease region for 2005
| |
Men |
Women |
||||||||
|---|---|---|---|---|---|---|---|---|---|---|
| GBD Region | Current drinkers | Prevalence of binge drinkers [among current drinkers] | Binge drinking occasions per year | Drinks consumed during a binge drinking occasion | Per capita consumption (l/year per person) | Current drinkers | Prevalence of binge drinkers [among current drinkers] | Binge drinking occasions per year | Drinks consumed during a binge drinking occasion | Per capita consumption (l/year per person) |
| Asia, Pacific [High Income] |
87.43% |
17.17% |
26 |
7 |
15.23 |
75.62% |
3.93% |
26 |
6 |
4.63 |
| Asia, Central |
63.87% |
52.76% |
52 |
7 |
10.62 |
46.83% |
8.78% |
52 |
6 |
3.23 |
| Asia, East |
71.71% |
13.48% |
26 |
7 |
9.88 |
37.50% |
0.54% |
26 |
6 |
1.95 |
| Asia, South |
16.68% |
45.09% |
52 |
7 |
3.80 |
2.64% |
9.22% |
52 |
6 |
0.24 |
| Asia, Southeast |
27.21% |
10.58% |
52 |
7 |
5.21 |
5.63% |
2.89% |
52 |
6 |
0.47 |
| Australasia |
87.08% |
10.00% |
26 |
7 |
14.29 |
80.02% |
2.84% |
26 |
6 |
5.78 |
| Caribbean |
65.17% |
20.17% |
26 |
7 |
9.36 |
34.23% |
5.11% |
26 |
6 |
2.74 |
| Europe, Central |
77.41% |
25.21% |
52 |
7 |
21.81 |
59.05% |
3.26% |
52 |
6 |
6.70 |
| Europe, Eastern |
71.74% |
59.39% |
78 |
9 |
25.19 |
50.77% |
13.25% |
78 |
7 |
8.07 |
| Europe, Western |
87.80% |
12.04% |
26 |
7 |
17.64 |
77.56% |
1.80% |
26 |
6 |
7.06 |
| Latin America, Andean |
67.92% |
18.47% |
52 |
7 |
11.35 |
47.14% |
3.84% |
52 |
6 |
3.43 |
| Latin America, Central |
57.83% |
22.54% |
78 |
8 |
11.73 |
34.88% |
1.56% |
78 |
6 |
3.23 |
| Latin America, Southern |
86.48% |
16.80% |
26 |
7 |
13.91 |
66.75% |
0.17% |
26 |
6 |
5.28 |
| Latin America, Tropical |
58.67% |
21.15% |
52 |
7 |
14.11 |
41.48% |
5.36% |
52 |
6 |
4.39 |
| Northern Africa / Middle East |
8.90% |
7.21% |
26 |
7 |
2.04 |
2.40% |
4.10% |
26 |
6 |
0.26 |
| North America [High Income] |
72.70% |
13.74% |
26 |
7 |
14.38 |
60.98% |
3.39% |
26 |
6 |
5.05 |
| Oceania |
79.59% |
25.20% |
52 |
7 |
5.55 |
47.59% |
10.74% |
52 |
6 |
0.94 |
| Sub-Saharan Africa, Central |
49.95% |
32.01% |
52 |
7 |
5.83 |
29.88% |
16.58% |
52 |
6 |
2.18 |
| Sub-Saharan Africa, East |
29.83% |
20.98% |
52 |
7 |
7.37 |
19.34% |
1.00% |
52 |
6 |
2.19 |
| Sub-Saharan Africa, Southern |
37.53% |
39.00% |
78 |
8 |
14.28 |
13.60% |
21.29% |
78 |
6 |
3.07 |
| Sub-Saharan Africa, Western |
41.39% |
32.40% |
52 |
7 |
11.69 |
24.76% |
20.88% |
52 |
6 |
3.94 |
| World | 50.22% | 24.24% | - | - | 9.74 | 30.82% | 5.48% | - | - | 2.6 |
Table 3 outlines the deaths attributable to alcohol consumption by region and sex. 851,900 (95% CI: 419,400 to 1,282,500) deaths were due to alcohol-attributable injuries, of which 221,100 (95% CI: 140,000 to 312,000) deaths were caused by alcohol-attributable harms to others (alcohol-attributable injuries caused by others are outlined in Additional file 1). Figures 1 and 2 outline the burden of injuries in deaths per 100,000 people for men and women, respectively. Alcohol-attributable injuries account for 1.43% (95% CI: 0.70% to 2.15%) of all deaths and 15.10% (95% CI: 7.43% to 22.73%) of all deaths from injuries. Of this total, 761,300 (95% CI: 390,800 to 1,088,900) deaths were among men, representing 2.42% (95% CI: 1.24% to 3.46%) of all deaths and 20.26% (95% CI: 10.40% to 28.98%) of all deaths from injuries for men. 90,600 (95% CI: 28,500 to 193,600) deaths were among women, representing 0.32% (95% CI: 0.10% to 0.69%) of all deaths and 4.81% (95% CI: 1.51% to 10.27%) of all deaths from injuries for women. Adjusting the figures in Table 3 for the population of each region, we observed that Eastern Europe had the largest population-standardized mortality rate, with 135.4 (95% CI: 82.0 to 161.4) deaths per 100,000 people caused by injuries attributable to alcohol consumption, and North Africa/Middle East had the lowest death rate, with 2.0 (95% CI: 0.5 to 5.5) deaths per 100,000 people caused by injuries attributable to alcohol consumption. All AAFs for injuries as well as alcohol-attributable injury deaths by age, sex, region, and cause are provided in Additional file 2, Additional file 3, Additional file 4 and Additional file 5.
Table 3.
Alcohol-attributable deaths caused by injuries by Global Burden of Disease region for 2004
| |
Men |
Women |
Total |
||||||
|---|---|---|---|---|---|---|---|---|---|
| Point estimate | Lower 95% confidence interval | Upper 95% confidence interval | Point estimate | Lower 95% confidence interval | Upper 95% confidence interval | Point estimate | Lower 95% confidence interval | Upper 95% confidence interval | |
| Asia, Pacific [High Income] |
17,030 |
8,340 |
25,730 |
1,530 |
620 |
2,440 |
18,560 |
8,960 |
28,170 |
| Asia, Central |
8,640 |
4,940 |
12,340 |
1,010 |
410 |
1,620 |
9,650 |
5,340 |
13,960 |
| Asia, East |
80,300 |
37,750 |
122,860 |
10,310 |
1,760 |
19,810 |
90,620 |
39,510 |
142,670 |
| Asia, South |
77,810 |
21,330 |
144,490 |
7,070 |
290 |
49,630 |
84,890 |
21,620 |
194,120 |
| Asia, Southeast |
37,260 |
13,000 |
62,920 |
3,280 |
320 |
8,990 |
40,540 |
13,320 |
71,910 |
| Australasia |
1,210 |
630 |
1,800 |
160 |
90 |
230 |
1,380 |
720 |
2,030 |
| Caribbean |
2,410 |
1,350 |
3,460 |
300 |
120 |
490 |
2,710 |
1,470 |
3,950 |
| Europe, Central |
27,480 |
13,820 |
39,030 |
2,120 |
480 |
3,760 |
29,600 |
14,290 |
42,790 |
| Europe, Eastern |
258,530 |
161,260 |
298,650 |
29,310 |
12,980 |
44,570 |
287,840 |
174,240 |
343,220 |
| Europe, Western |
30,270 |
14,990 |
45,550 |
4,490 |
1,360 |
7,620 |
34,760 |
16,340 |
53,170 |
| Latin America, Andean |
3,790 |
1,660 |
5,930 |
370 |
100 |
690 |
4,160 |
1,760 |
6,620 |
| Latin America, Central |
38,050 |
23,870 |
52,240 |
4,010 |
1,950 |
6,130 |
42,060 |
25,820 |
58,370 |
| Latin America, Southern |
3,880 |
1,920 |
5,840 |
390 |
110 |
670 |
4,270 |
2,040 |
6,510 |
| Latin America, Tropical |
33,810 |
18,020 |
49,600 |
3,060 |
1,070 |
5,110 |
36,870 |
19,090 |
54,710 |
| Northern Africa / Middle East |
7,530 |
1,710 |
19,660 |
670 |
0 |
2,840 |
8,200 |
1,710 |
22,490 |
| North America [High Income] |
25,840 |
13,290 |
38,400 |
3,850 |
1,450 |
6,250 |
29,690 |
14,740 |
44,650 |
| Oceania |
430 |
270 |
580 |
70 |
30 |
120 |
500 |
300 |
700 |
| Sub-Saharan Africa, Central |
9,500 |
6,180 |
12,810 |
1,410 |
600 |
2,220 |
10,910 |
6,780 |
15,030 |
| Sub-Saharan Africa, East |
31,430 |
12,860 |
50,150 |
5,080 |
850 |
10,000 |
36,510 |
13,710 |
60,150 |
| Sub-Saharan Africa, Southern |
32,110 |
17,060 |
45,430 |
5,570 |
2,290 |
9,030 |
37,680 |
19,350 |
54,460 |
| Sub-Saharan Africa, Western |
33,990 |
16,560 |
51,420 |
6,510 |
1,680 |
11,380 |
40,500 |
18,240 |
62,800 |
| World | 761,300 | 390,800 | 1,088,900 | 90,600 | 28,500 | 193,600 | 851,900 | 419,400 | 1,282,500 |
Figure 1 .

Population-standardized alcohol-attributable deaths per 100,000 people by GBD region for men.
Figure 2 .
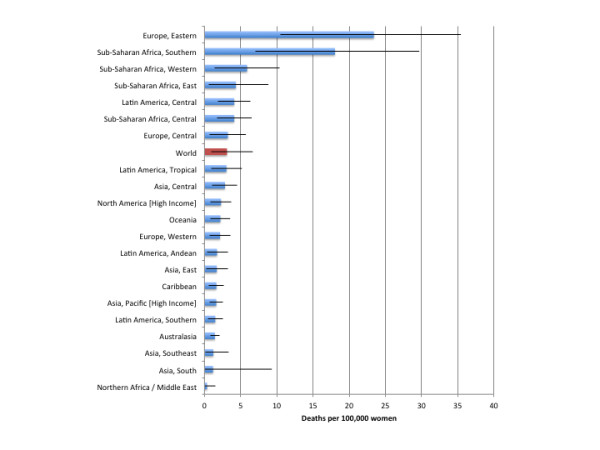
Population-standardized alcohol-attributable deaths per 100,000 people by GBD region for women.
Globally, in 2004, 19,051,000 (95% CI: 9,767,000 to 28,243,000) PYLL or 320.1 (95% CI: 161.1 to 477.9) PYLL per 100,000 people were caused by injuries attributable to alcohol consumption, of which 5,989,300 (95% CI: 3,788,700 to 8,423,600) were caused by harms to others. Alcohol-attributable injuries accounted for 2.02% (95% CI: 1.03% to 2.99%) PYLL and 14.54% (95% CI: 7.45% to 21.55%) of all PYLL caused by injuries worldwide. Table 4 outlines estimates of the PYLL attributable to alcohol consumption by region and sex for 2004. Figures 3 and 4 outline the burden of injuries in PYLL per 100,000 people for men and women, respectively. Alcohol-attributable injury PYLL among men were far in excess of the estimates calculated for women, with 605.8 (95% CI: 317.9 to 860.0) PYLL per 100,000 men (3.29% [95% CI: 1.76% to 4.65%] of all PYLL and 19.11% [95% CI: 10.22% to 26.95%] of all PYLL caused by injuries for men) compared to 59.9 (95% CI: 19.4 to 126.7) PYLL per 100,000 women (0.48% [95% CI: 0.16% to 1.00%] of all PYLL and 4.92% [95% CI: 1.62% to 10.20%] of all PYLL caused by injuries for women). Eastern Europe had the highest burden in terms of PYLL for men and women, with 6,003.8 (95% CI: 3813.4 to 6785.6) PYLL per 100,000 men and 499.1 (95% CI: 236.1 to738.2) PYLL per 100,000 women. North Africa/Middle East had the lowest burden of PYLL, with 107.3 (95% CI: 22.9 to 282.9) PYLL per 100,000 men and 7.8 (95% CI: 0.0 to 160) PYLL per 100,000 women.
Table 4.
Alcohol-attributable PYLL caused by injuries by Global Burden of Disease region for 2004
| |
Men |
Women |
Total |
||||||
|---|---|---|---|---|---|---|---|---|---|
| Point estimate | Lower 95% confidence interval | Upper 95% confidence interval | Point estimate | Lower 95% confidence interval | Upper 95% confidence interval | Point estimate | Lower 95% confidence interval | Upper 95% confidence interval | |
| Asia, Pacific [High Income] |
274,300 |
138,300 |
410,300 |
24,800 |
10,100 |
39,500 |
299,100 |
148,400 |
449,700 |
| Asia, Central |
200,500 |
116,000 |
284,900 |
23,900 |
9,800 |
37,900 |
224,300 |
125,700 |
322,900 |
| Asia, East |
1,511,900 |
775,000 |
2,248,800 |
212,600 |
42,000 |
400,600 |
1,724,500 |
817,000 |
2,649,400 |
| Asia, South |
1,670,100 |
520,100 |
3,086,300 |
167,100 |
7,300 |
1,049,400 |
1,837,200 |
527,400 |
4,135,800 |
| Asia, Southeast |
799,800 |
310,200 |
1,316,400 |
78,100 |
7,900 |
208,300 |
878,000 |
318,100 |
1,524,600 |
| Australasia |
24,400 |
13,200 |
35,500 |
3,100 |
1,800 |
4,300 |
27,400 |
15,000 |
39,800 |
| Caribbean |
55,100 |
32,400 |
77,800 |
8,100 |
3,100 |
13,200 |
63,300 |
35,500 |
91,000 |
| Europe, Central |
494,400 |
258,900 |
693,600 |
43,800 |
11,000 |
76,600 |
538,300 |
269,900 |
770,200 |
| Europe, Eastern |
5,699,200 |
3,622,900 |
6,438,200 |
632,500 |
296,200 |
939,000 |
6,331,700 |
3,919,100 |
7,377,200 |
| Europe, Western |
520,300 |
274,000 |
766,500 |
64,400 |
19,400 |
109,500 |
584,700 |
293,400 |
875,900 |
| Latin America, Andean |
90,000 |
40,600 |
139,400 |
9,500 |
2,600 |
17,700 |
99,500 |
43,200 |
157,100 |
| Latin America, Central |
984,400 |
624,100 |
1,344,600 |
106,500 |
52,800 |
162,500 |
1,090,900 |
676,900 |
1,507,100 |
| Latin America, Southern |
87,300 |
45,000 |
129,700 |
8,000 |
2,700 |
13,500 |
95,300 |
47,700 |
143,200 |
| Latin America, Tropical |
926,900 |
504,500 |
1,349,400 |
82,000 |
30,700 |
134,600 |
1,008,900 |
535,200 |
1,484,000 |
| Northern Africa / Middle East |
219,500 |
47,000 |
587,600 |
18,800 |
0 |
76,900 |
238,300 |
47,000 |
664,500 |
| North America [High Income] |
610,100 |
324,400 |
895,800 |
89,600 |
34,500 |
144,700 |
699,700 |
358,900 |
1,040,500 |
| Oceania |
11,400 |
7,400 |
15,400 |
2,000 |
800 |
3,200 |
13,400 |
8,200 |
18,600 |
| Sub-Saharan Africa, Central |
259,500 |
171,000 |
348,100 |
40,400 |
17,300 |
63,600 |
299,900 |
188,200 |
411,600 |
| Sub-Saharan Africa, East |
785,900 |
344,300 |
1,230,700 |
138,700 |
24,800 |
268,400 |
924,700 |
369,100 |
1,499,100 |
| Sub-Saharan Africa, Southern |
882,400 |
473,800 |
1,245,100 |
146,600 |
61,600 |
236,100 |
1,029,100 |
535,400 |
1,481,200 |
| Sub-Saharan Africa, Western |
865,800 |
439,200 |
1,292,300 |
176,900 |
48,300 |
306,800 |
1,042,700 |
487,500 |
1,599,100 |
| World | 16,973,000 | 9,082,000 | 23,936,000 | 2,078,000 | 685,000 | 4,306,000 | 19,051,000 | 9,767,000 | 28,243,000 |
Figure 3 .
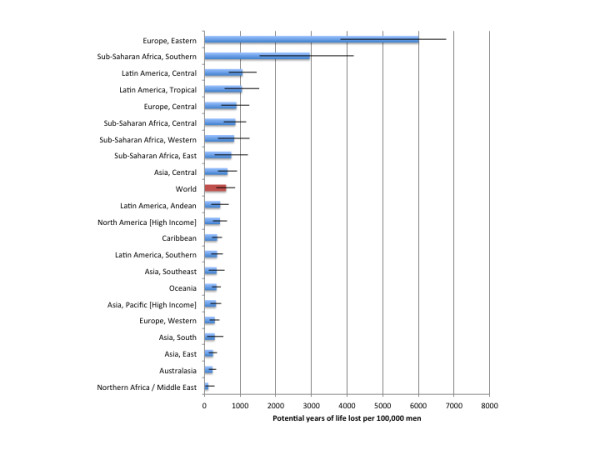
Population-standardized alcohol-attributable potential years of life lost per 100,000 people by GBD region for men.
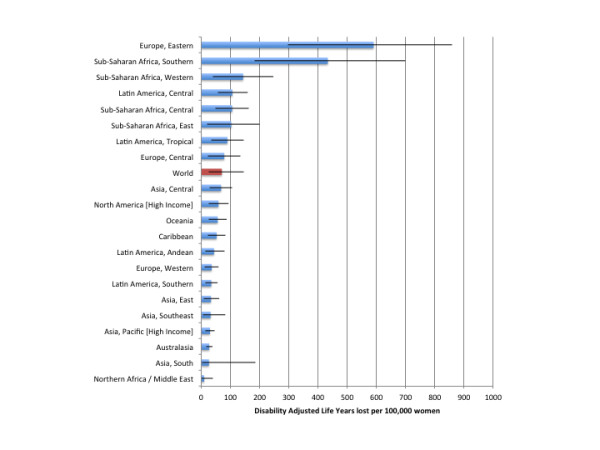
Figure 4 .
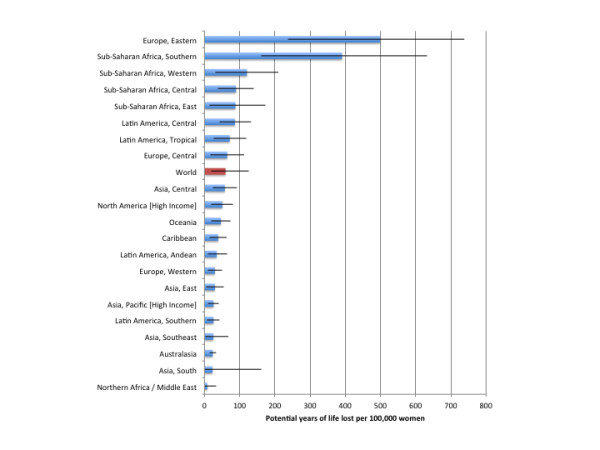
Population-standardized alcohol-attributable potential years of life lost per 100,000 people by GBD region for women.
In 2004, alcohol-attributable injuries accounted for 21,668,000 (95% CI: 11,097,000 to 32,385,000) DALYs, of which 6,917,300 (95% CI: 4,396,000 to 9,731,100) were caused by alcohol-attributable injuries caused by others. Alcohol-attributable injuries in 2004 accounted for 1.40% (95% CI: 0.71% to 2.09%) of all DALYs and 11.35% (95% CI: 5.81% to 16.96%) of DALYs caused by injuries among men and women. Table 5 outlines estimates of the DALYs attributable to alcohol consumption by region and by sex for 2004. Figures 5 and 6 outline the burden of injuries in DALYs per 100,000 people for men and women, respectively. Alcohol accounted for 681.8 (95% CI: 354.8 to977.9) DALYs per 100,000 men and 70.4 (95% CI: 25.3 to 146.4) DALYs per 100,000 women. Eastern Europe had the highest DALYs per 100,000 people, with 6,561.7 (95% CI: 4191.3 to 7523.2) DALYs per 100,000 men and 590.2 (95% CI: 296.3 to 860.0) DALYs per 100,000 women. The North Africa/Middle East region was estimated to have the lowest alcohol-attributable injury DALYs worldwide, with 138.5 (95% CI: 22.2 to 364.1) DALYs per 100,000 men and 9.9 (95% CI: 1.1 to 40.6) DALYs per 100,000 women. An outline of the alcohol-attributable years of life lived with disability is provided in Additional file 6.
Table 5.
Alcohol-attributable DALYs caused by injuries by Global Burden of Disease region for 2004
| |
Men |
Women |
Total |
||||||
|---|---|---|---|---|---|---|---|---|---|
| Point estimate | Lower 95% confidence interval | Upper 95% confidence interval | Point estimate | Lower 95% confidence interval | Upper 95% confidence interval | Point estimate | Lower 95% confidence interval | Upper 95% confidence interval | |
| Asia, Pacific [High Income] |
301,300 |
152,000 |
450,600 |
28,900 |
12,500 |
45,300 |
330,200 |
164,500 |
495,900 |
| Asia, Central |
230,300 |
131,200 |
329,300 |
28,400 |
12,600 |
44,100 |
258,600 |
143,900 |
373,400 |
| Asia, East |
1,690,700 |
858,200 |
2,523,100 |
240,200 |
56,100 |
443,700 |
1,930,900 |
914,300 |
2,966,800 |
| Asia, South |
1,918,200 |
586,800 |
3,558,600 |
198,700 |
26,800 |
1,215,700 |
2,117,000 |
613,600 |
4,774,200 |
| Asia, Southeast |
902,500 |
347,700 |
1,489,100 |
102,700 |
23,300 |
255,600 |
1,005,200 |
371,000 |
1,744,700 |
| Australasia |
26,900 |
14,500 |
39,200 |
3,600 |
2,100 |
5,100 |
30,500 |
16,600 |
44,300 |
| Caribbean |
69,300 |
40,300 |
98,300 |
11,200 |
4,800 |
17,600 |
80,500 |
45,100 |
115,900 |
| Europe, Central |
578,300 |
300,000 |
820,200 |
53,400 |
14,900 |
92,000 |
631,700 |
314,900 |
912,100 |
| Europe, Eastern |
6,227,900 |
3,981,100 |
7,137,100 |
745,100 |
369,700 |
1,090,500 |
6,972,900 |
4,350,800 |
8,227,600 |
| Europe, Western |
587,200 |
307,300 |
867,200 |
77,700 |
25,000 |
130,300 |
664,900 |
332,300 |
997,500 |
| Latin America, Andean |
109,000 |
48,300 |
169,600 |
12,200 |
4,000 |
22,200 |
121,200 |
52,400 |
191,800 |
| Latin America, Central |
1,193,900 |
743,100 |
1,644,600 |
133,300 |
71,500 |
198,300 |
1,327,200 |
814,600 |
1,842,900 |
| Latin America, Southern |
108,000 |
56,400 |
159,600 |
10,900 |
4,400 |
17,600 |
118,800 |
60,800 |
177,100 |
| Latin America, Tropical |
1,128,000 |
606,700 |
1,649,300 |
103,400 |
42,700 |
166,100 |
1,231,400 |
649,400 |
1,815,400 |
| Northern Africa / Middle East |
284,800 |
52,200 |
758,300 |
24,400 |
3,100 |
94,700 |
309,200 |
55,300 |
853,000 |
| North America [High Income] |
678,700 |
359,500 |
997,800 |
104,000 |
42,900 |
165,100 |
782,700 |
402,500 |
1,162,900 |
| Oceania |
12,500 |
8,000 |
17,000 |
2,500 |
1,200 |
3,800 |
15,000 |
9,200 |
20,800 |
| Sub-Saharan Africa, Central |
292,700 |
191,400 |
394,000 |
48,400 |
22,900 |
73,800 |
341,100 |
214,400 |
467,800 |
| Sub-Saharan Africa, East |
895,900 |
386,700 |
1,408,500 |
163,400 |
37,700 |
307,800 |
1,059,300 |
424,400 |
1,716,300 |
| Sub-Saharan Africa, Southern |
966,400 |
511,300 |
1,367,100 |
165,100 |
72,300 |
263,800 |
1,131,600 |
583,600 |
1,630,800 |
| Sub-Saharan Africa, Western |
997,300 |
499,500 |
1,495,200 |
210,600 |
64,500 |
358,000 |
1,207,900 |
563,900 |
1,853,100 |
| World | 19,200,000 | 10,182,000 | 27,374,000 | 2,468,000 | 915,000 | 5,011,000 | 21,668,000 | 11,097,000 | 32,385,000 |
Figure 5 .
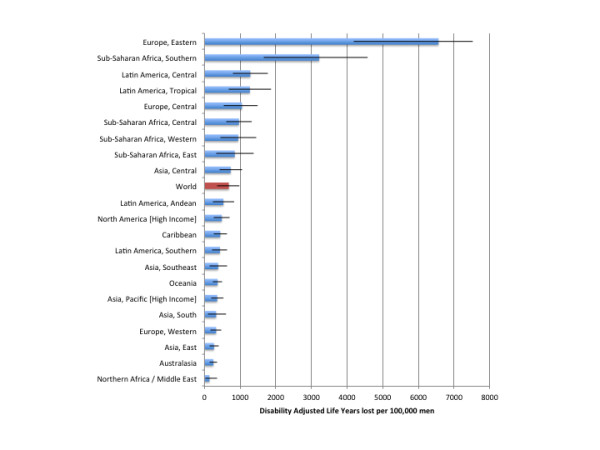
Population-standardized alcohol-attributable disability-adjusted years of life lost per 100,000 people by GBD region for men.
Figure 6 .
Population-standardized alcohol-attributable disability-adjusted years of life lost per 100,000 people by GBD region for women.
Discussion
Alcohol is a substantial risk factor for the global burden of injuries in terms of death, PYLL, and DALYs. We found that this burden of injuries for 2004 varied by region corresponding with drinking prevalence: those regions exhibiting a low prevalence of current drinkers, such as in North Africa/Middle East and Southern Asia, carried a relatively low burden of injuries attributable to alcohol. This can be contrasted with Eastern Europe, where drinking prevalence, binge drinking, and the burden due to alcohol-attributable injury were all high.
Before we discuss the implications of these findings, the potential weaknesses associated with this analysis should be discussed in detail. First, quantification of the global burden using insurance and police records, which would provide the most accurate data, appears not to be possible as no such reporting system exists [29]. Second, there are limitations regarding the quality of global mortality data (see [27]). For most of the world, there are no vital registries, i.e., there is scarce or no available information on causes of death. In these instances, data on the missing causes of death have to be statistically estimated [28,30,31]. Although we do not incorporate the variation of the mortality estimates in these countries into our analysis, estimations by the WHO/GBD of the number of deaths in countries where little or no data are available increase the uncertainty of our estimates of the number of deaths, PYLL, and DALYs attributable to alcohol consumption [27]. Third, there are weaknesses associated with the assumptions made in the calculation of the DALYs (see [32]), particularly the calculation of weights for DALYs, although these assumptions have been shown to exert only a minor effect on the variation of DALY estimates for injuries [27]. Fourth, alcohol consumption variables used in our analysis came from population surveys which have limitations with respect to coverage, and the survey instruments involved commonly have inherent biases due to self-reporting of data, leading to an underestimation of level of drinking and number of binge drinkers [33]. While the distribution of average volume of alcohol consumption can be adjusted for the amount of alcohol actually consumed [34], there is currently no methodology to correct the underestimation of irregular binge drinking [35], thereby causing an underestimation of the global burden of injuries attributable to alcohol consumption.
Our study is further limited by the use of the RR for all nonmotor vehicle accident injuries. We suspect that the risk relationship may change by injury type, but the body of research relating alcohol consumption to injury is relatively sparse (except with respect to motor vehicle accidents), meaning that meta-analytic techniques used to generate stable risk curves are not usable due to a scarcity of data points. This is especially important for alcohol consumption and resulting intentional and unintentional nonmotor vehicle accident injuries, due to alcohol playing a very different role in intentional and unintentional nonmotor vehicle accident injuries [6]. However, the risk estimates for intentional and unintentional injuries were not stable in the meta-analyses performed by Taylor and colleagues and, thus, were combined [6]. The resulting aggregate RR showed little heterogeneity among studies that examined intentional and unintentional nonmotor vehicle accident injuries [6]. Additionally, although not taken into consideration in our analysis, previous research has suggested that the RRs for injury may be dependent upon previous alcohol consumption patterns, with heavy consumers of alcohol at a lower risk than those people who do not frequently consume large amounts of alcohol [36-38].
Our study is limited also by the information on harms to others available in the literature; we used data from Australia to model harms to others. Because of limited data, we were unable to determine if a linear relationship exists between the AAFs for motor vehicle accident injuries to passengers, pedestrians, and drivers who did not cause the accident and the AAFs for motor vehicle accident deaths to drivers who caused the accident. We were also unable to quantify the relationship between age-specific AAFs for assaults and population AAFs for assaults. This lack of data leads to two different formulas being used for AAFs for motor vehicle accidents caused to others and for AAFs for assaults; the AAFs for assaults were calculated assuming a linear relationship, and the AAFs for motor vehicle accidents caused to others had to be log transformed. Log transformation of the AAFs for motor vehicle accidents caused to others was required in order to keep the resulting total AAFs within the boundaries of 0 and 1. In the case of the AAFs for assaults, log transformation was not necessary since the age-specific AAFs were very similar.
Regardless of these limitations, the method of calculating the burden of injury attributable to alcohol consumption presented in this article is an improvement on previous methods used to calculate the alcohol-attributable burden. For the first time at a global level the burden of alcohol-attributable injuries has been estimated using consumption data and RRs, and alcohol-related harms to others have been calculated.
Conclusion
Given the severity of the alcohol-attributable burden of injuries and the expectation that it will increase in developing countries [39,40], it is imperative to accurately characterize this burden and develop strategies aimed at reducing it. This article presents a new method to calculate the burden of disease attributable to alcohol consumption and is an improvement over previous methods. Additionally, given the size of the estimated alcohol-attributable burden of injuries, strategies aimed at reducing this burden should target two key areas of concern: 1) the need to decrease the harmful consumption of alcohol, by methods such as regulating the availability of alcohol [41], and 2) the need to decrease the frequency of drunk driving by, for example, lowering the maximum allowable blood alcohol concentration level for driving, especially in the case of younger drivers [36].
Additional files
Competing interests
The authors have declared that no competing interests exist.
Authors’ contributions
Kevin Shield and Jürgen Rehm conceptualized the overall article. Kevin Shield, Gerrit Gmel, Jayadeep Patra, and Jürgen Rehm contributed to the methodology, identified sources for risk relations and exposure, and contributed to the writing. Kevin Shield performed all statistical analyses. All authors have approved the final version.
Supplementary Material
Alcohol-attributable injury caused by harms to others by global burden of disease region.
Alcohol-Attributable Fractions for injuries.
Alcohol-Attributable Fractions for injuries.
Deaths from injuries attributable to alcohol consumption.
Deaths from injuries attributable to alcohol consumption.
Population-standardized alcohol-attributable years of life lived with disability per 100,000 people by GBD region for men and women.
Contributor Information
Kevin D Shield, Email: kevin.shield@utoronto.ca.
Gerrit Gmel, Email: gerrit.gmel@gmail.com.
Jayadeep Patra, Email: jaydeep.patra@gmail.com.
Jürgen Rehm, Email: jtrehm@aol.com.
Acknowledgments
This work was supported by financial support provided to the last author listed above by the National Institute for Alcohol Abuse and Alcoholism (NIAAA) with contract # HHSN267200700041C to conduct the study titled “Alcohol- and Drug-attributable Burden of Disease and Injury in the US.” In addition, the last author received a salary and infrastructure support from the Ontario Ministry of Health and Long-Term Care.
References
- World Health Organization: Global Health Risks. Mortality and burden of disease attributable to selected major risks. World Health, Geneva, Switzerland; 2009. [Google Scholar]
- Rehm J, Mathers C, Popova S, Thavorncharoensap M, Teerawattananon Y, Patra J. Global burden of disease and injury and economic cost attributable to alcohol use and alcohol use disorders. Lancet. 2009;373:2223–2233. doi: 10.1016/S0140-6736(09)60746-7. [DOI] [PubMed] [Google Scholar]
- Ivers RQ, Blows SJ, Stevenson MR, Norton RN, Williamson A, Eisenbruch M, Woodward M, Lam L, Palamara P, Wang J. A cohort study of 20,822 young drivers: the DRIVE study methods and population. Injury Prevention. 2006;12:385–389. doi: 10.1136/ip.2006.011825. [DOI] [PMC free article] [PubMed] [Google Scholar]
- Vinson DC, Maclure M, Reidinger C, Smith GS. A population-based case-crossover and case–control study of alcohol and the risk of injury. J Stud Alcohol. 2003;64:358–366. doi: 10.15288/jsa.2003.64.358. [DOI] [PubMed] [Google Scholar]
- Peck RC, Gebers MA, Voas RB, Romano E. The relationship between blood alcohol concentration (BAC) and crash risk. J Safety Res. 2008;39:311–319. doi: 10.1016/j.jsr.2008.02.030. [DOI] [PubMed] [Google Scholar]
- Taylor B, Irving HM, Kanteres F, Room R, Borges G, Cherpitel C, Greenfield T, Rehm J. The more you drink, the harder you fall: a systematic review and meta-analysis of how acute alcohol consumption and injury or collision risk increase together. Drug Alcohol Depend. 2010;110:108–116. doi: 10.1016/j.drugalcdep.2010.02.011. [DOI] [PMC free article] [PubMed] [Google Scholar]
- Cherpitel CJ. Alcohol and injuries: a review of international emergency room studies since 1995. Drug Alcohol Rev. 2007;26:201–214. doi: 10.1080/09595230601146686. [DOI] [PubMed] [Google Scholar]
- Rehm J, Gmel G, Sempos C, Trevisan M. Alcohol-related mortality and morbidity. Alcohol Res Health. 2003;27:39–51. [PMC free article] [PubMed] [Google Scholar]
- Rehm J, Room R, Monteiro M, Gmel G, Graham K, Rehn N, Sempos CT, Frick U, Jernigan D. In: Comparative quantification of health risks: global and regional burden of disease attributable to selected major risk factors. Ezzati M, Lopez AD, Rodgers A, Murray CJL, editor. WHO, Geneva; 2004. Alcohol Use; pp. 959–1109. Volume 1. [Google Scholar]
- Navarro HJ, Doran CM, Shakeshaft AP. Measuring costs of alcohol harm to others: A review of the literature. Drug Alcohol Depend. 2011;114:97–99. doi: 10.1016/j.drugalcdep.2010.11.009. [DOI] [PubMed] [Google Scholar]
- Laslett AM, Catalano P, Chikritzhs T, Dale C, Doran C, Ferris J, Jainullabudeen TA, Livingston M, Matthews S, Mugavin J, Room R, Schlotterlein M, Wilkinson C. The range and magnitue of alcohol's harm to others. Alcohol Education and Rehabilitation Foundation, Deakin West, Australia; 2010. [Google Scholar]
- Taylor B, Shield K, Rehm J. Combining best evidence: A novel method to calculate the alcohol-attributable fraction and its variance for injury mortality. BMC Publ Health. 2011;11:265. doi: 10.1186/1471-2458-11-265. [DOI] [PMC free article] [PubMed] [Google Scholar]
- Borkenstein R, Crowther R, Shumate R, Ziel W, Zylman R. The role of the drinking driver in traffic accidents. Department of Police Administration, Indiana University, Indiana, USA; 1964. [Google Scholar]
- Anda RF, Williamson DF, Remington PL. Alcohol and fatal injuries among US adults.Findings from the NHANES I Epidemiologic Follow-up Study. JAMA. 1988;260:2529–2532. doi: 10.1001/jama.1988.03410170077037. [DOI] [PubMed] [Google Scholar]
- Cherpitel CJ, Bond J, Ye Y, Borges G, Room R, Poznyak V, Hao W. Multi-level analysis of causal attribution of injury to alcohol and modifying effects: Data from two international emergency room projects. Drug Alcohol Depend. 2006;82:258–268. doi: 10.1016/j.drugalcdep.2005.10.002. [DOI] [PubMed] [Google Scholar]
- Lin MR, Chang SH, Pai L, Keyl PM. A longitudinal study of risk factors for motorcycle crashes among junior college students in Taiwan. Accid Anal Prev. 2003;35:243–252. doi: 10.1016/S0001-4575(02)00002-7. [DOI] [PubMed] [Google Scholar]
- Fabbri A, Marchesini G, Morselli-Labate AM, Rossi F, Cicognani A, Dente M, Iervese T, Ruggeri S, Mengozzi U, Vandelli A. Blood alcohol concentration and management of road trauma patients in the emergency department. J Trauma. 2001;50:521–528. doi: 10.1097/00005373-200103000-00018. [DOI] [PubMed] [Google Scholar]
- Kasantikul V, Ouellet JV, Smith T, Sirathranont J, Panichabhongse V. The role of alcohol in Thailand motorcycle crashes. Accid Anal Prev. 2005;37:357–366. doi: 10.1016/j.aap.2004.07.006. [DOI] [PubMed] [Google Scholar]
- Institute for Health Metrics and Evaluation. Global Burden of Diseases: injuries and risk factors study operations manual. Institute for Health Metrics and Evaluation, Seattle, WA; 2010. [Google Scholar]
- United Nations Populations Division. World populations prospects - the 2008 revision. United Nations, New York, USA; 2010. [Google Scholar]
- Rehm J, Klotsche J, Patra J. Comparative quantification of alcohol exposure as risk factor for global burden of disease. Int J Methods Psychiatr Res. 2007;16:66–76. doi: 10.1002/mpr.204. [DOI] [PMC free article] [PubMed] [Google Scholar]
- World Health Organization. Global Information System on Alcohol and Health. World Health Organization, Geneva, Switzerland; 2010. http://apps.who.int/globalatlas/default.asp. [Google Scholar]
- Gmel Gj, Shield K, Frick H, Kehoe T, Gmel Gs, Rehm J. Estimating uncertainty for alcohol-attributable fractions for infectious and chronic disease. BMC Medical Research Methodology. 2011;11:48. doi: 10.1186/1471-2288-11-48. [DOI] [PMC free article] [PubMed] [Google Scholar]
- Cherpitel C. Alcohol in fatal and nonfatal injuries: a comparison of coroner and emergency room data from the same country. Alcohol Clin Exp Res. 1996;20:338–342. doi: 10.1111/j.1530-0277.1996.tb01649.x. [DOI] [PubMed] [Google Scholar]
- Cherpitel C. Alcohol and casualties: a comparison of emergency room and coroner data. Alcohol Alcohol. 1994;29:211–218. [PubMed] [Google Scholar]
- World Health Organization. The global burden of disease: 2004 update. World Health Organization, Geneva, Switzerland; 2008. [Google Scholar]
- Lopez AD, Mathers CD, Ezzati M, Jamison DT, Murray CJL. Global burden of disease and risk factors. The World Band and Oxford University Press, New York & Washington; 2006. [PubMed] [Google Scholar]
- Lopez AD, Mathers CD, Ezzati M, Jamison DT, Murray CJL. Global and regional burden of disease and risk factors, 2001: Systematic analysis of population health data. Lancet. 2006;367:1747–1757. doi: 10.1016/S0140-6736(06)68770-9. [DOI] [PubMed] [Google Scholar]
- Rehm J, Baliunas D, Borges GLG, Graham K, Irving HM, Kehoe T, Parry CD, Patra J, Popova L, Poznyak V, Roerecke M, Room R, Samokhvalov AV, Taylor B. The relation between different dimensions of alcohol consumption and burden of disease - An overview. Addiction. 2010;105:817–843. doi: 10.1111/j.1360-0443.2010.02899.x. [DOI] [PMC free article] [PubMed] [Google Scholar]
- Murray CJL, Lopez A. Mortality by cause for eight regions of the world: Global burden of disease study. Lancet. 1997;349:1269–1276. doi: 10.1016/S0140-6736(96)07493-4. [DOI] [PubMed] [Google Scholar]
- Mathers CD, Boerma T, MaFat D. Global and regional causes of death. Br Med Bull. 2009;92:7–32. doi: 10.1093/bmb/ldp028. [DOI] [PubMed] [Google Scholar]
- Rehm J, Frick U. Valuation of health states in the U.S. study to establish disability weights: lessons from the literature. Int J Methods Psychiatr Res. 2010;19:18–33. doi: 10.1002/mpr.300. [DOI] [PMC free article] [PubMed] [Google Scholar]
- Shield K, Rehm J. Difficulties with telephone-based surveys on alcohol in high-income countries: the Canadian example. International Journal of Methods in Psychiatric Research. in press. [DOI] [PMC free article] [PubMed]
- Rehm J, Kehoe T, Gmel G, Stinson F, Grant B, Gmel G. Statistical modeling of volume of alcohol exposure for epidemiological studies of population health: the example of the US. Popul Health Metr. 2010;8:3. doi: 10.1186/1478-7954-8-3. [DOI] [PMC free article] [PubMed] [Google Scholar]
- Gmel G, Kuntsche E, Rehm J. Risky single occasion drinking: bingeing is not bingeing. Addiction. 2011;106:1037–1045. doi: 10.1111/j.1360-0443.2010.03167.x. [DOI] [PubMed] [Google Scholar]
- Moskowitz H, Burns M, Fiorentino D, Smiley A, Zador P. Driver characteristics and impairment at various BACs. U.S. Department of Transportation, Washington, US; 2000. [Google Scholar]
- Krüger HP, Kazenwadel J, Vollrath M. Alcohol, Drugs, and traffic safety: proceedings of the 13th International Conference on Alcohol, Drugs and Traffic Safety, Adelaide. NHMRC Road Accident Research Unit, Adelaide; 1995. Grand Rapids effects revisited: accidents, alcohol and risk; pp. 222–230. Edited by Kloeden CN, McLean AJ.: University of Adelaide. [Google Scholar]
- Committee on Alcohol, O.D.a.T. Low blood alcohol concentrations: scientific and policy issues. Transportation Research Board, Washington, US; 2001. [Google Scholar]
- Nantulya VM, Reich MR. The neglected epidemic: road traffic injuries in developing countries. BMJ. 2002;7346:1139–1141. doi: 10.1136/bmj.324.7346.1139. [DOI] [PMC free article] [PubMed] [Google Scholar]
- Smith GS, Barss P. Unintentional injuries in developing countries: the epidemiology of a neglected problem. Epidemiologic Reviews. 1991;13:228–266. doi: 10.1093/oxfordjournals.epirev.a036070. [DOI] [PubMed] [Google Scholar]
- Babor T, Caetano R, Casswell S, Edwards G, Giesbrecht N, Graham K, Grube J, Gruenewald P, Hill L, Holder H, Homel R, Livingston M, Osterberg E, Rehm J, Room R, Rossow I. Alcohol: No ordinary commodity. Research and public policy. 2. Oxford University Press, Oxford and London; 2010. [Google Scholar]
Associated Data
This section collects any data citations, data availability statements, or supplementary materials included in this article.
Supplementary Materials
Alcohol-attributable injury caused by harms to others by global burden of disease region.
Alcohol-Attributable Fractions for injuries.
Alcohol-Attributable Fractions for injuries.
Deaths from injuries attributable to alcohol consumption.
Deaths from injuries attributable to alcohol consumption.
Population-standardized alcohol-attributable years of life lived with disability per 100,000 people by GBD region for men and women.