

Abstract
In this study we describe the use of ultrashort echo time (UTE) magnetic resonance imaging (MRI) to evaluate short and long T2* components as well as the water content of cortical bone. Fourteen human cadaveric distal femur and proximal tibia were sectioned to produce 44 rectangular slabs of cortical bone for quantitative UTE MR imaging, micro computed tomography (μCT), and biomechanical testing. A two-dimensional (2D) UTE pulse sequence with a minimal nominal TE of 8 μs was used together with bi-component analysis to quantify the bound and free water in cortical bone using a clinical 3T scanner. Total water concentration was measured using a 3D UTE sequence together with a reference water phantom. UTE MR measures of water content (total, free and bound), T2* (short and long), and short and long T2* fractions were compared to porosity assessed with μCT, as well as elastic (modulus, yield stress and strain) and failure (ultimate stress, failure strain and energy) properties, using Pearson correlation. Porosity significantly correlated positively with total (R2=0.23; P<0.01) and free (R2=0.31; P<0.001) water content as well as long T2* fraction (R2=0.25; P<0.001), and negatively with short T2* fraction and short T2* (R2=0.24; P<0.01). Failure strain significantly correlated positively with short T2* (R2=0.29; P<0.001), ultimate stress significantly correlated negatively with total (R2=0.25; P<0.001) and bound (R2=0.22; P<0.01) water content, and failure energy significantly correlated positively with both short (R2=0.30; P<0.001) and long (R2=0.17; P<0.01) T2* values. These results suggest that UTE MR measures are sensitive to the structure and failure properties of human cortical bone, and may provide a novel way of evaluating cortical bone quality.
Keywords: Ultrashort TE, bi-component analysis, free water, bound water, porosity, biomechanical properties
INTRODUCTION
Mature bone is composed of mineral (~65% by weight), organic matrix (~10%) and water (~25%) (1). While the loss of bone mineral has been regarded as the major cause of age-related bone fractures (2–4), there is mounting evidence that age and disease related changes in organic matrix, structure and water content are also important etiologic factors (5–9). Bone mineral predominantly contributes to stiffness and strength (10), collagen provides ductility and the ability to absorb energy before fracturing (9, 11–13), and water contributes to hierarchical poroelasticity (14).
Water is present at various locations and in different states in cortical bone. Free water is present in the microscopic pores of the Haversian and lacunocanalicular systems (15, 16). Bound water is associated with collagen and the matrix substrate, and very tightly bound water is present within the crystals of the apatite-like mineral of bone. The free water fraction and concentration in bone potentially provide surrogate measures of bone porosity (16–19), while the bound water fraction and concentration reflect organic matrix density (20–22). Recently multi-component analysis of free induction decay (FID) or Carr-Purcell-Meiboon-Gill (CPMG) spin echo data has been used to provide T2* or T2 spectra reflecting bound (short T2* or T2) and free (longer T2* or T2) water components (20–24). A strong correlation (R2 = 0.72) was observed between porosity derived from MR analysis of the long T2 component and porosity assessed by histomorphometry (22). However, these techniques can only be applied to small bone samples and require the use of a high performance NMR spectrometer, and are therefore not suitable for clinical examinations.
MR imaging provides non-invasive assessment of protons in soft tissues, but cortical bone has a very short T2* and appears as a signal void on images obtained with all routine clinical pulse sequences (25). Several groups have reported techniques employing short or ultrashort TEs which detect signal from bone 25–31. Our recent data indicate that UTE sequences detect both less tightly bound and free water signals (32–34). We have found that the T2* of bound water detected in this way is about 10 times shorter than that of free water (33, 34). This marked difference makes it possible to use a bi-component model to quantify the relative fractions and concentrations of both UTE detected bound and free water, and has allowed us to assess organic matrix via bound water and bone porosity via free water using a clinical MR scanner for the first time.
The biomechanical integrity of cortical bone is of major interest, especially failure properties that have clinical significance in relation to fractures. To evaluate the biomechanical properties of bone, specimens can be prepared and tested using classical mechanical engineering techniques. These include uniaxial tensile (35) and bending tests (36). While tensile testing is accurate and straightforward to analyze, it requires relatively large specimen which need to be carefully machined to a tapered shape (37). Bending tests using 3- or 4-points of contact are useful for samples of uniform cross-section. These can be performed on smaller specimens with simple beam shapes (38). Bending tests have been used to show the relationship between water content of cortical long-bones in animals (39) and humans (40) and ultimate stress. They are likely to be of value in assessing the status of osteoporotic bone as well.
In this study we aimed to evaluate the bound and free water components in cadaveric human cortical bone using UTE bi-component analysis on a clinical 3T whole-body scanner, and correlate the results with porosity determined by micro computed tomography (μCT) and biomechanical properties determined by 4-point bending test.
MATERIALS AND METHODS
Sample Preparation
Fresh human distal femur and tibia samples from 14 donors (7 males, 7 females; age range = 23–90 years, 58.4 ± 21.8 years old, mean ± standard deviation) were obtained from tissue banks, as approved by Institutional Review Board. Using a precision circular diamond-edge saw (ISOMET 1000, Buehler, Lake Bluff, IL) and saline irrigation, larger bone blocks were sectioned into 44 rectangular slabs of cortical bone with average dimensions of 41.4 × 3.45 × 1.63 mm3 (L×W×H), measured with a digital caliper (±0.0005″ precision). Individual samples were wrapped in saline-wet gauze and frozen at −70 °C in an ultralow freezer (Bio-Freezer; Forma Scientific, Marietta, OH, USA). The samples were allowed to thaw for 12 hours at 4 °C prior to MR imaging, μCT, and biomechanical testing.
UTE MR Imaging
A General Electric 3T Signa HDx MR scanner (GE Healthcare, Milwaukee, MI) with peak gradient amplitude of 40 mT/m and maximum gradient slew rate of 150 mT/m/s was used for data acquisition. Hardware modification included the addition of a custom Transmit-Receive (T/R) switch to the receiver pre-amplifiers for rapid switching at the end of a radiofrequency (RF) excitation pulse to allow UTE imaging. In addition, a home-made 1-inch diameter birdcage T/R coil was used for signal excitation and reception.
Both non-slice selective 2D and 3D UTE sequences (Figure 1) were implemented on the GE 3T whole body scanner. The 2D UTE sequence was used for bi-component analysis, while the 3D UTE sequence was used for total bone water content measurement. The 2D UTE sequence employed a hard rectangular RF pulse (duration = 32 μs), which together with 2D radial ramp sampling and fast T/R switching enabled use of a very short nominal TE (8 μs) defined as the time between the end of hard RF excitation and the beginning of free induction decay (FID) data acquisition (19). We used a short rectangular pulse for the non-slice selective 2D excitation in order to enhance signal to noise ratio (SNR), and to eliminate errors due to eddy currents associated with the gradient pulses used with conventional half-pulse excitation. The 3D UTE sequence employed a short rectangular pulse (duration = 32 μs) for non-selective excitation followed by 3D radial ramp sampling (27). Since a short rectangular pulse was used for signal excitation, and the number of excitations (NEX) was one for both the 2D and 3D UTE sequences. The cortical bone samples were placed in perfluorooctyl bromide (PFOB) solution to minimize susceptibility effects at air-bone junctions.
Figure 1.
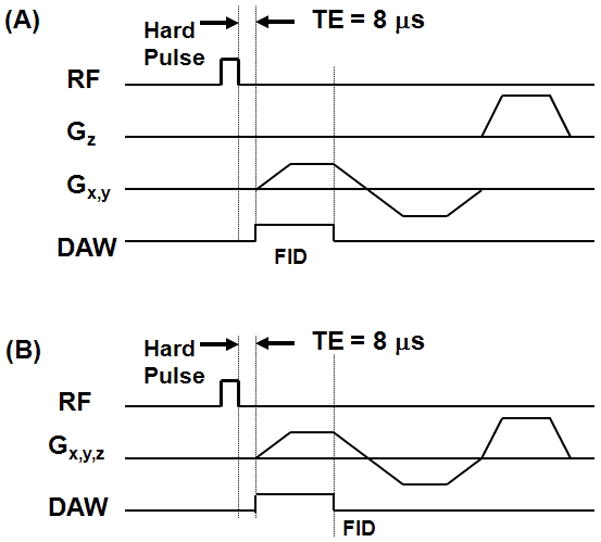
UTE pulse sequence diagrams: non-slice selective 2D UTE with a short rectangular hard pulse (32 μs in duration) excitation is followed by 2D radial ramp sampling (A), and 3D UTE with the same rectangular hard pulse excitation is followed by 3D radial ramp sampling (B).
The acquisition parameters for the data used for 2D T2* bi-component analysis and 3D water concentration measurement are listed in Table 1. For more accurate measurement, the 2D UTE imaging protocol was applied to a single sample each time. Each sample was placed near the center of the birdcage coil to minimize effects due to coil RF inhomogeneity. The 2D non-selective axial imaging plane was centered at the middle of each sample so that the UTE signal intensity represented the integrated sum of all bone signal across the whole axial thickness. The 3D UTE imaging protocol tooklonger. To save scan time, the 44 bone samples were studied in four groups of 11 samples each. One cortical bone sample was imaged three times on three different days to study the reproducibility of both the 2D and 3D UTE imaging sequences.
Table 1.
Data acquisition parameters for non-slice selective 2D and 3D UTE imaging.
| UTE Imaging Protocol | FOV [cm2] | Reconstructed Matrix | In-plane Resolution [mm2] | Slice Thickness [mm] | Sampling Bandwidth [kHz] | Flip Angle [°] | TE [ms] | TR [ms] | Number of Projections | Total Scan Time [min] |
|---|---|---|---|---|---|---|---|---|---|---|
| 2D UTE T2* bi-component analysis | 8×8 | 256×256 | 0.31×0.31 | - | 125 | 10 | 0.008, 0.1, 0.2, 0.3, 0.4, 0.6, 0.8, 1, 1.2, 1.4, 1.7, 2, 2.5, 3, 3.5, 4, 5, 6, 7, 8 | 200 | 411 | 27 |
| 3D UTE total bone water measurement | 15×15 | 256×256×256 | 0.58×0.58 | 0.58 | 250 | 10 | 0.008 | 300 | 50000 | 250 |
Fitting of multiple T2/T2* components is very sensitive to SNR, the number of fitting components, and the differences between T2/T2* values of the components (41). The following approaches were employed to improve the accuracy and precision of fitting. Firstly, background noise was estimated using a comprehensive four-step noise estimation algorithm primarily based on the maximum likelihood estimation model (42). This approach eliminated noise fitting and gained one degree of freedom in the subsequent fitting. Secondly, the number of fitting components was limited to two, corresponding to bound water with a very short T2*, and free water with a longer T2*. In addition, the UTE MR signal was normalized to 1 at a TE of 8 μs. In this way, the amplitude of the two components should sum to 1, thus gaining another degree of freedom in the subsequent fitting. The above procedures reduced the total number of fitting parameters down to three, namely short T2*, long T2* and short or long T2* fraction. This was expected to significantly improve the accuracy and precision of the parameter measurements (33, 34).
The UTE bi-component analysis algorithm was written in MATLAB (The Mathworks Inc. Natick, MA, USA). The mean intensity within each of the measured regions of interest (ROIs) was used for subsequent curve fitting. Bi-exponential signal decay fitting was performed on the UTE images to assess the short and long T2* components. Goodness of fit statistics including the R-squared value and standard error or fitting confidence level were calculated. Fit curves along with their 95% confidence intervals (CI) and residual signal curves were created.
Bone water concentration was quantified by comparison of the 3D UTE image signal intensity from cortical bone with that from an external reference standard (17–19). The reference phantom was distilled water doped with MnCl2 to reduce its T2* to close to that of cortical bone (~400 μs). The reference tube was placed close to the bone samples and near the RF coil isocenter. Variation in RF coil sensitivity was corrected by dividing the 3D UTE signal from bone or the reference phantom by the 3D UTE signal obtained from a separate scan of a 20 ml syringe filled with distilled water doped with Gadolinium (T2* ~ 50 ms). This was large enough to cover the region occupied by both the bone sample and the reference water phantom. Relaxation during RF excitation could be ignored since the rectangular pulse was significantly shorter than both the T1 and T2* of cortical bone. T1 effects could be ignored since the long TR of 300 ms guaranteed virtually full recovery of bone longitudinal magnetization (T1 of around 200 ms at 3T) using a low flip angle of 10° (26). T2 effects could also be ignored because the UTE sequence had a nominal TE of 8 μs and the T2* of the water phantom was close to that of bone. As a result, the expression for total bone water concentration (BWC) was as follows (19):
| [1] |
Bound and free water concentrations were calculated by integrating water fractions determined by bi-exponential fitting with total water concentration determined from the above equation.
The reproducibility was estimated with coefficients of variation calculated as the ratio of the standard deviation to the average value. Average coefficients of variation were calculated for the relative fractions and T2* values of bound and free water components, as well as total bone water content.
Micro Computed Tomography (μCT)
Samples were imaged using a Skyscan 1076 (Kontich, Belgium) μCT scanner with the following parameters: 0.5 mm Aluminum filter, 72 kV, 140 μA, 720 views, FOV=25 mm, isotropic 9 μm voxels. The total scan time was ~ 3 hours.
For each sample, 12 images every 2.5 mm along the sample long axis were selected and imported into Matlab. A custom program was used to determine the global histogram for all the images and this was used to determine a local minimum value used for thresholding. Binarized images were despeckled to remove noise, and regions of interest corresponding to the outer boundary of the sample as well as to bone were automatically generated. Porosity was determined as one minus the ratio of the area of the bone to that of the outer boundary of the sample.
Biomechanical Testing
The bone samples were subjected to a four-point bending test (43). A set of jigs (Figure 2A) were machined from stainless steel, and mounted onto a mechanical testing system (model 8511.20, Instron, Norwood, MA) containing a 100 Newton load cell (Instron 2519-103) with an actuator displacement accuracy of ~0.002 mm. The loading protocol consisted of finding contact, followed by application of uniaxial compression at 0.1 mm/s until sample failure. The testing duration for each sample was ~1 min. From the load and displacement data, as well as the measured sample dimensions, the stress-strain relation and biomechanical properties (Figure 2B) were determined (43). Young’s modulus of elasticity (E) was determined from a straight line fit to initial part of the stress-strain curve (between 10–20% of the maximum stress). A yield point was defined at a point on the curve where the curve deviated by a strain of 0.002 from the linear part of the curve described by the Young’s modulus (44). This point was used to determine both yield strain (εy) and yield stress (σy). The ultimate stress (σult) was defined at the maximum stress. The failure strain (εf) and toughness or work-to-failure (Wf) were defined at the point on the curve where the largest drop in stress occurred.
Figure 2.

Biomechanical testing device (A) and determination of properties from stress-strain data (B). In (A) the four-point bending test utilizes two loading jigs with a specific geometry (where a is the distance between inner and outer jigs, L is the width of outer jigs) compressing (to a depth of d) a rectangular sample (where b is the width and h is the height) while recording the force applied (F). Biomechanical measures were then obtained from the stress-strain curve (B). These included Young’s modulus (E), yield stress (σy), yield strain (εy), failure strain (εf), failure energy (Wf), and ultimate stress (σult).
Statistical Analyses
All of the MR measures, including total water concentration, bound and free water concentration, short and long T2* fractions, as well as short and long T2* values, were compared to porosity and biomechanical properties using Pearson correlation and linear regression. Some of the cortical bone samples (n=12) exhibited fat/water oscillations attributable to fat contamination and were eliminated from the analysis, and data from the remaining n=32 samples are presented here. A P value less than 0.05 was considered significant.
RESULTS
Reproducibility of the 2D and 3D UTE Imaging Sequences
The average coefficient of variation for the UTE bi-component analysis of one cortical bone sample on three repeated acquisitions was 1.01% for bound water fraction, 3.47% for free water fraction, 2.09% for bound water T2*, 3.84% for free water T2*, and 1.32% for total bone water content. These results show that the 2D UTE bi-component analysis technique provides reliable estimation of relative fractions and T2*s of bound and free water components, while the 3D UTE sequence provides reliable estimation of total bone water content.
UTE MR Bi-Component Analysis
Figure 3 shows UTE bi-component analysis and μCT imaging of two representative human cortical bone samples. Sample #1 has a low porosity of 1.8% and sample #2 has a higher porosity of 6.8%. Bi-component analyses show that the more dense bone (sample #1) has a lower long T2* fraction of 33%, while the more porous bone (sample #2) has a higher long T2* fraction of 67%.
Figure 3.
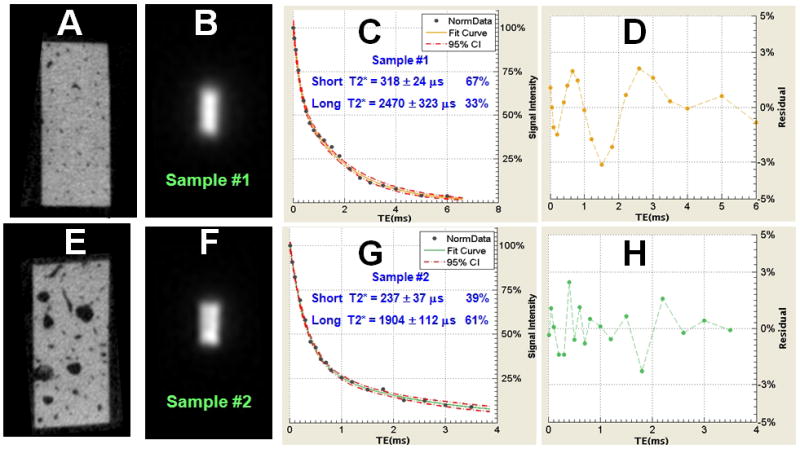
Data from cortical bone samples #1 (A, B) and #2 (E, F) imaged with μCT and UTE MR, respectively. Sample #1 shows a porosity of 1.8% (A). Sample #2 shows a porosity of 6.8% (E). Bi-component analysis shows a short T2* of 318 μs with a fraction of 67% and a long T2* of 2470 μs with a fraction of 33% for sample #1 (C). Sample #2 shows a short T2* of 237 μs with a fraction of 39% and a long T2* of 1904 μs with a fraction of 61% (G). (D) and (H) show the corresponding fitting residual signals. These are consistently less than 3% of the total signal, showing that the bi-component model shows a good fit of the UTE T2* signal decay.
Correlation Between MR Properties and Porosity
Total water content (Figure 4A), free water content (Figure 4C), and long T2* fraction (Figure 4C) correlated positively with μCT porosity. Short T2* fraction (Figure 4B) and short T2* values (Figure 4E) correlated negatively with porosity. The strengths of these correlations were moderate, with a correlation coefficient (R) value of ~0.5. Long T2* (Figure 4F) did not correlate significantly with porosity (P=0.5). The correlation coefficients between UTE MR measurements and μCT cortical porosity are shown in Table 2.
Figure 4.

Correlation between MR measures and μCT porosity. (A) Total water content, (B) free water content, and (E) long fraction all correlated positively (P<0.01) with porosity. (C) Short fraction, and (D) short T2* all correlated negatively (P<0.01) with porosity. (F) long T2* did not correlate significantly with porosity ( N=32 samples).
Table 2.
Correlation between UTE MR measurements (total water concentration, short T2*, long T2*, short T2* fraction and long T2* fraction), μCT cortical porosity and biomechanical properties (Young’s Modulus, Failure Strain, Ultimate Stress, Yield Strain, Yield Stress and Failure Energy) of 32 human cortical bone samples. R-values (top) and P-values (bottom) are shown.
| R-value | Porosity | Modul. | Fail. Strain | Ult. Stress | Yield Strain | Yield Stress | Fail. Energy | Total WC | Short Fraction | Long Fraction | Short T2* |
|---|---|---|---|---|---|---|---|---|---|---|---|
| Modulus | −0.07 | ||||||||||
| Fail. Strain | −0.13 | −0.27 | |||||||||
| Ult. Stress | −0.13 | 0.87 | 0.06 | ||||||||
| Yield Strain | −0.06 | −0.48 | 0.44 | −0.12 | |||||||
| Yield Stress | −0.12 | 0.85 | −0.03 | 0.98 | −0.07 | ||||||
| Fail. Energy | −0.15 | 0.18 | 0.76 | 0.48 | 0.25 | 0.43 | |||||
| Total WC | 0.46 | −0.30 | −0.19 | −0.53 | −0.18 | −0.51 | −0.33 | ||||
| Short Fraction | −0.50 | −0.22 | 0.38 | −0.10 | 0.20 | −0.17 | 0.25 | −0.34 | |||
| Long Fraction | 0.50 | 0.23 | −0.38 | 0.10 | −0.20 | 0.17 | −0.25 | 0.34 | −1.00 | ||
| Short T2* | −0.49 | −0.11 | 0.54 | 0.14 | 0.29 | 0.10 | 0.55 | −0.47 | 0.53 | −0.53 | |
| Long T2* | 0.12 | 0.22 | 0.19 | 0.38 | 0.04 | 0.33 | 0.41 | −0.32 | 0.23 | −0.23 | 0.30 |
| P-value | Porosity | Modulus | Fail. Strain | Ult. Stress | Yield Strain | Yield Stress | Fail. Energy | Total WC | Short Fractio | Long Fractio | Short T2* |
|---|---|---|---|---|---|---|---|---|---|---|---|
| Modulus | 0.682 | ||||||||||
| Fail. Strain | 0.432 | 0.100 | |||||||||
| Ult. Stress | 0.420 | 0.000 | 0.731 | ||||||||
| Yield Strain | 0.701 | 0.002 | 0.005 | 0.468 | |||||||
| Yield Stress | 0.447 | 0.000 | 0.841 | 0.000 | 0.677 | ||||||
| Fail. Energy | 0.347 | 0.268 | 0.000 | 0.002 | 0.118 | 0.006 | |||||
| Total WC | 0.003 | 0.064 | 0.250 | 0.001 | 0.265 | 0.001 | 0.041 | ||||
| Short Fraction | 0.001 | 0.166 | 0.016 | 0.531 | 0.226 | 0.306 | 0.126 | 0.035 | |||
| Long Fraction | 0.001 | 0.161 | 0.016 | 0.531 | 0.215 | 0.305 | 0.129 | 0.036 | 0.000 | ||
| Short T2* | 0.002 | 0.510 | 0.000 | 0.387 | 0.071 | 0.556 | 0.000 | 0.002 | 0.001 | 0.001 | |
| Long T2* | 0.460 | 0.168 | 0.253 | 0.017 | 0.814 | 0.037 | 0.009 | 0.044 | 0.152 | 0.159 | 0.061 |
Correlation Between MR Properties and Biomechanical Properties
A number of failure properties of cortical bone correlated significantly with MR properties. Failure strain (higher value indicates greater tissue compliance) correlated significantly and positively with short T2* (Figure 5D; R2=0.29, P<0.001). Failure strain also correlated positively with short T2* fraction (Figure 5A; R2=0.15, P<0.05), and negatively with free water content (Figure 5G; R2=0.14, P<0.05).
Figure 5.

Significant (p<0.05) correlation between MR measures and biomechanical measures. (A) Short fraction, (D) short T2* and (G) free water content vs. failure strain. (B) Total water content, (E) long T2* and (H) bound water content vs. ultimate stress. (C) Total water content, (F) short T2* and (I) long T2* vs. failure energy (N=32 samples).
Ultimate stress (higher value indicates greater strength) correlated significantly and negatively with total water content (Figure 5B; R2=0.25, P<0.001), as well as bound water content (Figure 5H; R2=0.22, P<0.01). Ultimate stress correlated positively with long T2* (Figure 5E; R2=0.14, P<0.05).
Failure energy (higher value indicate greater absorption of impact energy) correlated significantly and positively with short T2* (Figure 5F; R2=0.30, P<0.001). It also correlated negatively with total water content (Figure 5C; R2=0.10, P<0.05) and positively with long T2* (Figure 5I; R2=0.107 P<0.01).
In contrast, biomechanical elastic properties including Young’s modulus, yield strain and yield stress generally did not correlate significantly with most of the MR measures. The correlation coefficients between UTE MR measurements and biomechanical properties are shown in Table 2.
Correlation Between Porosity and Biomechanical Properties
While a decreasing trend of failure properties vs. porosity was found, the relationship was not statistically significant as shown in Table 2 (all P > 0.3).
DISCUSSION
The risk of traumatic bone fracture depends on many factors including the force of impact and the strength of the underlying bone. The latter depends on the bone’s mineral density (BMD), geometry and quality (3). A number of clinical studies have demonstrated the limitations of BMD measurements. Vertebral fractures in older adults are only weakly associated with BMD (45). A recent study (46) of over 7806 patients found that only 44% of all non-vertebral fractures occurred in women with a T-score below −2.5, and that this percentage dropped to 21% for men. Several other studies (45–48) have shown that BMD by itself predicts fractures with a rate of only 30–50%. Low correlation coefficients have also been reported between BMD and cortical bone strength (49–51). Overall fracture risk increases 13-fold from ages 60 to 80 (52), but it is estimated that decrease in BMD alone would only explain a doubling of this fracture risk. There is therefore a clear need for more sensitive risk assessment tools, potentially using not only BMD, but other determinants of risk such as bone microstructure (53), porosity (54–58), organic matrix (11–13) and bone water (59).
About 80% of the skeleton is cortical bone, and about 80% of all fractures in old age arise at sites that are mainly cortical. Cortical bone is traversed by Haversian canals (typically 30~200 μm in diameter), as well as lacunae (~10 μm) and canaliculi (~0.5 μm). Bone loss involves thinning of the cortex and an increase in intracortical porosity ranging from about 3 to 40% (54–56). Numerous studies have confirmed that changes in porosity have a dramatic impact on the mechanical properties of bone (54–56). Age related increase in cortical porosity is a major contributor to the concurrent decrease in mechanical properties of bone, and accounts for 76% of the loss of bone strength with age (54). A 4% rise in porosity increases crack propagation through bone by 84% (55). An increase in porosity from 4% to 10% more than halves the ultimate stress that can be tolerated by bone before fracture (56). Fracture toughness is affected by changes in porosity but is independent of BMD (23).
The current standard technique for assessing bone, dual-energy X-ray absorptiometry (DXA) only provides information on BMD, not porosity (60). μCT has emerged as a reference tool for assessing porosity in vitro. The recent development of high resolution peripheral quantitative CT (HR-pQCT) with spatial resolution down to 82 μm has allowed in-vivo assessment of bone porosity, and preliminary results have shown a high correlation between cortical porosity and biomechanical assessment (62, 63). Limitations include the use of ionizing radiation, and the inability to detect small pores or assess bone organic matrix and water content.
UTE MR sequences detect signal from water bound to the organic matrix and free water residing in the microscopic pores of the Haversian and the lacunar-canalicular systems. Quantitative measurements of bound and free water concentrations are expected to provide information on bone organic matrix (by means of bound water) and porosity (by means of free water). UTE MRI thus has the potential to non-invasively evaluate the organic matrix and water that make up ~55% of cortical bone by volume, but are not assessable with DXA or CT.
Conventional multi-component fitting of the FID or CPMG signal decay requires ultrahigh quality MR data for accurate estimation of the water components in bone. Reiter et al. (64) showed that SNR of more than 8000 is required to reduce the fitting error to less than 3% when no a priori information on the number of components is assumed. This is impossible with clinical MR imaging. We simplified the model to a bi-component system, with only three fitting parameters. This approach greatly improved the robustness of this technique, with fitting errors reduced to less than 3% with clinical achievable SNRs of around 50 (40), thus making it possible to evaluate cortical bone porosity and collagen matrix using clinical MR scanners.
To our knowledge, this is the first study of free and bound water in human cortical bone using a clinical MR scanner that has correlated quantitative UTE MR findings with μCT porosity and biomechanical measures. In the present study of 32 human cortical bone samples, we found significant correlation between UTE bi-component measures and μCT porosity. Total water content, free water content and long T2* water fraction were all positively correlated with μCT porosity. Short T2* water fraction and short T2* values were both negatively correlated withμCT porosity. High total and free water contents correlated with high porosity, which is consistent since free water resides within pores of the bone. UTE measured free water concentration was significantly higher than μCT porosity. This may be due to the spatial resolution (9×9×9 μm3) of the μCT system that was used, which is capable of resolving the large pores of Haversian system, but not those of lacunar and canalicular systems.
We also found that high values of short T2* and its relative fraction correlated with high failure strain and energy. Total and bound water content were negatively correlated with ultimate stress, while both short and long T2* values were positively correlated with failure energy. High short T2* value and fraction may reflect organic matrix structure and composition, which may help bone resist failure. The lack of correlation between short T2* value and fraction with Young’s modulus is reasonable, given that the stiffness of bone probably depends on the content of mineral matrix, rather than that of the organic matrix. Long T2* correlated weakly and positively with ultimate stress and failure strain; it is unclear at the moment what this correlation means, since long T2* component probably reflects free water and larger pores. Total water also correlated negatively with ultimate stress and failure energy, suggesting that more water in bone generally leads to weaker bone.
The capability to quantify bound and free water T2*s, their relative fractions as well as volume concentrations may play an important role in diagnosing osteoporosis (OP), which requires studying both the amount of bone and its quality (65). The proposed techniques fill a gap in the data provided by DXA assessment of bone, and potentially offer additional information about cortical bone quality not just in OP, but in other disease processes including Paget disease, osteomalacia, insufficiency fractures in the setting of bisphosphonate therapy, and drug therapy. Future work will focus on further validation of the UTE measurements, as well as development of translational UTE imaging techniques for in vivo bound and free water quantification where scan time and potential patient motion are two major limiting factors.
There are several limitations of this study. Firstly, we have no direct validation that the short T2* component corresponds to water bound to organic matrix and that the long T2* component corresponds to free water in cortical bone. In a recent study (unpublished) we investigated UTE bi-component analysis of bovine cortical bone subject to sequential air-drying, and found a high correlation (R2 = 0.83) between UTE measured long T2* water loss and bone water loss measured by weight. This result suggests that long T2* water corresponds to free water since air-drying mainly results in the loss of water residing in the pores of Haversian and lacunocanalicular systems (28, 31, 66). Secondly, as mentioned above, μCT porosity may underestimate the actual sample porosity, depending on scanner resolution. Thirdly, biomechanical properties are affected by sample thickness. While most samples had uniform thickness, small local variations may have affected the biomechanical measurements. The lack of significant correlation between porosity and biomechanical properties may be due to this limitation, as well as the fact that we measured the overall porosity, not the local porosity near the contact area between the sample and the bending device. Errors in cortical porosity estimation, especially for low porosity samples, may also affect the correlation between porosity and biomechanical properties of cortical bones. Another source of error may include the order of testing, wherebyμCT was performed before biomechanical testing. Substantial X-ray exposure is known to affect biomechanical properties of cortical bone (67). Long μCT duration used in this study may have affected the correlation. Further research is needed to quantitatively evaluate the effect of μCT imaging on the biomechanical properties of cortical bone.
In summary, bi-component analysis of short and long T2* and water content of human cortical bone is sensitive toμCT porosity and biomechanical function and may have implications for clinical evaluation of bone diseases.
Acknowledgments
This study was supported by a career development award from the National Institutes of Health (NIAMS K01 AR059764) in support of WCB and NIH 1R21AR057901-01A1 in support of JD.
Footnotes
Disclosures
All authors state that they have no conflicts of interest.
References
- 1.American Society for Bone and Mineral Research ASBMR Bone Curriculum. 2004 http://depts.washington.edu/bonebio/ASBMRed/ASBMRed.html.
- 2.Nevitt MC, Cummings SR. Type of fall and risk of hip and wrist fractures: the study of osteoporotic fractures. The Study of Osteoporotic Fractures Research Group. J Am Geriatr Soc. 1993;41:1226–1234. doi: 10.1111/j.1532-5415.1993.tb07307.x. [DOI] [PubMed] [Google Scholar]
- 3.World Health Organization. WHO Technical Report Series 843. Geneva: WHO; 1994. Assessment of fracture risk and its application to screening for postmenopausal osteoporosis. [PubMed] [Google Scholar]
- 4.NIH consensus development panel on osteoporosis prevention, diagnosis, and therapy. JAMA. 2001;285:785–795. doi: 10.1001/jama.285.6.785. [DOI] [PubMed] [Google Scholar]
- 5.Martin RB, Ishida J. The relative effects of collagen fiber orientation, porosity, density, and mineralization on bone strength. J Biomech. 1989;22:419–426. doi: 10.1016/0021-9290(89)90202-9. [DOI] [PubMed] [Google Scholar]
- 6.Boskey AL, Wright TM, Blank RD. Collagen and bone strength. J Bone Miner Res. 1999;14:330–335. doi: 10.1359/jbmr.1999.14.3.330. [DOI] [PubMed] [Google Scholar]
- 7.Zioupos P, Currey JD, Hamer AJ. The role of collagen in the declining mechanical properties of aging human cortical bone. J Biomed Mater Res. 1999;45:108–116. doi: 10.1002/(sici)1097-4636(199905)45:2<108::aid-jbm5>3.0.co;2-a. [DOI] [PubMed] [Google Scholar]
- 8.Lees S. A mixed pacing model for bone collagen. Calcif Tissue Int. 1981;33:591–602. doi: 10.1007/BF02409497. [DOI] [PubMed] [Google Scholar]
- 9.Wang X, Shen X, Li X, Mauli Agrawal C. Age-related changes in the collagen network and toughness of bone. Bone. 2002;31:1–7. doi: 10.1016/s8756-3282(01)00697-4. [DOI] [PubMed] [Google Scholar]
- 10.Singer K, Edmondston S, Day R, Breidahl P, Price R. Prediction of thoracic and lumber vertebral body compressive strength: correlations with bone mineral density and vertebral region. Bone. 1995;17:167–174. doi: 10.1016/s8756-3282(95)00165-4. [DOI] [PubMed] [Google Scholar]
- 11.Boskey AL, Wright TM, Blank RD. Collagen and bone strength. J Bone Miner Res. 1999;14:330–335. doi: 10.1359/jbmr.1999.14.3.330. [DOI] [PubMed] [Google Scholar]
- 12.Burstein AH, Zika JM, Heiple KG, Klein L. Contribution of collagen and mineral to the elastic-plastic properties of bone. J Bone J Surg. 1975;57:956–961. [PubMed] [Google Scholar]
- 13.Zioupos P, Currey JD, Hamer AJ. The role of collagen in the declining mechanical properties of aging human cortical bone. J Biomed Mater Res. 1999;45:108–116. doi: 10.1002/(sici)1097-4636(199905)45:2<108::aid-jbm5>3.0.co;2-a. [DOI] [PubMed] [Google Scholar]
- 14.Cowin SC. Bone poroelasticity. J Biomechanics. 1999;32:217–238. doi: 10.1016/s0021-9290(98)00161-4. [DOI] [PubMed] [Google Scholar]
- 15.Wehrli FW, Song HK, Saha PK, Wright AC. Quantitative MRI for the assessment of bone structure and function. NMR in Biomed. 2006;19:731–764. doi: 10.1002/nbm.1066. [DOI] [PubMed] [Google Scholar]
- 16.Yeni YN, Brown CU, Norman TL. Influence of bone composition and apparent density on fracture toughness of the human femur and tibia. Bone. 1998;22:79–84. doi: 10.1016/s8756-3282(97)00227-5. [DOI] [PubMed] [Google Scholar]
- 17.Techawiboonwong A, Song HK, Wehrli FW. In vivo MRI of submillisecond T2 species with two-dimensional and three-dimensional radial sequences and applications to the measurement of cortical bone water. NMR in Biomed. 2008;21:59–70. doi: 10.1002/nbm.1179. [DOI] [PubMed] [Google Scholar]
- 18.Techawiboonwong A, Song HK, Leonard MB, Wehrli FW. Cortial bone water: in vivo quantification with ultrashort echo-time MR imaging. Radiology. 2008;248:824–833. doi: 10.1148/radiol.2482071995. [DOI] [PMC free article] [PubMed] [Google Scholar]
- 19.Du J, Carl M, Bydder M, Takahashi A, Chung CB, Bydder GM. Qualitative and quantitative ultrashort echo time (UTE) imaging of cortical bone. J Magn Reson. 2010;207:304–311. doi: 10.1016/j.jmr.2010.09.013. [DOI] [PubMed] [Google Scholar]
- 20.Ni Q, Nyman JS, Wang X, De Los Santos A, Nicolella DP. Assessment of water distribution changes in human cortical bone by nuclear magnetic resonance. Meas Sci Technol. 2007;18:715–723. [Google Scholar]
- 21.Nyman JS, Ni Q, Nicolella DP, Wang X. Measurements of mobile and bound water by nuclear magnetic resonance correlate with mechanical properties of bone. Bone. 2008;42:193–199. doi: 10.1016/j.bone.2007.09.049. [DOI] [PMC free article] [PubMed] [Google Scholar]
- 22.Wang X, Ni Q. Determination of cortical bone porosity and pore size distribution using a low field pulsed NMR approach. J Orthop Res. 2003;21:312–319. doi: 10.1016/S0736-0266(02)00157-2. [DOI] [PubMed] [Google Scholar]
- 23.Horch RA, Nyman JS, Gochberg DF, Dortch RD, Does MD. Characterization of 1H NMR signal in human cortical bone for magnetization resonance imaging. Magn Reson Med. 2010;64:680–687. doi: 10.1002/mrm.22459. [DOI] [PMC free article] [PubMed] [Google Scholar]
- 24.Nyman JS, Roy A, Shen X, Rae LA, Tyler JH, Wang X. The influence of water removal on the strength and toughness of cortical bone. J Biochem. 2006;39:931–938. doi: 10.1016/j.jbiomech.2005.01.012. [DOI] [PMC free article] [PubMed] [Google Scholar]
- 25.Reichert ILH, Robson MD, Gatehouse PD, He T, Chappell KE, Holmes J, Girgis S, Bydder GM. Magnetic resonance imaging of cortical bone with ultrashort TE (UTE) pulse sequences. Magn Reson Imaging. 2005;23:611–618. doi: 10.1016/j.mri.2005.02.017. [DOI] [PubMed] [Google Scholar]
- 26.Du J, Hamilton G, Takahashi A, Bydder M, Chung CB. Ultrashort TE spectroscopic imaging (UTESI) of cortical bone. Magn Reson Med. 2007;58:1001–1009. doi: 10.1002/mrm.21397. [DOI] [PubMed] [Google Scholar]
- 27.Du J, Bydder M, Takahashi AM, Carl M, Chung CB, Bydder GM. Short T2 contrast with three-dimensional ultrashort echo time imaging. Magn Reson Imaging. 2011;29:470–82. doi: 10.1016/j.mri.2010.11.003. [DOI] [PMC free article] [PubMed] [Google Scholar]
- 28.Idiyatullin D, Corum C, Park JY, Garwood M. Fast and quiet MRI using a swept radiofrequency. J Magn Reson. 2006;181:342–349. doi: 10.1016/j.jmr.2006.05.014. [DOI] [PubMed] [Google Scholar]
- 29.Wu Y, Ackerman JL, Chesler DA, Graham L, Wang Y, Glimcher MJ. Density of organic matrix of native mineralized bone measured by water- and fat-suppressed proton projection MRI. Magn Reson Med. 2003;50:59–68. doi: 10.1002/mrm.10512. [DOI] [PubMed] [Google Scholar]
- 30.Cao H, Ackerman JL, Hrovat MI, Graham L, Glimcher MJ, Wu Y. Quantitative bone matrix density measurement by water- and fat-suppressed proton projection MRI (WASPI) with polymer calibration phantoms. Magn Reson Med. 2008;60:1433–1443. doi: 10.1002/mrm.21771. [DOI] [PMC free article] [PubMed] [Google Scholar]
- 31.Cao H, Nazarian A, Ackerman JL, Snyder BD, Rosenberg AE, Nazarian RM, Hrovat MI, Dai G, Mintzopoulos D, Wu Y. Quantitative 31P NMR spectroscopy and 1H MRI measurements of bone mineral and matrix density differentiate metabolic bone diseases in rat models. Bone. 2010;46:1582–1590. doi: 10.1016/j.bone.2010.02.020. [DOI] [PMC free article] [PubMed] [Google Scholar]
- 32.Kokabi N, Bae W, Diaz E, Chung CB, Bydder GM, Du J. Ultrashort TE MR imaging of bovine cortical bone: the effect of water loss on the T1 and T2* relaxation times. Magn Reson Med. 2011;66:476–482. doi: 10.1002/mrm.22859. [DOI] [PMC free article] [PubMed] [Google Scholar]
- 33.Diaz E, Chung CB, Bae WC, Statum S, Znamirowski R, Bydder GM, Du J. Ultrashort echo time spectroscopic imaging (UTESI): an efficient method for quantifying bound and free water. NMR in Biomed. 2011 doi: 10.1002/nbm.1728. (epub Jul 15) [DOI] [PubMed] [Google Scholar]
- 34.Du J, Diaz E, Carl M, Bae WC, Chung CB, Bydder GM. Ultrashort echo time imaging with bicomponent analysis. Magn Reson Med. 2011 doi: 10.1002/mrm.23047. (epub Oct 27) [DOI] [PubMed] [Google Scholar]
- 35.Reilly DT, Burstein AH, Frankel VH. The elastic modulus for bone. J Biomech. 1974;7:271–275. doi: 10.1016/0021-9290(74)90018-9. [DOI] [PubMed] [Google Scholar]
- 36.Keller TS, Spengler DM, Carter DR. Geometric, elastic, and structural properties of maturing rat femora. J Orthop Res. 1986;4:57–67. doi: 10.1002/jor.1100040107. [DOI] [PubMed] [Google Scholar]
- 37.Turner CH, Burr DB. Basic biomechanical measurements of bone: a tutorial. Bone. 1993;14:595–608. doi: 10.1016/8756-3282(93)90081-k. [DOI] [PubMed] [Google Scholar]
- 38.Timoshenko S, Goodier N. Theory of Elasticity. 2. McGraw Hill; New York: 1951. p. 567. [Google Scholar]
- 39.Fernandez-Seara MA, Wehrli SL, Takahashi M, Wehrli FW. Water content measured by proton-deuteron exchange NMR predicts bone mineral density and mechanical properties. J Bone Miner Res. 2004;19:289–96. doi: 10.1359/JBMR.0301227. [DOI] [PubMed] [Google Scholar]
- 40.Haimi S, Vienonen A, Hirn M, Pelto M, Virtanen V, Suuronen R. The effect of chemical cleansing procedures combined with peracetic acid-ethanol sterilization on biomechanical properties of cortical bone. Biologicals. 2008;36:99–104. doi: 10.1016/j.biologicals.2007.06.001. [DOI] [PubMed] [Google Scholar]
- 41.Anastasiou A, Hall LD. Optimization of T2 and M0 measurements of bi-exponential systems. Magn Reson Imaging. 2004;22:67–80. doi: 10.1016/j.mri.2003.05.005. [DOI] [PubMed] [Google Scholar]
- 42.Sijbers J, den Dekker AJ. Maximum Likelihood estimation of signal amplitude and noise variance from MR data. Magn Reson Med. 2004;51:586–594. doi: 10.1002/mrm.10728. [DOI] [PubMed] [Google Scholar]
- 43.Hammant B. The use of 4-point loading tests to determine mechanical properties. Composites. 1971;2:246–9. [Google Scholar]
- 44.Currey JD. Physical characteristics affecting the tensile failure properties of compact bone. J Biomech. 1990;23:837–44. doi: 10.1016/0021-9290(90)90030-7. [DOI] [PubMed] [Google Scholar]
- 45.Faulkner KG. Bone matters: are density increases necessary to reduce fracture risk? J Bone Miner Res. 2000;15:183–187. doi: 10.1359/jbmr.2000.15.2.183. [DOI] [PubMed] [Google Scholar]
- 46.Schuit SCE, Klift M, Weel AEAM, de Laet CEDH, Burger H, Seeman E, Hofman A, Uitterlinden AG, van Leeuwen JPTM, Pols HAP. Fracture incidence and association with bone mineral density in elderly men and women: the Rotterdam study. Bone. 2004;34:195–202. doi: 10.1016/j.bone.2003.10.001. [DOI] [PubMed] [Google Scholar]
- 47.Law MR, Wald NJ, Meade TW. Regular review: strategies for prevention of osteoporosis and hip fracture. BMJ. 1991;303:453–459. doi: 10.1136/bmj.303.6800.453. [DOI] [PMC free article] [PubMed] [Google Scholar]
- 48.Snyder SM, Schneider E. Estimation of mechanical properties of cortical bone by computed tomography. J Orthop Res. 1991;9:422–431. doi: 10.1002/jor.1100090315. [DOI] [PubMed] [Google Scholar]
- 49.McCreadie BR, Goldstein SA. Biomechanics of fracture: is bone mineral density sufficient to access risk? J Bone Miner Res. 2000;15:2305–2308. doi: 10.1359/jbmr.2000.15.12.2305. [DOI] [PubMed] [Google Scholar]
- 50.Kanis JA, Johnell O, Oden A, Dawson A, De Laet C, Jonsson B. Ten year probabilities of osteoporotic fractures according to BMD and diagnostic thresholds. Osteoporos Int. 2001;12:989–995. doi: 10.1007/s001980170006. [DOI] [PubMed] [Google Scholar]
- 51.Russo CR, Lauretani F, Bandinelli S, Bartali B, Di Iorio A, Volpato S, Gurainik JM, Harris T, Ferrucci L. Aging bone in men and women: beyond changes in bone mineral density. Osteoporos Int. 2003;14:531–538. doi: 10.1007/s00198-002-1322-y. [DOI] [PubMed] [Google Scholar]
- 52.De Lact C, van Hout B, Burger H, Hofman A, Pols H. Bone density and the risk of hip fracture in men and women: cross sectional analysis. Br Med J. 1997;315:221–225. doi: 10.1136/bmj.315.7102.221. [DOI] [PMC free article] [PubMed] [Google Scholar]
- 53.Cummings SR, Nevitt MC, Browner WS, Stone K, Fox KM, Ensrud KE, Cauley J, Black D, Vogt TM. Risk factors for hip fracture in white women. Study of osteoporotic fractures research group. N Engl J Med. 1995;332:767–773. doi: 10.1056/NEJM199503233321202. [DOI] [PubMed] [Google Scholar]
- 54.McCalden RW, McGeough JA, Barker MB, Court-Brown CM. Age-related changes in the tensile properties of cortical bone: the relative importance of changes in porosity, mineralization and microstructure. J Bone Joint Surg Am. 1993;75:1193–1205. doi: 10.2106/00004623-199308000-00009. [DOI] [PubMed] [Google Scholar]
- 55.Diab T, Vashishth D. Effects of damage morphology on cortical bone fragility. Bone. 2005;37:96–102. doi: 10.1016/j.bone.2005.03.014. [DOI] [PubMed] [Google Scholar]
- 56.Martin RB, Burr DB. Structure, function, and adaptation of compact bone. New York, NY, USA: Raven Press; 1989. The microscopic structure of bone. [Google Scholar]
- 57.Schaffler MB, Burr DB. Stiffness of compact bone: effects of porosity and density. J Biomech. 1988;21:13–16. doi: 10.1016/0021-9290(88)90186-8. [DOI] [PubMed] [Google Scholar]
- 58.Currey J. The effect of porosity and mineral content on Young’s modulus of elasticity of compact bone. J Biomech. 1988;21:131–139. doi: 10.1016/0021-9290(88)90006-1. [DOI] [PubMed] [Google Scholar]
- 59.Neuman WF, Neuman MW. Skeletal dynamics the chemical dynamics of bone mineral. Chicago: Univ of Chicago Press; 1958. p. 101. [Google Scholar]
- 60.Brandi ML. Microarchitecture, the key to bone quality. Rheumatology. 2009;48:3–8. doi: 10.1093/rheumatology/kep273. [DOI] [PubMed] [Google Scholar]
- 61.Yeni YN, Brown CU, Norman TL. Influence of bone composition and apparent density on fracture toughness of the human femur and tibia. Bone. 1998;22:79–84. doi: 10.1016/s8756-3282(97)00227-5. [DOI] [PubMed] [Google Scholar]
- 62.Nishiyama KK, Macdonald HM, Buie HR, Hanley DA, Boyd SK. Postmenopausal women with osteopenia have higher cortical porosity and thinner cortices at the distal radius and tibia than women with normal aBMD: an in vivo HR-pQCT study. J Bone Miner Res. 2010;25:882–890. doi: 10.1359/jbmr.091020. [DOI] [PubMed] [Google Scholar]
- 63.Burghardt AJ, Kazakia GJ, Ramachandran S, Link TM, Majumdar S. Age and gender related differences in the geometric properties and biomechanical significance of intra-cortical porosity in the distal radius and tibia. J Bone Miner Res. 2010;25:983–993. doi: 10.1359/jbmr.091104. [DOI] [PMC free article] [PubMed] [Google Scholar]
- 64.Reiter DA, Lin PC, Fishbein KW, Spencer RG. Multicomponent T2 relaxation analysis in cartilage. Magn Reson Med. 2009;61:803–809. doi: 10.1002/mrm.21926. [DOI] [PMC free article] [PubMed] [Google Scholar]
- 65.Lester G. Bone quality: summary of NIH/ASBMR meeting. J Musculoskeletal Neuronal Interact. 2005;5:309. [PubMed] [Google Scholar]
- 66.Robinson RA. Crystal collagen water relationships in bone matrix. Clin Orthop Relat Res. 1960;17:69–76. [Google Scholar]
- 67.Currey JD, Foreman J, Laketic I, Mitchell J, Pegg DE, Reilly GC. Effects of ionizing radiation on the mechanical properties of human bone. J Orthop Res. 1997;15:111–117. doi: 10.1002/jor.1100150116. [DOI] [PubMed] [Google Scholar]