

Abstract
We found both in vitro and in vivo that survival of NSCLC cells in a hypoxic microenvironment requires Notch-1 signaling. A hypoxic tumor environment represents a problem for NSCLC treatment because it plays a critical role in cancer resistance to chemotherapy, tumor recurrence, and metastasis. Here we targeted hypoxic tumor tissue in an orthotopic NSCLC model. We inhibited the Notch-1/IGF-1R/Akt-1 axis using 3 agents: a γ-secretase inhibitor or GSI (MRK-003), a fully humanized antibody against the human IGF-1R (MK-0646), and a pan-Akt inhibitor (MK-2206), alone or in various combinations including therapeutics currently in clinical use. All treatments but Akt inhibition significantly prolonged the median survival of mice compared with controls. GSI treatment caused specific cell death of hypoxic tumors. Tumors excised from mice displayed a significant reduction of markers of hypoxia. Moreover, GSI treatment caused reduced metastasis to the liver and brain. MK-0646 was not specific to a hypoxic tumor environment but substantially increased the median survival of treated mice compared with controls. NSCLC cells evaded MK-0646 treatment by specifically overactivating EGF-R both in vivo and in 5 cell lines in vitro. This phenomenon is achieved at the level of protein stability. MK-0646 treatment caused increased erlotinib sensitivity in NSCLC cells poorly responsive to it. Sequential treatment with MK-0646 followed by erlotinib prolonged median survival of mice significantly. When the 2 drugs were administered simultaneously, no survival benefit was observed, and this combination therapy proved less effective than MK-0646 used as single agent. Our data offer novel information that may provide insights for the planning of clinical trials in humans, likely for maintenance therapy of NSCLC patients.
Keywords: notch signaling, insulin-like growth factor 1 receptor signaling, tumor hypoxia
Given their dynamics of growth, solid tumors invariably include regions of poor oxygen and nutrient availability. A hypoxic tumor microenvironment is increasingly considered a critical component in determining resistance to therapy.1 A hypoxic tumor microenvironment is also thought to provide a niche for cancer stem cells2 and to promote metastasis.3
Adjuvant chemotherapy is largely performed using combinations of drugs to obtain synergistic effects in eradicating rapidly growing or metabolically overactive cancer cells. Hypoxic tumor areas are mostly quiescent and under metabolic checkpoint via various mechanisms.4,5 Also, increased expression of hypoxia inducible factors (HIFs) 1α and 2α upregulates components of the DNA damage response.2,6 Therefore, hypoxic tumor areas represent a challenge for radio(chemo)therapy due to a variety of mechanisms, including scarce permeability to the therapeutic drugs and the intrinsic quiescence of hypoxic tumor microenvironment. It is critical to target this tumor environment specifically to prevent the permanence of residual disease after radio(chemo)therapy and to reduce metastasis.
In previous studies we have determined that survival of non–small cell lung cancer (NSCLC) cells under hypoxia is highly dependent upon Notch-1 signaling.7 Notch-1 is part of an evolutionarily conserved family of transmembrane receptors (Notch-1 through -4 in mammalians) that regulate critical cell fate decisions during development and postnatal life.8 Upon ligand binding, Notch proteins undergo a series of proteolytic cleavages, including one operated by a presenilin-dependent γ-secretase complex within the transmembrane sequence.9,10 This process leads to the release of the activated form of Notch receptors into the cell (intracellular Notch, or NotchIC). NotchIC translocates to the nucleus,11 where it modulates gene expression. In turn, the inhibition of the γ-secretase complex inhibits Notch activation. The canonical Notch downstream genes encode a number of basic helix-loop-helix transcriptional repressors, known as Enhancer of Split in Drosophila, or HES, HEY, and HERP genes, their mammalian counterparts.12 Further Notch-1 targets are p21WAF,13 members of the NFκB pathway, cyclin D1 and A,12 phosphatase and tensing homolog (PTEN),14 and other genes. It is critical to understand that Notch-1 can directly and indirectly regulate some promoters in a highly context-dependent way. Notch-1 signaling is potentiated under low oxygen concentrations because hypoxia inducible factor 1α (HIF-1α) stabilizes Notch-1IC from degradation and intensifies its transcriptional activities.7,15 Inhibition of Notch-1 signaling, obtained either using a GSI or through artificial downregulation of Notch-1 expression, led to NSCLC cell death specifically under hypoxia.7 As observed in vitro and in vivo, Notch-1 signaling provided critical prosurvival signals to NSCLC cells via a dual mechanism: suppression of PTEN expression and positive transcriptional regulation of the insulin-like growth factor 1 (IGF-1) and its receptor (IGF-1R).16 This leads to exacerbated Akt-1 activation in hypoxic tumor microenvironment.
We then questioned whether interfering with the Notch-1/IGF-1R/Akt axis could deplete tumor masses of hypoxic areas in an orthotopic, very advanced NSCLC model in SCID mice. Using a number of drugs, including some currently in clinical use, we implemented combination or sequential therapeutic strategies. Because tumors grown in the lungs are more heterogeneous (e.g., hypoxic areas in combination with well oxygenated tumor tissue), we used an orthotopic model rather than a subcutaneous (s.q.) xenograft model. Moreover, tumor masses in the lungs are likely to produce cardiopulmonary syndrome, thus further reproducing conditions similar to what is clinically observed. As approximately a third of NSCLC cases seem to be dependent on Notch-3 signaling,17 we used cell lines that are not dependent on Notch-3 signaling for growth or survival.
Results
Description of the mouse orthotopic model
A549 and H1437 were transfected with a siRNA targeting the Notch-3 mRNA. Growth curves and annexinV/7AAD staining experiments were performed on cells transfected with siRNA to Notch-3 and compared with controls. We determined that artificial downregulation of Notch-3 in A549 and H1437 cell lines affected neither their growth nor apoptotic rates (not shown). A549 and H1437 cell lines were lentivirally transduced to express firefly luciferase for animal imaging purposes. We injected 2.5 × 10⁶ of these cells into the lateral tail vein of SCID mice, and they were readily visible in the mice lungs 5 minutes after injection. Tumor nodules were clearly detected throughout the lungs of mice 5 weeks after injection (Suppl. Fig. S1A). Quantitative PCR performed at this 5-week time point, using species-specific primers for the glyceraldehyde 3-phosphate dehydrogenase (GAPDH) gene on total DNA extracted from 12 whole right lungs, showed a uniform tumor burden (mean of ratio human/mouse cell of 0.0495 ± 0.0029; Suppl. Table S1). Before we administered treatment, mice were imaged for light emission, and animals within ±20% of average light emission in the thorax and little or no light emission at the site of injection (Suppl. Fig. S1B) were assigned to treatment groups (16 mice per arm of study). Five weeks following injections, the mock-treated mice had a median survival of 8 (H1437) and 9 days (A549; Fig. 1 and Suppl. Table S2).
Figure 1.

Survival curves of mice treated with the indicated agents. Median survivals of A549-injected mice (days): control (C), 9.0; cisplatin, 12.5; MRK-003 (GSI), 15.5; GSI+cisplatin, 19.5; GSI+MK-0646, 26.0; erlotinib, 16.0; MK-0646, 25.50; MK-0646+erlotinib, 15.0; 3 weeks of MK-0646 as single agent then combination of MK-0646 and erlotinib, 36.5. Median survivals of H1437-injected mice (days): control, 8.0; cisplatin, 21.0; MRK-003 (GSI), 30.0; GSI+cisplatin, 38.0; GSI+MK-0646, 42.0; erlotinib, 19.0; MK-0646, 26.0; MK-0646+erlotinib, 18.5; 3 weeks of MK-0646 as single agent then combination of MK-0646 and erlotinib, 35.0.
Notch inhibition results
For this study we used the γ-secretase inhibitor (GSI) MRK-003 (Merck & Co., Inc., Whitehouse Station, NJ). The therapy regimen was 100 mg/kg of MRK-003 in 0.05% methylcellulose administered via oral gavage 3 days a week. The therapy combinations are as follows: GSI plus cisplatin (3 mg/kg, 1 weekly intraperitoneal [i.p.] injection for 4 consecutive weeks), and GSI plus the fully humanized monoclonal antibody MK-0646 targeting the human IGF-1R (10 mg/kg, 1 weekly injection). The results are summarized in Fig. 1 (left panels; statistical analyses are shown in Suppl. Table S2). Due to the Bonferroni correction, it is difficult to assess the most effective therapeutic regimen because we have numerous comparisons. More specifically, we have performed a total of 40 comparisons. To be defined as best therapeutic regimen, any drug treatment should have had a P value of 0.00125 or less over each other arm of study. Nonetheless, the results showed that all treatments significantly prolonged the median survival of mice compared with controls. We observed apparent synergisms between GSI and cisplatin and GSI and MK-0646. RNA was extracted from the whole inferior right lung lobe after necropsies, and RT-Q-PCR was performed using human-specific primers. According to the Q-PCR analysis, Notch signaling was effectively inhibited. Furthermore, the expression levels of the mRNA of 2 critical markers of hypoxia (glucose transporter 1, or GLUT-1, and vascular endothelial growth factor A, or VEGF-A) and of the IGF-1R mRNA were significantly reduced, confirming our previous finding that Notch-1 regulates IGF-1R at the transcriptional level (Fig. 2A). Using species-specific GAPDH primers, we measured human versus mouse cells in total DNA extracted from the whole right brain and left liver lobes. The results showed a statistically significant reduced metastasis in GSI-treated mice versus controls (Fig. 2B), confirming previous results indicating that the promotion of metastasis in hypoxic tumor environment is dependent on Notch signaling.3 TUNEL assays performed on 8-µm-thick slides obtained from frozen lungs excised during necropsies showed that GSI treatment promoted apoptosis in hypoxic tumor regions, whereas control mice did not show TUNEL signals in hypoxic tumor areas (Suppl. Fig. S2). Western blotting analyses showed activated (cleaved) caspase-3 in GSI treated mice’s lungs (Suppl. Fig. S2E).
Figure 2.
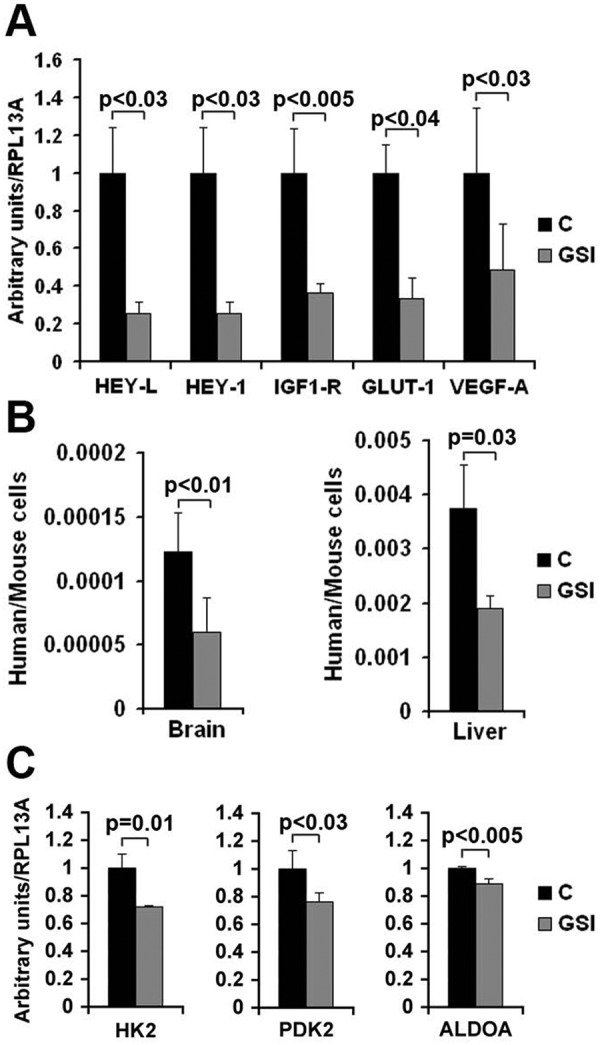
Measurement of the indicated mRNAs (A and C) or ratio of cells (B) in control or GSI-treated mice. (A) Total RNA was isolated from the whole left lung of mice after euthanasia, reverse transcribed, and measured by Q-PCR using human-specific primers. The results were normalized for human ribosomal protein RPL13A. Columns represent averages, while bars represent standard deviation. The experiment was performed on 4 control and 4 MRK-003 treated mice. (B) Ratio of human versus mouse cells in the indicated organs in control mice (C) and in MRK-003 treated mice (GSI). This ratio was calculated by Q-PCR using primers specific for human or mouse GAPDH (this Q-PCR assay has been previously validated using known amount of cells). In the brain experiment, columns represent the average of 6 mice (controls: days at euthanasia 12.67 ± 4.18; GSI treated mice: days at euthanasia 17.83 ± 8.86). In the liver experiment we analyzed 6 control mice (days at euthanasia: 12.6 ± 4.22) and 7 GSI treated mice (days at euthanasia: 18.67 ± 7.84). Bars represent standard deviation. (C). RT-Q-PCR of the indicated mRNA in control (C) or MRK-003 treated mice (GSI). Columns represent the average of 4 mice. Bars represent standard deviation. P values are indicated.
A recent study performed on breast tumor cells18 revealed that Notch signaling increased mRNA expression of several glycolytic enzymes. RT-Q-PCR analyses performed on control and GSI treated mice showed a decrease of the expression of the mRNAs of hexokinase-2 (HK-2), pyruvate dehydrogenase kinase-2 (PDK-2), and aldolase-A (ALDOA) in GSI treated mice (Fig. 2C).
Akt pan-inhibition results
Treatment of tumor burdened mice with the Akt pan-inhibitor MK-2206 (Merck & Co) caused glucose intolerance, which led to a 20% loss of body weight (end point) within 8 days of the initiation of therapy (3 oral administrations of 80 mg/kg, which in preliminary results appeared to be the maximum tolerated dose in SCID mice). The plasma glucose concentration in mice reaching end point was 316 ± 23 mg/dl (average of 8 mice ± standard deviation.).
IGF-1R inhibition results
The median survival of mice treated with the fully humanized monoclonal antibody MK-0646 (Merck & Co.) targeting the human IGF-1R was considerably extended compared with controls. Again, due to the multiple comparisons it is difficult to assess the best therapeutic regimen (Fig. 1, right panels; see Suppl. Table S2 for statistical analyses). RT-Q-PCR of RNAs extracted from the whole inferior right lung lobe after necropsies showed that MK-0646 treatment affected neither the expression levels of hypoxia markers compared with control mice nor the extent of metastasis to brain and liver (not shown). Combination and sequential therapy with erlotinib is discussed below.
MK-0646 treatment of control cells in vitro caused rapid loss of IGF-1R expression in the total protein lysate and effective loss of Akt-1 activation by IGF-1 administration to serum-starved cells (Fig. 3A). MK- 0646 appears to promote IGF-1R degradation through the proteasomal degradation pathway since the loss of IGF-1R expression was noticeably reduced in the presence of the proteasomal inhibitor MG-132, whereas the lysosomal inhibitor NH4Cl yielded few effects (Fig. 3B). Weekly monitoring of MK-0646 treated animals for luciferase activity in their thorax showed that this treatment was initially tumoristatic. After 2 weeks of treatment, the tumors evaded MK-0646 antigrowth properties (as assessed by light emission from their thorax, Fig. 3C). A recent study indicated that Akt-1 inhibition leads to a compensatory overexpression of a number of tyrosine kinase growth factor receptors (RTKs) whose expression is mediated by activation of forkhead transcription factors.19 To understand whether tumors of MK-0646 treated mice were evading MK-0646 action through the activation of alternative RTKs, we performed several RTK arrays on total protein extracts derived from lungs (right, inferior lobes) in control and MK-0646 treated mice after necropsies. We found epidermal growth factor receptor (EGF-R) overactivation in all samples tested (a representative assay is shown in Fig. 3D). We detected an increased expression of total EGF-R in tumors from mice treated with MK-0646, and the same was observed in cell lines derived from the respective lung tumors (Fig. 4A). This appeared to be a cell-autonomous phenomenon because A549 and H1437 cells treated for 3 weeks with MK-0646 showed a similar pattern of EGF-R expression compared with cells treated with an irrelevant human IgG (Fig. 4A). Increased EGF-R expression at the protein level was not paralleled by increased EGF-R mRNA expression in tumors, in cells re-derived from tumors after necropsies, or in cells treated with MK-0646 in vitro for 3 weeks (Fig. 4B). The EGF-R mRNA expression levels were indeed reduced in MK-0646 treated versus the respective controls in all samples tested (from 5-fold to 60%). Immunoprecipitation of EGF-R followed by immunoblotting for phosphotyrosine confirmed increased EGF-R activation in samples treated with MK-0646 (Fig. 4C). Biotinylation of cells followed by streptavidin pull-down indicated that MK-0646 treated cells had increased phosphorylation of EGF-R both at the plasma membrane and in intracellular fraction (Fig. 4D). Increased EGF-R protein stability was observed in immunoprecipitation experiments followed by Western blot analysis for ubiquitin. Cells treated with MK-0646 for 3 weeks showed a marked decrease in EGF-R polyubiquitination (Fig. 4E). Reduced EGF-R degradation was suggested using a proteasomal inhibitor (MG-132) and a lysosomal inhibitor (NH4Cl). Neither treatment increased the EGF-R protein expression (Fig. 3B). We sought to assess the level of activation of Akt-1 in the tumors of mice treated with MK-0646 or in cells treated with this antibody in vitro for 3 weeks. Because the antibody for S473 does not distinguish between human or mouse Akt-1, we assayed cell lines re-derived from these tumors after necropsies. A representative experiment is shown in Fig. 5A. We found increased Akt-1 activation in cells chronically treated with MK-0646. Since increased activation of EGF-R in NSCLC treated with MK-0646 appeared to be a cell-autonomous phenomenon, we analyzed the expression level of all the mRNAs for all known EGF-R ligands (EGF, transforming growth factor α, betacellulin, amphiregulin, heparin binding EGF) in MK-0646 treated cells compared with controls using RT-Q-PCR. We found that only the mRNA for amphiregulin was elevated in tumors, in cell lines derived from tumors, and in NSCLC cell lines treated in vitro with MK-0646 (Fig. 5B). Increased Akt-1 phosphorylation could have accounted for decreased EGF-R transcription.19 We sought to verify whether increased amphiregulin mRNA expression was dependent on Akt-1 activation. We treated A549 and H1437 cells with either 50 ng/ml of IGF-1 or the Akt pan-inhibitor MK-2206. As shown in Fig. 5C, the amphiregulin mRNA expression levels paralleled the activation of Akt-1 as measured by phosphorylation of S473. To confirm these results, we transfected A549 and H1437 cells with either a control plasmid, a plasmid encoding a constitutively active Akt-1, or a dominant-negative Akt-1. Transfection of constitutively active Akt-1 increased the amphiregulin mRNA expression, whereas dominant negative Akt-1 decreased the amphiregulin mRNA expression (Fig. 5D).
Figure 3.

Mechanisms of MK-0646 action and tumor evasion from therapy. (A). Western blot hybridization of the indicated proteins at the indicated time-points of H1437 cells either serum starved for 1 hour, exposed to 50 ng/ml of purified IGF-1, treated with 2.5 µg/ml of MK-0646, or with both IGF-1 and MK-0646. Note loss of IGF-1R expression upon MK-0646 administration. This leads to inability of IGF-1 to activate Akt-1 and ERKs. (B). Western blot analysis of H1437 treated for the indicated times with either vehicle, 10 µM of MG-132, or 10 mM of NH4Cl. (C). Graphic showing the units of light recorded by an IVIS 100 at the indicated time points. Sixteen mice were injected i.p. with 0.25 mg of luciferin and imaged for 5 minutes. (D). Example of Proteome Profiler antibody array, human phospho-RTK array kit performed on total cell extracts obtained from a control mouse (C) and a mouse treated with MK-0646. We performed a total of 4 assays and always detected a dramatic increase in EGFR phosphorylation. In this particular example we also detected that ErbB3 and FGF-R3 increased phosphorylation upon MK-0646 treatment, but the only constant outcome that we identified was EGF-R hyperactivation.
Figure 4.

Increased expression and activation of EGF-R in MK-0646 treated cells both in vivo and in vitro. (A) Western blot analysis of the indicated proteins in 2 representative protein lysates obtained from the postcaval lung lobe of a control and MK-0646 treated mice, in 3 pooled cell lines re-derived after necroscopy from lung tumors of control mice and mice treated with MK-0646, in A549 and H1437 cells treated either with an irrelevant human IgG or with MK-0646 for 3 weeks. (B) RT-Q-PCR of the EGF-R mRNA measured from the sources specified in (A). Columns represent the average of 4 independent experiments; bars represent standard deviation. (C) Immunoprecipitation of the EGF-R from the sources specified in (A) followed by immunoblot analysis using the specified antibodies. IgG lanes: immunoprecipitation performed using a pre-immune mouse IgG (negative control). (D) Biotinylation of cell-surface proteins; streptavidin pull-down followed by EGF-R immunocapture (see Materials and Methods for details) and Western blot analysis performed using the indicated antibodies. Note increased EGF-R phosphorylation both in plasma membrane proteins (Membrane) and in proteins not present at the plasma membrane (Cytosol), while the expression level of EGF-R protein appears elevated only in the plasma membrane fraction. IgG lanes: EGF-R immunoprecipitation performed using a pre-immune mouse IgG (negative control) (E) EGF-R immunoprecipitation followed by Western blot analysis using the indicated antibodies. IgG lanes: same as in (C) and (D).
Figure 5.

Akt appears to regulate amphiregulin mRNA expression levels. (A) Western blot analysis of the indicated proteins in 3 pooled cell lines re-derived after necropsies from lung tumors of control mice and mice treated with MK-0646 and in A549 cells treated either with an irrelevant human IgG or with MK-0646 for 3 weeks. (B) RT-Q-PCR of the amphiregulin mRNA expression levels in 4 control and MK-0646 treated mice lungs, in 4 cell lines re-derived after necropsies from lung tumors of control mice and mice treated with MK-0646, in A549 and H1437 cells treated either with an irrelevant human IgG or with MK-0646 for 3 weeks. Columns represent the average of 4 independent experiments; bars represent standard deviation. (C) A549 and H1437 cells were treated either with vehicle (C), with 50 ng/ml of IGF-1, or with 1 µM of MK-2206. Left, representative Western blot analysis; right, RT-Q-PCR of the amphiregulin mRNA. Columns represent the average of 4 independent experiments; bars represent standard deviation. (D) A549 and H1437 cells were transfected either with a control plasmid (C), with a plasmid expressing constitutively active Akt-1 (Myr-Akt), or with a plasmid expressing dominant negative Akt-1 (DN-Akt). Left, representative Western blot analysis; right, RT-Q-PCR of the amphiregulin mRNA. Columns represent the average of 4 independent experiments; bars represent standard deviation.
Since NSCLC cells treated with MK-0646 overactivated EGF-R both in vivo and in vitro, we questioned whether such cells could have become more sensitive to the EGF-R inhibitor erlotinib. To assess this hypothesis, we treated 5 NSCLC cell lines (A549, H226, H1437, H1299, and H1650) with MK-0646 for 3 weeks in vitro (control cells were exposed to an irrelevant human IgG). Control and MK-0646 treated cells were then exposed to 5 µM erlotinib. We measured Br-dU incorporation (an example is provided in Fig. 6A), and growth curves were assessed (Fig. 6B). In all cases, cells pretreated with MK-0646 displayed the highest sensitivity to erlotinib. In vivo results also confirmed that erlotinib treatment following 3 weeks of MK-0646 treatment significantly improved median survival of mice (Fig. 1). Paradoxically, combination therapy using MK-0646 and erlotinib from the beginning of treatment did not result in any significant survival advantage compared with treatment with erlotinib alone (Fig. 1). RTK arrays show that tumors from mice treated initially with both MK-0646 and erlotinib activated a number of alternative RTKs in different combinations (not shown).
Figure 6.

NSCLC cells treated for 3 weeks with MK-0646 are most sensitive to erlotinib growth inhibition. (A). Representative 5-bromo-2′-deoxyuridine incorporation/7AAD staining assay followed by FACS analysis of A549 cells exposed either to a pre-immune human IgG (C) or to MK-0646 for 3 weeks. From left to right: control cells, control cells exposed to 5 µM erlotinib, MK-0646 treated cells exposed to 5 µM erlotinib for 48 hours. Similar results were obtained in H1437 and H226 cells. (B). MTT assay of the indicated cell lines threatened for 3 weeks either with a pre-immune human IgG (C) or with MK-0646. Cells were exposed either to vehicle or to 5 µM erlotinib for 24, 48, and 72 hours. Curves summarize 3 independent experiments. Bars represent standard deviation. Similar results were obtained with dye exclusion/cell counting experiments in A549, H1437, H226, H1299, and H1650 cells.
Discussion
The main results of this study provided evidence that gamma-secretase inhibition is effective in specifically targeting a hypoxic tumor microenvironment. Inhibition of IGF-1R signaling was effective in prolonging median survival of mice when used as a single agent. Tumor evasion of IGF-1R targeting therapy was achieved through exacerbated activation of EGF-R. This situation led to significant sensitivity to an EGF-R inhibitor, erlotinib, in sequential therapy only.
In a previous study we gathered evidence that hypoxic tumor areas have increased Notch-1 activation, which leads to maximal IGF-1R expression and Akt-1 stimulation.16 This phenomenon can be explained by loss of the negative feedback loop operated by mTORC-1 activity on the insulin receptor substrate 1 (IRS-1). Indeed, mTORC-1 activity is suppressed in hypoxic tumor microenvironment,20 and autophagy is promoted in these tumor areas.21,22
In this study we wanted to target the prosurvival Notch-1/IGF-1R/Akt-1 axis using inhibitors of each component of this pathway, alone or in combination, to specifically interfere with hypoxic NSCLC cell survival. We limited the study to 2 cell lines in an orthotopic tumor model because a number of alternative cell lines did not yield an acceptable tumor engraftment in the lungs, while the same cell lines did reproducibly form subcutaneous tumors. An explanation for this phenomenon could be inherent in the highly oxygenated environment of the lung, which may interfere with the biology of NSCLC tumor initiating cells.2,15,23 We also decided to initiate therapy when the tumor burden was extensive because the majority of newly diagnosed NSCLC cases are at advanced stages (IIIB and mostly IV), and the median survival of these patients treated with best supportive care alone is a meager 3 to 4 months.24
GSI treatment proved effective in prolonging median survival and in depleting tumors of hypoxic microenvironment, confirming previous results that Notch-1 activity is required for survival of NSCLC cells in hypoxia.7,16 The vast majority of mice reached the end point of body weight loss. This is well explained by the known effects of simultaneous inhibition of Notch-1 and Notch-2 in the intestine, which directs the differentiation program of the renewing intestinal epithelium toward goblet cells rather than enterocytes.25,26 However, in humans this undesired side effect could be mitigated by parenteral supportive care, hence allowing a more prolonged treatment. We suggest that recently developed fully humanized monoclonal antibodies that prevent Notch-1 cleavage, and therefore its activation,26 could have scarce permeability into hypoxic tumor areas because these regions are deprived of oxygen, nutrients, and other biomolecules due to their distance from functional vasculature. The reduced metastasis that we observed in GSI treated mice confirms previous data indicating a crucial role for Notch signaling in promoting tumor cell motility in hypoxia.3 We observed synergism between GSI and cisplatin, confirming previous in vitro studies indicating that GSIs can sensitize cancer cells to cisplatin exposure.27
The pan-Akt inhibitor MK-2206 proved to be highly toxic in tumor-burdened animals, causing severe glucose intolerance and very rapid weight loss. This finding is in accordance with the phenotype of Akt-2 and Akt-3 double knockout mice, which are highly insulin and glucose intolerant and display a 25% reduction in body mass, and the lethal phenotype of the Akt triple knockout.28 However, She et al. 29 have used a similar compound alone (100 mg/kg for 5 consecutive days per week) and in combination with a MEK inhibitor in nude mice for more than 20 days, obtaining slower tumor growth of subcutaneous xenograft models. Hirai et al. 30 have used MK-2206 at a dose of 120 mg/kg with our administration schedule alone and in combination with lapatinib or erlotinib in nude mice for more than 15 days, also attaining slower tumor growth of subcutaneous xenograft models. We suggest that the discrepancy between our results and those obtained in the aforementioned studies could be explained by a higher susceptibility of NOD-SCID mice to Akt inhibition compared with nude mice or by differences in glucose consumption between a subcutaneous tumor model compared with multiple tumor masses in the lungs.
MK-0646 treatment was effective in significantly prolonging median survival of mice. Although the IGF-1R is maximally expressed in hypoxic tumor areas,16 treatment with this antibody did not appear to target the hypoxic tumor microenvironment specifically, probably due to the fact that a large molecule such as an antibody probably scarcely penetrates poorly vascularized tumor regions. We observed synergistic effects when MK-0646 was used in combination with MRK-003.
Although the original expectations in anticancer therapeutics targeting the IGF-1R are meeting growing disappointment due to toxicity,31 here we provide evidence that MK-0646 could be used in a window of time during therapeutic intervention to sensitize NSCLC cells to erlotinib. This drug is used as a second line therapeutic in patients who have failed standard carboplatin plus paclitaxel and extends median survival of about 3 months.32 Even though figitumumab, another humanized monoclonal antibody targeting the IGF-1R, did not improve overall survival in combination with carboplatin plus paclitaxel,33 MK-0646 could be implemented in sequential therapeutic strategies followed by erlotinib. Indeed, MK-0646 seems to increase the EGF-R expression and activation mainly through protein stabilization. Biotinylation experiments showed that MK-0646 treatment increased EGF-R expression at the plasma membranes rather than within cytosolic fractions, suggesting rapid recycling of the receptor. This concept is supported by the results obtained using a proteasomal inhibitor and an inhibitor of lysosomal functions; neither treatment caused any modification in the expression of EGF-R, while the expression levels of the IGF-1R were substantially modified (Fig. 3B). The overactivation and stabilization of the EGF-R could be due to the increased cell autonomous secretion of amphiregulin. This EGF-R ligand has been shown to cause both fast and slow EGF-R recycling and does not target EGF-R to lysosomal degradation.34 Moreover, amphiregulin stimulation of wild-type EGF-R has been shown to sensitize NSCLC cells to EGF-R inhibitors, which are mostly effective in patients with EGF-R activating mutations.35 Furthermore, immunohistochemistry studies suggested that NSCLC patients with high levels of amphiregulin expression and wild-type EGF-R better respond to EGF-R inhibitors.36
We have found that Akt-1 activation positively regulates the amphiregulin mRNA expression levels. Previous studies have placed Akt-1 downstream of amphiregulin/ErbB signaling.37,38 It is possible that in NSCLC cells a positive feedback loop exists between the ligand and 1 or more of its downstream effectors.
Materials and Methods
A list of all oligonucleotides used here is reported in Suppl. Table S3. A list of all antibodies is reported in Suppl. Table S4.
Cell culture
NSCLC cells (A549, H1437 and H226, H1299 and H1650) were grown in RPMI 1640 supplemented with 5% fetal bovine serum (FBS). All cell lines were fingerprinted using the GenePrint fluorescent STR system (Promega, Madison, WI). Prior to injection in mice, A549 and H1437 were transduced with a lentivirus expressing luciferase (ViraPowerTM T-Rex Lentiviral expression system, Grand Island, NY; see below for cloning details). Some experiments were performed in cell lines re-derived from mice’s lungs after necropsies obtained through mechanical dissociation of tumor nodules. After 5 passages, cell lines contained 100% human cells as assessed by Q-PCR using species-specific primers for GAPDH.
Reagents
γ-secretase inhibitor MRK-003, the humanized monoclonal IgG1 antibody against IGF-1R MK-0646, and the pan-Akt inhibitor MK-2206 were a generous gift of Merck & Co. (Whitehouse Station, NJ). Erlotinib (N-3-ethylnylphenyl)-6,7-bis(2-methoxyethoxy)-4 quinazolinamine) was donated by patients of the Loyola University Chicago Medical Center who had become unresponsive to it. IGF-1 was from Insight Genomics (Fall Church, VA). Cisplatin and NH4Cl were from Sigma-Aldrich (St. Louis, MO). MG-132 was from Calbiochem (San Diego, CA). The working concentrations and the duration of exposure used in each experiment are specified in the text and in figure legends. For TUNEL assays on 8-µm-thick slides obtained from frozen lungs, we first stained by immunofluorescence regions overexpressing glucose transporter 1 (GLUT-1) in green, and then we proceeded with TUNEL assays using the In Situ Cell Death Detection Kit, TMR red (Roche, Indianapolis, IN) following the manufacturer’s protocol.
Mouse procedures
Five-week-old female NOD.CB17-Prkdcscid/J mice (Jackson Laboratories, Bar Harbor, ME) were injected in the tail vein with 2.5 × 10⁶ cells in 100 µl of sterile saline solution. Mice were housed in a pathogen-free animal facility at Loyola University Medical Center. All procedures were performed in accordance with the Institutional Animal Care and Use Committee of the Loyola University Chicago Medical Center. Animals were treated as indicated in the text and were monitored daily until they reached one of the end points (observed: dyspnea or weight loss). At euthanasia, human cells comprised 93% ± 0.8% of the total lungs of mice. Tumor burden quantification was performed using bioluminescence imaging (Xenogen VivoVision IVIS 100 In Vivo Imaging System, Caliper Life Science, Hopkinton, MA) and by Q-PCR measuring human versus mouse GAPDH after euthanasia. Mice were monitored weekly for bioluminescence. All data analysis was performed with the Living Image 3.2 Software (Caliper) after i.p. injection of 0.25 mg of D-Luciferin (Gold Biotechnology, St Louis, MO) with animals under isoflurane anesthesia. Q-PCR was performed using human and mouse specific GAPDH primers designed after sequence alignments of human and GAPDH genomic regions (Clustalw software) to discriminate the 2 genes (Suppl. Table S3). Primers were carefully validated, and calibration curves to match Q-PCR results to cell number were developed. Lungs, livers, and brains were dissected and flash frozen for molecular analyses.
Plasma glucose concentration was measured from 100 µl of blood drawn from the lateral tail vein of mice prior euthanasia using the Glucose Assay Kit (Eton Bioscience Inc., Cambridge, MA) following the manufacturer’s instructions.
Plasmids and lentiviral systems
Constitutively active Akt1 (NH2-terminal myristoylatable Akt1, Myr-Akt1) and dominant negative Akt1, K179M mutant Akt1) cloned into the pUSEamp(+) expression plasmid (pUSE empty vector was used as the negative control) were purchased from Upstate (Millipore, Temecula, MA). Transient transfections were done using Fugene HD (Promega, Madison, WI) according to the manufacturer’s instructions. Efficiency of transfection was greater than 95%.
The luciferase gene was excised from pGL2 basic vector (Promega) by restriction digestion at the KpnI and BamHI sites and ligated into the KpnI and EcoRI sites of pENTR4 (Invitrogen, Grand Island, NY; the incompatibility between the BamHI and EcoRI sites was circumvented using a linker oligonucleotide in the ligation mixture). The luciferase sequence was transferred via Gateway recombination into the lentiviral backbone plasmid pLenti4/TO/V5-DEST (ViraPower T-Rex Lentiviral Expression System, Invitrogen). To generate luciferase stable cell lines, cells were infected with packaged lentivirus. Transduction and selection of cells were done as recommended (Invitrogen). Luciferase expression was verified by Dual-Luciferase Reporter Assay System (Promega) as recommended by the manufacturer, and relative light units (RLUs) were measured using a Femtomaster FB15 luminometer (Zylux Corporation, Maryville, TN).
RTK arrays
Human Phospho-RTK (Human Phospho-RTK Array Kit, R&D Systems Inc., Minneapolis, MN) arrays were used according to the manufacturer’s instructions. Briefly, tumor tissue was washed with cold PBS and homogenated in NP-40 lysis buffer (1% NP-40, 20 mM Tris-HCl, pH 8.0, 137 mM NaCl, 10% glycerol, 2 mM EDTA, 1 mM sodium orthovanadate, 10 µg/ml Aprotinin, 10 µg/mL Leupeptin, and 10 µg/mL Pepstatin), and 250 µg of cell homogenate was incubated with preblocked membranes overnight. Membranes were subsequently washed and incubated with freshly diluted detection antibody (anti-phospho-tyrosine-HRP) for 2 hours at room temperature (R.T.) on a rocking platform shaker. Spots were detected using enhanced chemiluminescence (ECL) and exposed to x-ray films.
Protein phosphorylation expression and analysis
Western blot analyses were performed as previously described.7 After ECL development, as an additional control for equal loading, nitrocellulose membranes were stained with Ponceau S solution (Sigma-Aldrich). The working dilutions for each primary antibody were those recommended by the various manufacturers. For immunoprecipitation, lysates were incubated overnight at 4°C with a specific primary antibody followed by 1 hour of incubation with Protein G-agarose beads (Santa Cruz Biotech, CA). The immunoprecipitates were washed 3 times with lysis buffer and resolved by SDS-PAGE.
Gene expression analysis
Quantitative reverse transcriptase real time PCR (Q-RT-PCR) using SYBR green incorporation was performed as previously described.7 Total RNA from cultured cells was extracted with the RNeasy Mini kit (Qiagen, Valencia, CA). cDNA was synthesized using iScript Reverse Transcription Supermix RT-qPCR (Bio-Rad Laboratories, Hercules, CA). Quantitative real-time PCR was done with SYBR Green PCR Master Mix (Applied Biosystems, Foster City, CA, USA) in an ABI 7300 thermal cycler (Applied Biosystems). For each sample, serial dilutions of cDNA templates were measured in triplicate. Non–reverse transcription reactions served as controls. All measurements were normalized for human ribosomal protein RPL13A mRNA.
Cell surface biotinylation
For biotinylation of cell membrane proteins, cells were washed with ice-cold PBS and then incubated for 1 hour at 4°C with Sulfosuccinimidobiotin (EZ-Link Sulfo-NHS-Biotin; Pierce Biotechnology, Rockford, IL) freshly dissolved in H2O (2 mM final concentration). The reaction was blocked by rinsing the cells 3 times with 100 mM glycine in PBS. Cell lysates were incubated for 1 hour at 4°C with streptavidin-agarose (Sigma-Aldrich) to pull down biotinylated membrane proteins. The supernatant was stored for further manipulation (first fraction). Streptavidin-biotin complexes (surface protein enriched fraction) were incubated overnight at 4°C with a primary antibody specific for EGF-R. The suspension was then incubated for 1 hour with protein A conjugated to magnetic beads (Millipore), and immunocomplexes were captured using a dedicated magnet. To estimate the amount of EGF-R not biotinylated (therefore not present on the plasma membrane), the first fraction was immunoprecipitated using an antibody specific for EGF-R.
Cell viability and proliferation
NSCLC cells were plated in 100 µl of RPMI with 5% FBS into 96-well cell culture plates (5,000 cells/well). Cell viability was determined by using the 3-(4,5-dimethylthiazol-2-yl)-2,5-diphenyltetrazolium bromide cell MTT assay kit (Roche) according to the manufacturer’s instructions. The spectrophotometric absorbance was measured at 575 nm using a fluorescent multiplate reader (Polar Star Omega, Ortemberg, Germany). The results were expressed as mean ± SD of 3 independent experiments. In parallel, dye exclusions and cell count assays were performed.
Proliferation was analyzed by bromodeoxyuridine (BrdU) incorporation (FITC BrdU Flow kit, BD Pharmingen, San Diego, CA)/7-aminoactinomycin D (7-AAD, Sigma-Aldrich) staining followed by FACS analysis using a BD FACS Canto II instrument (Becton Dickinson, San Jose, CA) measuring 30,000 events for each sample.
Statistical analyses
We performed statistical analysis by Student t test. Values were considered statistically significant at P < 0.05 in 2-tailed tests. Survival curves were analyzed using the Mantel-Cox and Gehan-Breslow-Wilcoxon tests (Prism 5 software).
Acknowledgments
We thank Merck & Co., Inc., Whitehouse Station, New Jersey, for providing MRK-003, MK-0646, and MK-2206. We thank Dr. Kathy Albain, who facilitated the procurement of erlotinib.
Footnotes
Supplementary material for this article is available on the Genes & Cancer website at http://ganc.sagepub.com/supplemental.
Declaration of Conflicting Interests: The authors declare no potential conflicts of interests with respect to the research, authorship, and/or publication of this article.
Funding: The author(s) disclosed receipt of the following financial support for the research, authorship, and/or publication of this article: This work has been supported by NCI grant R01 CA134503 (M.B.).
References
- 1. Brown JM. Tumor hypoxia in cancer therapy. Methods Enzymol. 2007;435:297-321 [DOI] [PubMed] [Google Scholar]
- 2. Keith B, Simon MC. Hypoxia-inducible factors, stem cells, and cancer. Cell. 2007;129:465-72 [DOI] [PMC free article] [PubMed] [Google Scholar]
- 3. Sahlgren C, Gustafsson MV, Jin S, et al. Notch signaling mediates hypoxia-induced tumor cell migration and invasion. Proc Natl Acad Sci U S A. 2008;105:6392-7 [DOI] [PMC free article] [PubMed] [Google Scholar]
- 4. DeYoung MP, Horak P, Sofer A, et al. Hypoxia regulates TSC1/2-mTOR signaling and tumor suppression through REDD1-mediated 14-3-3 shuttling. Genes Dev. 2008;22:239-51 [DOI] [PMC free article] [PubMed] [Google Scholar]
- 5. Gwinn DM, Shackelford DB, Egan DF, et al. AMPK phosphorylation of raptor mediates a metabolic checkpoint. Mol Cell. 2008;30: 214-26 [DOI] [PMC free article] [PubMed] [Google Scholar]
- 6. Milas L, Hittelman WN. Cancer stem cells and tumor response to therapy: current problems and future prospects. Semin Radiat Oncol. 2009;19:96-105 [DOI] [PubMed] [Google Scholar]
- 7. Chen Y, De Marco MA, Graziani I, et al. Oxygen concentration determines the biological effects of NOTCH-1 signaling in adenocarcinoma of the lung. Cancer Res. 2007;67:7954-9 [DOI] [PubMed] [Google Scholar]
- 8. Artavanis-Tsakonas S, Rand MD, Lake RJ. Notch signaling: cell fate control and signal integration in development. Science. 1999;284:770-776 [DOI] [PubMed] [Google Scholar]
- 9. Lai EC. Notch cleavage: Nicastrin helps Presenilin make the final cut. Curr Biol. 2002;12:R200-2 [DOI] [PubMed] [Google Scholar]
- 10. Mumm JS, Schroeter EH, Saxena MT, et al. A ligand-induced extracellular cleavage regulates gamma-secretase-like proteolytic activation of Notch1. Mol Cell. 2000;5:197-206 [DOI] [PubMed] [Google Scholar]
- 11. Struhl G, Adachi A. Nuclear access and action of notch in vivo . Cell. 1998;93:649-60 [DOI] [PubMed] [Google Scholar]
- 12. Miele L. Notch signaling. Clin Cancer Res. 2006;12:1074-1079 [DOI] [PubMed] [Google Scholar]
- 13. Mammucari C, Tommasi di, Vignano A, et al. Integration of Notch 1 and calcineurin/NFAT signaling pathways in keratinocyte growth and differentiation control. Dev Cell. 2005;8:665-76 [DOI] [PubMed] [Google Scholar]
- 14. Graziani I, Eliasz S, De Marco MA, et al. Opposite effects of Notch-1 and Notch-2 on mesothelioma cell survival under hypoxia are exerted through the Akt pathway. Cancer Res. 2008;68:9678-85 [DOI] [PubMed] [Google Scholar]
- 15. Gustafsson MV, Zheng X, Pereira T, et al. Hypoxia requires notch signaling to maintain the undifferentiated cell state. Dev Cell. 2005;9:617-28 [DOI] [PubMed] [Google Scholar]
- 16. Eliasz S, Liang S, Chen Y, et al. Notch-1 stimulates survival of lung adenocarcinoma cells during hypoxia by activating the IGF-1R pathway. Oncogene. 2010;29:2488-98 [DOI] [PMC free article] [PubMed] [Google Scholar]
- 17. Konishi J, Kawaguchi KS, Vo H, et al. Gamma-secretase inhibitor prevents Notch3 activation and reduces proliferation in human lung cancers. Cancer Res. 2007;67:8051-7 [DOI] [PubMed] [Google Scholar]
- 18. Landor SK, Mutvei AP, Mamaeva V, et al. Hypo- and hyperactivated Notch signaling induce a glycolytic switch through distinct mechanisms. Proc Natl Acad Sci U S A. 2011;108:18814-9 [DOI] [PMC free article] [PubMed] [Google Scholar]
- 19. Chandarlapaty S, Sawai A, Scaltriti M, et al. AKT inhibition relieves feedback suppression of receptor tyrosine kinase expression and activity. Cancer Cell. 2011;19:58-71 [DOI] [PMC free article] [PubMed] [Google Scholar]
- 20. Vadysirisack DD, Ellisen LW. mTOR activity under hypoxia. Methods Mol Biol. 2012;821:45-58 [DOI] [PMC free article] [PubMed] [Google Scholar]
- 21. Noman MZ, Janji B, Kaminska B, et al. Blocking hypoxia-induced autophagy in tumors restores cytotoxic T-cell activity and promotes regression. Cancer Res. 2011;71:5976-86 [DOI] [PubMed] [Google Scholar]
- 22. Hu YL, Delay M, Jahangiri A, et al. Hypoxia-induced autophagy promotes tumor cell survival and adaptation to antiangiogenic treatment in glioblastoma. Cancer Res. 2012;72:1773-83 [DOI] [PMC free article] [PubMed] [Google Scholar]
- 23. Conley SJ, Gheordunescu E, Kakarala P, et al. Antiangiogenic agents increase breast cancer stem cells via the generation of tumor hypoxia. Proc Natl Acad Sci U S A. 2012;109:2784-9 [DOI] [PMC free article] [PubMed] [Google Scholar]
- 24. Stage IV NSCLC treatment. Bethesda, MD: National Cancer Institute; Available from: http://www.cancer.gov/cancertopics/pdq/treatment/non-small-cell-lung/HealthProfessional/page11 [Google Scholar]
- 25. Riccio O, van Gijn ME, Bezdek AC, et al. Loss of intestinal crypt progenitor cells owing to inactivation of both Notch1 and Notch2 is accompanied by derepression of CDK inhibitors p27Kip1 and p57Kip2. EMBO Rep. 2008;9:377-83 [DOI] [PMC free article] [PubMed] [Google Scholar]
- 26. Wu Y, Cain-Hom C, Choy L, et al. Therapeutic antibody targeting of individual Notch receptors. Nature. 2010;464:1052-7 [DOI] [PubMed] [Google Scholar]
- 27. Song LL, Peng Y, Yun J, et al. Notch-1 associates with IKKalpha and regulates IKK activity in cervical cancer cells. Oncogene. 2008;27:5833-44 [DOI] [PubMed] [Google Scholar]
- 28. Dummler B, Tschopp O, Hynx D, et al. Life with a single isoform of Akt: mice lacking Akt2 and Akt3 are viable but display impaired glucose homeostasis and growth deficiencies. Mol Cell Biol. 2006;26:8042-51 [DOI] [PMC free article] [PubMed] [Google Scholar]
- 29. She QB, Halilovic E, Ye Q, et al. 4E-BP1 is a key effector of the oncogenic activation of the AKT and ERK signaling pathways that integrates their function in tumors. Cancer Cell. 2010;18:39-51 [DOI] [PMC free article] [PubMed] [Google Scholar]
- 30. Hirai H, Sootome H, Nakatsuru Y, et al. MK-2206, an allosteric Akt inhibitor, enhances antitumor efficacy by standard chemotherapeutic agents or molecular targeted drugs in vitro and in vivo . Mol Cancer Ther. 2010;9:1956-67 [DOI] [PubMed] [Google Scholar]
- 31. Pollak M. The insulin and insulin-like growth factor family in neoplasia: an update. Nat Rev Cancer. 2012;12:159-69 [DOI] [PubMed] [Google Scholar]
- 32. Gentech Biooncology. Available from: http://www.tarceva.com/docs/Indication_Announcement_Letter.pdf
- 33. Pharma strategy blog. Available from: http://pharmastrategyblog.com/2009/12/pfizer-terminates-figitumumab-trial-in-lung-cancer-for-futility.html/
- 34. Roepstorff K, Grandal MV, Henriksen L, et al. Differential effects of EGFR ligands on endocytic sorting of the receptor. Traffic. 2009;10:1115-27 [DOI] [PMC free article] [PubMed] [Google Scholar]
- 35. Yonesaka K, Zejnullahu K, Lindeman N, et al. Autocrine production of amphiregulin predicts sensitivity to both gefitinib and cetuximab in EGFR wild-type cancers. Clin Cancer Res. 2008;14:6963-73 [DOI] [PMC free article] [PubMed] [Google Scholar]
- 36. Chang MH, Ahn HK, Lee J, et al. Clinical impact of amphiregulin expression in patients with epidermal growth factor receptor (EGFR) wild-type nonsmall cell lung cancer treated with EGFR-tyrosine kinase inhibitors. Cancer. 2011;117:143-51 [DOI] [PubMed] [Google Scholar]
- 37. Yotsumoto F, Fukami T, Yagi H, et al. Amphiregulin regulates the activation of ERK and Akt through epidermal growth factor receptor and HER3 signals involved in the progression of pancreatic cancer. Cancer Sci. 2010;101:2351-60 [DOI] [PMC free article] [PubMed] [Google Scholar]
- 38. Dong A, Gupta A, Pai RK, et al. The human adenocarcinoma-associated gene, AGR2, induces expression of amphiregulin through Hippo pathway co-activator YAP1 activation. J Biol Chem. 2011;286:18301-10 [DOI] [PMC free article] [PubMed] [Google Scholar]