

Abstract
This study examines the chromatin structure encompassing replication origins in transformed and normal cells. Analysis of the global levels of histone H3 acetylated at K9&14 (open chromatin) and histone H3 trimethylated at K9 (closed chromatin) revealed a higher ratio of open to closed chromatin in the transformed cells. Also, the trithorax and polycomb group proteins, Brg-1 and Bmi-1, respectively, were overexpressed and more abundantly bound to chromatin in the transformed cells. Quantitative comparative analyses of episomal and in situ chromosomal replication origin activity as well as chromatin immunoprecipitation (ChIP) assays, using specific antibodies targeting members of the pre-replication complex (pre-RC) as well as open/closed chromatin markers encompassing both episomal and chromosomal origins, revealed that episomal origins had similar levels of in vivo activity, nascent DNA abundance, pre-RC protein association, and elevated open chromatin structure at the origin in both cell types. In contrast, the chromosomal origins corresponding to 20mer1, 20mer2, and c-myc displayed a 2- to 3-fold higher activity and pre-RC protein abundance as well as higher ratios of open to closed chromatin and of Brg-1 to Bmi-1 in the transformed cells, whereas the origin associated with the housekeeping lamin B2 gene exhibited similar levels of activity, pre-RC protein abundance, and higher ratios of open to closed chromatin and of Brg-1 to Bmi-1 in both cell types. Nucleosomal positioning analysis, using an MNase-Southern blot assay, showed that all the origin regions examined were situated within regions of inconsistently positioned nucleosomes, with the nucleosomes being spaced farther apart from each other prior to the onset of S phase in both cell types. Overall, the results indicate that cellular transformation is associated with differential epigenetic regulation, whereby chromatin structure is more open, rendering replication origins more accessible to initiator proteins, thus allowing increased origin activity.
Keywords: DNA replication, nascent DNA abundance, chromatin structure, chromatin immunoprecipitation, transformed vs. normal
Accurate and complete duplication of the eukaryotic genome and epigenome relies on the initiation of DNA replication from specific chromosomal regions, termed origins, within a stringently controlled sequential program during S phase. Activity and spatiotemporal control of initiation of DNA replication is exerted at the origin site.1 Origin activation involves the binding of the hexameric Origin Recognition Complex (ORC1-6), which nucleates the assembly of the pre-replication complex (pre-RC) by sequential recruitment of Cdc6, Cdt1, and MCM2-7.2-4 Assembly of the pre-RC on the selected origin regions licenses the origins and the subsequent activity of cyclin-dependent kinases (Cdks), and the Dbf4-dependent kinase leads the cells into S phase as well as triggers the recruitment of replication proteins required for origin unwinding and DNA synthesis.4,5
There are approximately 104 to 106 replication origins per mammalian genome, each located in the center of a replication unit (replicon), whose average size varies from 10 to 300 kb, depending on the stage of development, growth conditions, or cell transformation status.6-9 Unlike lower eukaryotes, where DNA replication initiates from well-defined consensus sequences, such as the 11-bp consensus of the autonomously replication sequences (ARS) of Saccharomyces cerevisiae,10 replication origins of higher eukaryotes display relatively high levels of degeneracy.11,12 ORCs do not bind replication origins with sequence specificity in vitro, suggesting that DNA sequence alone is not sufficient to specify the location of an origin.13,14 Thus, in metazoa, both origin selection and temporal activation are characterized by plasticity.15
Numerous studies have shown a role for chromatin structure in the plasticity associated with both timing and frequency of origin activity.16 For example, the human beta-globin locus replicates early in S-phase in pre-erythroid cells that express globin but late in nonerythroid cells that do not express it. Furthermore, when HeLa cells were treated with the histone deacetylase (HDAC) inhibitor trichostatin A (TSA), replication origin activity changed from being localized to site-specific origins to exhibiting a more widespread zonal pattern of initiation regions, while the late-firing beta-globin origin became an early-firing origin.17 The HDAC specific for deacetylating histone H3 K9&14 and histone H4 K16, SIR2, inhibits activation of some origins, but not others,18,19 by promoting chromatin structure that is unfavorable for pre-RC assembly.20 In S. cerevisiae, when the HDAC Rpd3 was deleted, many late-firing origins were activated earlier,21,22 whereas the deletion of the SIR3 and Ku proteins, involved in silencing chromatin at telomeres, caused certain origins to replicate at an earlier time.23,24 In Drosophila melanogaster, DNA accessibility is increased at chromosomal regions that replicate early, at sites of replication initiation and at sites that are hyperacetylated at histone H4K16 as well as at active promoters; conversely, chromosomal regions that replicate late and sites that harbor increased amounts of trimethylated histone H3K27 are least accessible, supporting a model for polycomb-mediated chromatin compaction.25 In humans, origin selection is influenced by transcriptional regulation and chromatin structure, as origin activity was shown to be significantly enriched around transcription start sites with a significant number of initiation events occurring within the vicinity of RNA polymerase II binding sites; furthermore, the chromatin signatures around the origins were enriched in di/trimethylated histone H3K4 and histone H3 acetylation, denoting the affinity of origins for open chromatin.26 DNA methylation has also been postulated as a determinant of certain replication origins,27-29 possibly by way of altering chromatin structure encompassing the origin, playing a role in nucleosome positioning.30
Several studies have shown that increased origin usage is a common feature in transformed compared with normal cells.31-40 Considering the importance of chromatin structure in origin activation, we examined the epigenetic environment at replication origins as well as their association with chromatin modifying factors in both transformed and normal cells. A comparative analysis of the chromatin structure encompassing replication origins in normal and transformed cells will aid in the understanding of why some origins are more active in transformed compared with normal cells,33-36,38 having an elevated association of pre-RC proteins,40 and thus may give us insight into the mechanisms that regulate the initiation of DNA replication in normal cells and how it may become deregulated by cellular transformation.
In this study, we comparatively analyzed the role of chromatin structure both ectopically and endogenously at replication origins between transformed and normal cells. Episomal analysis of autonomously replicating sequences by transient replication assays combined with nascent strand and ChIP assays revealed that the replication origins examined had equivalent open chromatin structure at the origin sequences in both cell types, thus accommodating similar levels of pre-RC protein binding at the origin and resulting in equal origin activity in both cell types. In contrast, in situ chromosomal (endogenous) analysis of the same origins, by nascent strand and ChIP assays, revealed a differential chromatin structure between transformed and normal cells. Replication origins that have been shown to be more active in the transformed cells compared with the normal cells, such as the 20mer1, 20mer2, and c-myc origins,33-36,40 were found to have a more open chromatin structure and higher levels of the trithorax protein Brg-1 (catalytic subunit of mammalian SWI/SNF-related complexes)41 compared with the polycomb protein Bmi-1 (key regulatory component of the PRC1 complex)42 at the origins in transformed compared with normal cells, resulting in more pre-RC proteins binding to the origins in the former, leading to higher origin activity. In contrast, there was no difference in the chromatin structure and high levels of Brg-1 compared with Bmi-1 at the lamin B2 origin in both cell types, resulting in similar levels of pre-RC binding at the origin and equal levels of origin activity in both cell types.40 Moreover, the overall level of open chromatin structure (histone H3 acetylated at K9&14) was higher in the transformed cells, and the overall level of closed chromatin (histone H3 tri-methylated at K9) was higher in the normal cells. Interestingly, analysis of nucleosome positioning by an MNase-Southern blot assay revealed that all the replication origins examined were located within inconsistently positioned nucleosomes, whose location rearranges prior to the beginning of S phase in both cell types.
Results
Autonomous replication activity of plasmids containing the 20bp consensus sequence in both normal and transformed cells
The ability of several versions of the 20mer present within human chromosomes to confer autonomous replication activity when cloned into a plasmid was analyzed by the DpnI resistance assay, which is an indicator of semiconservative DNA replication, as previously described.12,36,38
HeLa, NSF, WI38, and WI38(SV40) cells (Fig. 1A, B) were transfected with one of the following constructs (Suppl. Table 3): pA3/4, containing a version of the 36bp human consensus sequence (positive control12); p20mer1, containing a version of the 20bp consensus sequence found in the ~211kb region of human chromosome 19q1336; p20mer1F, containing 171bp of endogenous chromosomal sequence including the version of the 20bp human consensus sequence of the p20mer1 construct located in the ~211kb region of human chromosome 19q13; p20merC, containing genomic sequence found within the ~211kb region of human chromosome 19q13 that does not contain a version of the 20bp consensus sequence (negative control36); pLB2, containing a version of the 20bp consensus sequence included in the origin of bidirectional replication (OBR) of the lamin B2 locus36,38; p20mer(LB2)1F, which is the same construct as p20mer1F except that the version of the 20bp human consensus sequence of the p20mer1 construct has been mutated to a version of the 20bp human consensus sequence included in the OBR of the lamin B2 locus; pLB2C1, containing genomic sequence found within the lamin B2 locus that does not contain a version of the 20bp consensus sequence (negative control for the lamin B2 locus36,38,43); p20mer(LB2C1)1F, which is the same construct as p20mer1F except that the version of the 20bp human consensus sequence of the p20mer1 construct has been mutated to a sequence that is not a version of the 20bp consensus that serves as a negative control for the lamin B2 locus; pBluescript vector without an insert (negative control); pM1 SEAP vector that was co-transfected with each construct to normalize for the transfection efficiency; finally, a mock transfection without any construct was performed as an additional negative control. At 72 hours post transfection, plasmid DNA was isolated and digested with DpnI, and the DpnI-digested DNA was used to transform Escherichia coli. After 18 hours the number of colonies produced was counted, corrected for the amount of DNA recovered, and related to the positive control reaction of construct pA3/4, which was taken as 100% (Fig. 1A, B).
Figure 1.

Episomal replication activity of 20mer constructs in transformed and normal cells. Histogram plot of the number of bacterial colonies produced after transformation of E. coli with DpnI-digested Hirt extracts of (A) HeLa and NSF cells, (B) WI38(SV40) and WI38 cells transfected for 72 hours with one of the following constructs (refer to Suppl. Table 3): pA3/4, p20mer1, p20mer1F, p20merC, pLB2, p20mer(LB2)1F, pLB2C1, p20mer(LB2C1)1F, and pBluescript. The average number of DpnI-resistant colonies per plate was corrected for the amount of DNA recovered and normalized to the number of colonies obtained with pA3/4 (positive control), which was taken as 100%. The number at the bottom of each bar denotes the average number of colonies obtained from 3 experiments. The error bars represent the average of 3 experiments performed in triplicate and 1 standard deviation.
As expected of mammalian replication origins, which are activated only once per cell cycle, a relatively small number of colonies (ranging from 27.0 to 34.1) were produced, on average, by even the most efficiently replicating construct pA3/4 (Fig. 1A, B), in agreement with previous results.36,38 The constructs p20mer1, p20mer1F, pLB2, and p20mer(LB2)1F replicated as efficiently as pA3/4, which displayed the most efficient replication, as shown before.12 In contrast, the control constructs p20merC, pLB2C1, and p20mer(LB2C1)1F were unable to confer autonomous replication, suggesting that versions of the 20mer origin consensus sequence were necessary to act as replication initiation sites. No bacterial colonies were obtained with DpnI-digested DNA recovered either when the backbone vector (pBluescript) had been transfected, as observed before,44 or from the mock transfections. These results also confirmed the previous finding that the 20bp consensus sequence is a minimal core element required for control of autonomous replication.12,36 Interestingly, the same level of in vivo DNA replication of all the aforementioned replication-competent constructs was observed for both normal (NSF & WI38) and transformed cells (HeLa & WI38(SV40)) (Fig. 1A, B), suggesting that the sequences that have been cloned into these constructs act as initiators in both cell types with similar levels of activity.
To examine the mechanism by which these constructs were able to support autonomous replication in both normal and transformed cells, we designed primer sets allowing us to measure the abundance of nascent and ChIP DNA that was extracted solely from plasmid but not genomic DNA (Suppl. Fig. 2).
Nascent DNA, pre-RC, and histone abundance at plasmids containing the 20bp consensus sequence in both normal and transformed cells
For a more quantitative analysis, the episomal replication assay was repeated, this time measuring the abundance of nascent DNA by quantitative PCR, as previously described.36,38 At 72 hours post transfection with the p20mer1, p20mer1F, p20merC, and pBluescript constructs, nascent DNA was extracted from the cells and its abundance was measured at 2 reference points, the insert sequence (plasmid +ve region) as well as a non-origin- containing sequence (plasmid −ve region) located ~1.5 kb away from the plasmid +ve region.
For the p20mer1 construct, there was a 13.8-fold and 11.6-fold enrichment of plasmid +ve compared with plasmid −ve amplification in HeLa and NSF cells, respectively (Fig. 2A), and a 14.1-fold and 10.3-fold enrichment of plasmid +ve compared with plasmid −ve amplification in WI38(SV40) and WI38 cells, respectively (Fig. 2B); for the p20mer1F construct, there was a 10.6-fold and 10.7-fold enrichment of plasmid +ve compared with plasmid −ve amplification in HeLa and NSF cells, respectively (Fig. 2A), and a 12.3-fold and 12.1-fold enrichment of plasmid +ve compared with plasmid −ve amplification in WI38(SV40) and WI38 cells, respectively (Fig. 2B); for the control p20merC and pBluescript constructs, there was no enrichment of plasmid +ve compared with plasmid −ve amplification in either the normal or transformed cells (Fig. 2A, B).
Figure 2.

(A, B) Comparative analysis of episomal nascent DNA abundance in transformed and normal cells. Histogram plots of the quantification by real-time PCR of nascent DNA abundance (ng) at the p20mer1, p20mer1F, p20merC, and pBluescript episomal constructs in the transformed cell line {HeLa} and normal cell line {NSF} (A) and in the transformed cell line {WI38(SV40)} and normal cell line {WI38} (B). The location and sequence information of the primers used for the amplification of the +ve region with insert (gray bars) and the −ve region without insert (white bars) are as described in Suppl. Table 4. The error bars represent the average of at least 2 experiments performed in triplicate and 1 standard deviation. (C, D) In vivo association of ORC2, Cdc6, and Cdt1 with episomal constructs in transformed and normal cells. Histogram plots of the quantification by real-time PCR of immunoprecipitated DNA abundance (ng) at the p20mer1, p20mer1F, p20merC, and pBluescript episomal constructs in the transformed cell line {HeLa} and normal cell line {NSF} (C) and in the transformed cell line {WI38(SV40)} and normal cell line {WI38} (D). ChIP was performed with antibodies directed against ORC2 (dark gray bars), Cdc6 (white bars), and Cdt1 (light gray bars); normal rabbit serum (NRS) (black bars) was used as a negative control. The primer sets of the +ve region and the −ve region are as described in Suppl. Table 4. The error bars represent the average of at least 2 experiments performed in triplicate and 1 standard deviation. (E, F) In vivo association of histone H3 Ac K9&14 and histone H3 tri-Me K9 with episomal constructs in transformed and normal cells. Histogram plots of the quantification by real-time PCR of immunoprecipitated DNA abundance (ng) at the p20mer1, p20mer1F, p20merC, and pBluescript episomal constructs in the transformed cell line {HeLa} and normal cell line {NSF} (E) and in the transformed cell line {WI38(SV40)} and normal cell line {WI38} (F). ChIP was performed with antibodies directed against histone H3 Ac K9&14 (dark gray bars) and histone H3 tri-Me K9 (white bars); NRS (black bars) was used as a negative control. The primer sets of the +ve region and the −ve region are as described in Suppl. Table 4. The error bars represent the average of at least 2 experiments performed in triplicate and 1 standard deviation.
These results correlate with those shown in Fig. 1A, B, as p20mer1 and p20mer1F, but not p20merC or pBluescript, were able to initiate replication within their insert sequence, conferring autonomous replication activity to their respective plasmids. Moreover, the levels of nascent DNA detected at the insert sequences of p20mer1 and p20mer1F were comparable in both normal and transformed cells (Fig. 2A, B).
To analyze whether the initiation at the insert sequences of p20mer1 and p20mer1F observed above involved formation of a pre-RC at those sequences, a ChIP assay was used. Again, the episomal replication assay was repeated as above, using the p20mer1, p20mer1F, p20merC, and pBluescript constructs. At 72 hours post transfection, plasmid DNA from both cell types was immunoprecipitated with antibodies against the pre-RC proteins ORC2, Cdc6, and Cdt1, and its abundance in origin-containing sequence (plasmid +ve region) and non-origin-containing sequence (plasmid −ve region) was determined by real-time PCR.
For the p20mer1 construct, the enrichment of ORC2, Cdc6, and Cdt1 varied from 8.2- to 12.8-fold for the plasmid +ve region over the plasmid −ve region in HeLa and NSF cells (Fig. 2C) and 8.6- to 12.6-fold for the plasmid +ve region over the plasmid −ve region in WI38(SV40) and WI38 cells (Fig. 2D). For the p20mer1F construct, the enrichment of ORC2, Cdc6, and Cdt1 varied from 8.9- to 13.3-fold for the plasmid +ve region over the plasmid −ve region in HeLa and NSF cells (Fig. 2C) and 8.5- to 13.4-fold for the plasmid +ve region over the plasmid −ve region in WI38(SV40) and WI38 cells (Fig. 2D). For the p20merC and pBluescript constructs, there was no enrichment of the pre-RC proteins at the plasmid +ve region over the plasmid −ve region in either the normal or transformed cells (Fig. 2C, D).
These results are in agreement with the origin activity profiles observed (Fig. 1A, B, and Fig. 2A, B), with the pre-RC association paralleling the abundance of the nascent strands generated from the constructs. Only the replicating plasmids, p20mer1 and p20mer1F, were bound by ORC2, Cdc6, and Cdt1 at comparable levels in both normal and transformed cells, unlike the nonreplicating p20merC and pBluescript constructs (Fig. 2C, D).
Having confirmed that replication start sites are present within the p20mer1 and p20mer1F inserts and are bound by pre-RC proteins, we next comparatively analyzed the abundance of histones on these plasmids in both cell types. Again, the episomal replication assay was repeated as above with the p20mer1, p20mer1F, p20merC, and pBluescript constructs. At 72 hours post transfection, plasmid DNA from both cell types was immunoprecipitated with antibodies against histone H3 total, histone H3 Ac K9&14, and histone H3 tri-Me K9, and its abundance at origin-containing (plasmid +ve region) and non-origin-containing sequence (plasmid −ve region) was determined by real-time PCR.
To normalize for the amount of histone H3 modifications present on the plasmids, the total histone H3 bound to the constructs was analyzed in both normal and transformed cells. All constructs exhibited no enrichment of histone H3 total for the plasmid +ve region over the plasmid −ve region in both HeLa and NSF cells (Suppl. Fig. 3A) and WI38(SV40) and WI38 cells (Suppl. Fig. 3B), permitting measurement of the ectopic plasmid in vivo association of specific modifications of histone H3.
Regarding a marker of open chromatin, for both the p20mer1 and p20mer1F constructs, the enrichment of histone H3 Ac K9&14 varied from 5.2- to 7.3-fold for the plasmid +ve region over the plasmid −ve region in HeLa and NSF cells (Fig. 2E) and varied from 5.7- to 8.3-fold for the plasmid +ve region over the plasmid −ve region in WI38(SV40) and WI38 cells (Fig. 2F). In contrast, for both the p20merC and pBluescript constructs, there was no enrichment of the histone H3 Ac K9&14 at the plasmid +ve region over the plasmid −ve region in either the normal or transformed cells (Fig. 2E, F).
Regarding a marker of closed chromatin, for all constructs, there was no enrichment of the histone H3 tri-Me K9 at the plasmid +ve region over the plasmid −ve region in either the normal or transformed cells (Fig. 2E, F).
Again, these results are in agreement with the origin activity profiles observed (Fig. 1A, B, and Fig. 2A, B) and the association of pre-RC proteins with these plasmids (Fig. 2C, D), as p20mer1 and p20mer1F exhibit higher levels of open (histone H3 Ac K9&14) compared with closed (histone H3 tri-Me K9) chromatin at the insert sequence at comparable levels in both the normal and transformed cells (Fig. 2E, F). In contrast, both p20merC and pBluescript exhibit higher levels of closed (histone H3 tri-Me K9) compared with open (histone H3 Ac K9&14) chromatin at the insert sequence at comparable levels in both the normal and transformed cells, as is the case for all constructs at the control sequence (Fig. 2E, F). Hence, an open chromatin structure at the insert sequence of p20mer1 and p20mer1F allows accessibility to pre-RC proteins to bind to and activate these origins, unlike p20merC and pBluescript, where the chromatin structure is closed.
We next compared and contrasted ectopic (episomal) plasmid replication with endogenous (in situ) chromosomal replication in both normal and transformed cells.
Copy number of the 20mer1, 20mer2, lamin B2, and c-myc chromosomal loci in transformed and normal cells
To perform quantitative comparisons of replication origin activity between the transformed and normal cells, the copy number per haploid genome of all chromosomal regions examined in this study was assessed to determine whether any differences in nascent DNA abundance would be due to amplification of the chromosomal loci and not increased origin activity. For this, equal amounts of genomic DNA from both transformed and normal cells was amplified by real-time PCR using primer sets denoted in Suppl. Table 4, which target the 20mer1, 20mer2, lamin B2, and c-myc chromosomal loci. The copy number per haploid genome for each chromosomal locus was produced after normalization of the results by making NSF equal to 1 copy per haploid genome. The 20mer1 (Suppl. Fig. 4A), 20mer2 (Suppl. Fig. 4B), lamin B2 (Suppl. Fig. 4C), and c-myc (Suppl. Fig. 4D) chromosomal loci, encompassing their respective replication origins, were present at 1 copy per haploid genome in all cell lines.
Origin activities at the chromosomal loci of 20mer1, 20mer2, lamin B2, and c-myc in transformed and normal cells
Confirmation of the presence of a single copy per haploid genome of all chromosomal loci in all cell lines permitted measurement of the in situ origin activity by quantification of the nascent DNA abundance at the chromosomal loci of 20mer1 (Fig. 3A), 20mer2 (Fig. 3B), lamin B2 (Fig. 3C), and c-myc (Fig. 3D) in the transformed and normal cells. Nascent DNA abundance was measured at 2 reference points for each locus, an origin-containing region (peak activity) and a non-origin-containing region (negative control with background activity) located at least 4 kb away from any of the origin regions, as previously described.36,38,40 For the 20mer1 region, amplification of primer set M20mer1, comprising the origin sequence, ranged between 12.2- and 29.2-fold more than amplification of the control primer set 20merC1 located ~6 kb away; for the 20mer2 region, amplification of primer set M20mer2, comprising the origin sequence, ranged between 10.7- and 31.3-fold more than amplification of the control primer set 20merC2 located ~6 kb away; for the lamin B2 region, amplification of primer set LB2, comprising the origin sequence, ranged between 25.3- and 29.2-fold more than amplification of the control primer set LB2C1 located ~4 kb away; and for the c-myc region, amplification of primer set Myc11, comprising the origin sequence, ranged between 11.2- and 24.4-fold more than amplification of the control primer set Myc1 located ~6 kb away.
Figure 3.

Comparative analysis of the nascent DNA abundance at the 20mer1, 20mer2, lamin B2, and c-myc chromosomal loci in transformed and normal cells. Histogram plots of the quantification by real-time PCR of nascent DNA abundance (ng) at the 20mer1 (A), 20mer2 (B), lamin B2 (C), and c-myc (D) chromosomal loci in the 2 transformed {HeLa and WI38(SV40)} and 2 normal {NSF and WI38} cell lines. The location and sequence information of the primers used for the amplification of the origin-containing regions (gray bars) and the non-origin-containing control regions (white bars) are as described in Suppl. Fig. 3 and Suppl. Table 4. The error bars represent the average of at least 2 experiments performed in triplicate and 1 standard deviation.
The nascent strand abundance across the chromosomal loci of 20mer1, 20mer2, lamin B2, and c-myc was determined in the same preparation of short nascent DNA and normalized to that of an internal reference, the lamin B2 locus, to control for the possibility of a greater recovery of nascent DNA from the transformed cells compared with the normal cells. Specifically, amplification of nascent DNA with primer set LB2C1 (background activity compared with lamin B2 peak region, primer set LB2) gave baseline values that were used to normalize the results from all the nascent DNA preparations of all cell lines, permitting comparison of data between different preparations and different cell lines.
Histogram plots of the nascent DNA abundance measured at the chromosomal loci of 20mer1 (Fig. 3A), 20mer2 (Fig. 3B), lamin B2 (Fig. 3C), and c-myc (Fig. 3D) in all the cell lines examined revealed a greater than 10-fold increase of all origin-containing compared with non-origin-containing regions (which exhibited background levels, with less than 10% origin activity), indicating that all the nascent DNA preparations were of good quality, and confirmed that the origin regions of each locus examined in all cell lines are located at true sites of initiation of DNA replication.45
The results also show a 2- to 3-fold higher origin activity associated with the chromosomal loci of 20mer1 (Fig. 3A), 20mer2 (Fig. 3B), and c-myc (Fig. 3D) in the transformed versus the normal cells, suggesting a transformation-related enhancement in the activity of these origins. Use of the isogenic pair of WI38 and WI38(SV40) cells ruled out the possibility that the observed increased frequency of initiation in the transformed cells might be due to cell type, as previously reported.35,36,38,40 In contrast, the origin activity associated with the chromosomal locus of lamin B2 was similar in both the transformed and normal cells (Fig. 3C), suggesting that this origin, which lies within the constitutively active housekeeping locus that codes for lamin B2, may adopt an open chromatin configuration, allowing for similar origin activity in all cell lines examined regardless of cell type or transformation status, as previously observed.46,47
Abundance of pre-RC proteins at the chromosomal loci of the 20mer1, 20mer2, lamin B2, and c-myc replication origins in transformed and normal cells
The in vivo abundance of the pre-RC proteins ORC2, Cdc6, and Cdt1 on the chromosomal loci of the 20mer1, 20mer2, lamin B2, and c-myc replication origins was measured in transformed and normal cells by quantification of chromatin immunoprecipitated DNA corresponding to the origin regions (M20mer1, M20mer2, LB2, and Myc11) compared with their respective non-origin-containing (control) regions (20merC1, 20merC2, LB2C1, and Myc1) (Fig. 4A-D).
Figure 4.

In vivo association of ORC2, Cdc6, and Cdt1 at the 20mer1, 20mer2, lamin B2, and c-myc chromosomal loci in transformed and normal cells. Histogram plots of the quantification by real-time PCR of immunoprecipitated DNA abundance (ng) at the 20mer1 (A), 20mer2 (B), lamin B2 (C), and c-myc (D) chromosomal loci in the 2 transformed {HeLa and WI38(SV40)} and 2 normal {NSF and WI38} cell lines. ChIP was performed with antibodies directed against ORC2 (dark gray bars), Cdc6 (white bars), and Cdt1 (light gray); normal rabbit serum (NRS) (black bars) was used as a negative control. The primer sets of 20mer1 (A), 20mer2 (B), lamin B2 (C), and c-myc (D) are denoted in Suppl. Table 4. The error bars represent the average of at least 2 experiments performed in triplicate and 1 standard deviation. (E) Western blot analysis using anti-ORC2, anti-Cdc6, and anti-Cdt1 antibodies to verify the immunoprecipitation of ORC2, Cdc6, and Cdt1 proteins in all cell lines used. Immunoprecipitation with NRS was used as a negative control.
Histogram plots of the immunoprecipitated DNA abundance of ORC2, Cdc6, and Cdt1, measured at the chromosomal loci of 20mer1 (Fig. 4A), 20mer2 (Fig. 4B), lamin B2 (Fig. 4C), and c-myc (Fig. 4D) in all the cell lines used, showed an increased in vivo abundance of these proteins with the origin compared with non-origin sequences. The enrichment of ORC2, Cdc6, and Cdt1 at the 20mer1 origin was 10.2- to 16.3-fold greater than the non- origin-containing sequence for the transformed cells and 4.3- to 7.2-fold greater than the non-origin-containing sequence for the normal cells (Fig. 4A). Their enrichment at the 20mer2 origin was 10.1- to 16.9-fold greater than the non-origin-containing sequence for the transformed cells and 4.1- to 6.0-fold greater than the non-origin-containing sequence for the normal cells (Fig. 4B). In contrast, their association with the lamin B2 origin was 11.8- to 20.7-fold greater than the non-origin-containing sequence for both the transformed and normal cells (Fig. 4C). Finally, their enrichment at the c-myc origin was 14.0- to 20.5-fold greater than the non-origin-containing sequence for the transformed cells and 6.0- to 9.9-fold greater than the non-origin-containing sequence for the normal cells (Fig. 4D).
These results are in agreement with the chromosomal origin activity profiles observed (Fig. 3A-D), with the pre-RC association paralleling the abundance of the nascent strands generated from each chromosomal origin (Fig. 4A-D). Interestingly, the ectopic origin activity profiles (Fig. 1A, B, and Fig. 2A, B) were also in agreement with the ectopic pre-RC association profiles (Fig. 2C, D), but the one glaring difference we noticed when comparing the ectopic data to the endogenous data was that ectopic origins exhibited no differences between transformed and normal cells. These results may be due to epigenetic differences between transformed and normal cells existing or being apparent only at the endogenous chromosomal level and not the ectopic plasmid level as previously seen in Fig. 2E, F. To test this hypothesis, an in-depth analysis of the chromatin structure as well as proteins that affect it was conducted in both transformed and normal cells.
Expression and chromatin-bound levels of histones, polycomb, and trithorax proteins in transformed and normal cells
To assess the levels of the histone H3 subunit, histone-acid extracts were prepared from asynchronously growing transformed and normal cells, subjected to SDS-PAGE and immunoblotted for histone H3 total, histone H3 Ac K9&14, and histone H3 tri-Me K9. There were equal levels of histone H3 total among the normal and transformed cells, whereas the levels of histone H3 Ac K9&14 were greater in the transformed cells and the levels of histone H3 tri-Me K9 were greater in the normal cells (Fig. 5A). The histogram plot represents the ratio of the abundance of histone H3 Ac K9&14 over that of histone H3 tri-Me K9 (Fig. 5B), which exhibited higher ratios in the transformed (HeLa = 1.19, WI38(SV40) = 1.53) compared with the normal (NSF = 0.85, WI38 = 0.71) cells.
Figure 5.
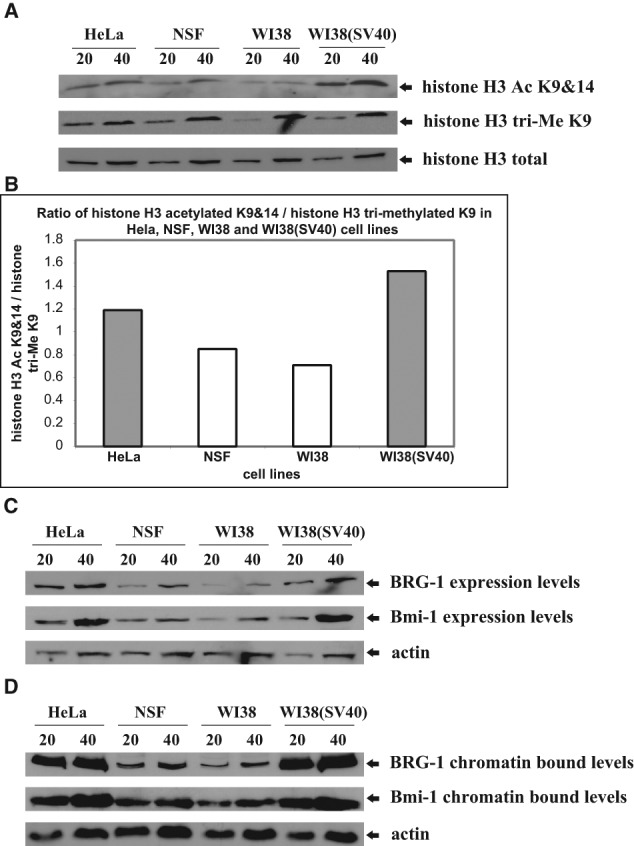
Comparative analysis of the expression and chromatin-bound levels of histone H3 Ac K9&14, histone H3 tri-Me K9, Brg-1, and Bmi-1 in transformed and normal cells. (A) Total histone acid extracted levels of histone H3 Ac K9&14 and histone H3 tri-Me K9 in the 2 transformed {HeLa and WI38(SV40)} and 2 normal {NSF and WI38} cell lines. We subjected 20 and 40 µg of histone acid extracts to SDS-PAGE, transferred them onto PVDF membrane, and probed them with anti-histone H3 Ac K9&14 and anti-histone H3 tri-Me K9 antibodies. Anti-histone H3 total was used as a loading control. (B) Histogram plot representing the ratio of histone H3 Ac K9&14 to histone H3 tri-Me K9 in the 2 transformed {HeLa and WI38(SV40)} and 2 normal {NSF and WI38} cell lines. (C) Expression levels of Brg-1 and Bmi-1 in the 2 transformed {HeLa and WI38(SV40)} and 2 normal {NSF and WI38} cell lines. We subjected 20 and 40 µg of whole cell extracts to SDS-PAGE, transferred them onto PVDF membrane, and probed them with anti-Brg-1 and anti-Bmi-1 antibodies. Anti-actin was used as a loading control. (D) Chromatin bound levels of Brg-1 and Bmi-1 in the 2 transformed {HeLa and WI38(SV40)} and 2 normal {NSF and WI38} cell lines. We subjected 20 and 40 µg of chromatin-bound extracts to SDS-PAGE, transferred them onto PVDF membrane, and probed them with anti-Brg-1 and anti-Bmi-1 antibodies. Anti-actin was used as a loading control.
To gain a better understanding of how transformed and normal cells undergo changes in chromatin structure, we also examined in both cell types the expression and chromatin-bound levels of the trithorax protein Brg-1 and polycomb protein Bmi-1, which are involved in chromatin modification. To assess the expression levels of the 2 proteins, WCEs were prepared from asynchronously growing transformed and normal cells, subjected to SDS-PAGE, and immunoblotted for Brg-1 and Bmi-1. Both proteins were overexpressed in the transformed cells (Fig. 5C). To examine whether their overexpression in the transformed cells affected their association with chromatin, chromatin-bound extracts were prepared from asynchronously growing transformed and normal cells, subjected to SDS-PAGE, and immunoblotted for Brg-1 and Bmi-1. Again, these proteins exhibited elevated chromatin association in the transformed cells, mirroring their expression profile (Fig. 5D).
Importantly, the changes in expression and chromatin bound levels observed in the HeLa and NSF cells were not due to cell type, as the same results were obtained using the isogenic pair of WI38 and WI38(SV40) cells. Overall, these results indicate that elevated histone H3 acetylation compared with methylation as well as overexpression and increased chromatin association of Brg-1 and Bmi-1 proteins is a feature of cellular transformation.
Abundance of histone H3 total, histone H3 Ac K9&14, and histone H3 tri-Me K9 at the chromosomal loci of the 20mer1, 20mer2, lamin B2, and c-myc replication origins in transformed and normal cells
The in vivo association of histone H3 total, histone H3 Ac K9&14, and histone H3 tri-Me K9 with the chromosomal loci of the 20mer1, 20mer2, lamin B2, and c-myc replication origins was measured in transformed and normal cells by quantification of chromatin immunoprecipitated DNA corresponding to the origin regions (M20mer1, M20mer2, LB2, and Myc11) compared with their respective non-origin-containing (control) regions (20merC1, 20merC2, LB2C1, and Myc1) (Suppl. Fig. 5A-D and Fig. 6A-D).
Figure 6.

In vivo association of histone H3 Ac K9&14 and histone H3 tri-Me K9 at the 20mer1, 20mer2, lamin B2, and c-myc chromosomal loci in transformed and normal cells. Histogram plots of the quantification by real-time PCR of immunoprecipitated DNA abundance (ng) at the 20mer1 (A), 20mer2 (B), lamin B2 (C), and c-myc (D) chromosomal loci in the 2 transformed {HeLa and WI38(SV40)} and 2 normal {NSF and WI38} cell lines. ChIP was performed with antibodies directed against histone H3 Ac K9&14 (dark gray bars) and histone H3 tri-Me K9 (white bars); normal rabbit serum (NRS) (black bars) was used as a negative control. The primer sets of 20mer1 (A), 20mer2 (B), lamin B2 (C), and c-myc (D) are denoted in Suppl. Table 4. The error bars represent the average of at least 2 experiments performed in triplicate and 1 standard deviation. (E) Western blot analysis using anti-histone H3 Ac K9&14 and anti-histone H3 tri-Me K9 antibodies to verify the immunoprecipitation of histone H3 Ac K9&14 and histone H3 tri-Me K9 proteins in all cell lines used. Immunoprecipitation with NRS was used as a negative control.
To normalize for the amount of histone H3 modifications present at the chromosomal loci of 20mer1, 20mer2, lamin B2, and c-myc, the total histone H3 bound to these regions was analyzed in both normal and transformed cells. The data show that for all regions examined (origin and non-origin), there was no enrichment at any of the origin compared with non-origin-containing regions in both transformed and normal cells (Suppl. Fig. 5A-D), which confirmed an equal in vivo association of histone H3 at all chromosomal loci in both cell types, permitting measurement of the endogenous chromosomal in vivo association of specific modifications of histone H3.
Histogram plots of the immunoprecipitated DNA abundance of histone H3 Ac K9&14 and histone H3 tri-Me K9, measured at the chromosomal loci of 20mer1 (Fig. 6A), 20mer2 (Fig. 6B), lamin B2 (Fig. 6C), and c-myc (Fig. 6D) in all the cell lines used, showed an increased in vivo association of histone H3 Ac K9&14 with the origin compared with non-origin sequences but similar in vivo association of histone H3 tri-Me K9 with the origin compared with non-origin sequences.
The enrichment of histone H3 Ac K9&14 at the 20mer1, 20mer2, lamin B2, and c-myc origins was 5.3- to 9.0-fold greater than the non-origin-containing sequences for both the transformed and normal cells (Fig. 6A-D). In contrast, there was no enrichment of histone H3 tri-Me K9 at the 20mer1, 20mer2, lamin B2, and c-myc origins compared with the non-origin-containing sequences for both cell types (Fig. 6A-D).
For the 20mer 1 origin, the ratio of histone H3 Ac K9&14 to histone H3 tri-Me K9 was 3.2 for the transformed cells and 1.2 for the normal cells. For the 20mer 2 origin, the ratio of histone H3 Ac K9&14 to histone H3 tri-Me K9 was 2.8 for the transformed cells and 1.1 for the normal cells. For the lamin B2 origin, the ratio of histone H3 Ac K9&14 to histone H3 tri-Me K9 was 5.7 for both cell types. For the c-myc origin, the ratio of histone H3 Ac K9&14 to histone H3 tri-Me K9 was 5.7 for the transformed cells and 1.9 for the normal cells.
Overall, these results demonstrate that transformed cells exhibit an elevated ratio of histone H3 Ac K9&14 to histone H3 tri-Me K9 in contrast to normal cells, indicating a more open chromatin conformation in the former, and normal cells exhibit an elevated ratio of histone H3 tri-Me K9 to histone H3 Ac K9&14 in contrast to transformed cells at the 20mer1, 20mer2, and c-myc origins, indicating a more closed chromatin conformation in them. Also, both cell types exhibit an equally elevated ratio of histone H3 Ac K9&14 to histone H3 tri-Me K9 at the lamin B2 origin.
Abundance of Brg-1 and Bmi-1 proteins at the chromosomal loci of the 20mer1, 20mer2, lamin B2, and c-myc replication origins in transformed and normal cells
Polycomb and trithorax group proteins function in distinct multiprotein complexes that control transcription by altering the structure of chromatin, organizing it into either a “closed” or an “open” conformation. Here, we examined their possible role in chromatin organization during DNA replication by comparatively analyzing the in vivo association of Brg-1 (a trithorax group protein) and Bmi-1 (a polycomb group protein) with the chromosomal loci of the 20mer1, 20mer2, lamin B2, and c-myc replication origins in transformed and normal cells. This was measured by quantification of chromatin immunoprecipitated DNA corresponding to the 4 origin regions (M20mer1, M20mer2, LB2, and Myc11) compared with their respective non-origin-containing (control) regions (20merC1, 20merC2, LB2C1, and Myc1) (Fig. 7A-D).
Figure 7.

In vivo association of Brg-1 and Bmi-1 at the 20mer1, 20mer2, lamin B2, and c-myc chromosomal loci in transformed and normal cells. Histogram plots of the quantification by real-time PCR of immunoprecipitated DNA abundance (ng) at the 20mer1 (A), 20mer2 (B), lamin B2 (C), and c-myc (D) chromosomal loci in the 2 transformed {HeLa and WI38(SV40)} and 2 normal {NSF and WI38} cell lines. ChIP was performed with antibodies directed against Brg-1 (dark gray bars) and Bmi-1 (white bars); normal rabbit serum (NRS) (black bars) was used as a negative control. The primer sets of 20mer1 (A), 20mer2 (B), lamin B2 (C), and c-myc (D) are denoted in Suppl. Table 4. The error bars represent the average of at least 2 experiments performed in triplicate and 1 standard deviation. (E) Western blot analysis using anti-Brg-1 and anti-Bmi-1 antibodies to verify the immunoprecipitation of Brg-1 and Bmi-1 proteins in all cell lines used. Immunoprecipitation with NRS was used as a negative control.
Histogram plots of the immunoprecipitated DNA abundance of Brg-1 and Bmi-1, measured at the chromosomal loci of 20mer1 (Fig. 7A), 20mer2 (Fig. 7B), lamin B2 (Fig. 7C), and c-myc (Fig. 7D) in all the cell lines used, show a small increase in the abundance of Brg-1 on the origin compared with non-origin sequences but a similar abundance of Bmi-1 on these sequences.
The enrichment of Brg-1 at the 20mer1, 20mer2, lamin B2, and c-myc origins was ~1.5-fold greater than the non-origin-containing sequences for both the transformed and normal cells (Fig. 7A-D). In contrast, there was no enrichment of Bmi-1 at the 20mer1, 20mer2, lamin B2, and c-myc origins compared with the non-origin-containing sequences for both cell types (Fig. 7A-D).
For the 20mer 1 origin, the ratio of Brg-1 to Bmi-1 was 4.0 for the transformed cells and 1.3 for the normal cells. For the 20mer 2 origin, the ratio of Brg-1 to Bmi-1 was 3.1 for the transformed cells and 1.1 for the normal cells. For the lamin B2 origin, the ratio of Brg-1 to Bmi-1 was 7.4 for both cell types. For the c-myc origin, the ratio of Brg-1 to Bmi-1 was 7.1 for the transformed cells and 2.3 for the normal cells.
Overall, these results show that transformed cells exhibit an elevated ratio of Brg-1 to Bmi-1 in contrast to normal cells and normal cells exhibit an elevated ratio of Bmi-1 to Brg-1 in contrast to transformed cells at the 20mer1, 20mer2, and c-myc origins. Also, both cell types exhibit an equal elevated ratio of Brg-1 to Bmi-1 at the lamin B2 origin.
Importantly, for all ChIP experiments conducted in this study, equal amounts of cross-linked chromatin extracts were immunoprecipitated with antibodies against the above-mentioned proteins and an equivalent amount of normal rabbit serum (NRS) as a negative control to give baseline values that were used to normalize results from all ChIP preparations of all cell lines, permitting comparison of data between different preparations and different cell lines. Furthermore, the low abundance of DNA detected in the NRS immunoprecipitates indicated that the conditions were stringent enough to prevent substantial nonspecific association of DNA with the immunoglobulins or agarose beads. Also, the immunoprecipitated lysates verified that all antibodies immunoprecipitated their respective proteins in all cell lines, whereas no proteins were immunoprecipitated by the NRS, indicating the specificity of the IP reactions (Suppl. Fig. 5E and Figs. 4, 6, 7E), further confirming the specificity of the ChIPs. Moreover, the cell cycle distribution of asynchronously growing cells from all cell lines was found to be the same by FACS analysis (Suppl. Fig. 6A-D), permitting the comparisons between the transformed and normal cells.
Nucleosome positioning analysis at the chromosomal loci of the 20mer1, 20mer2, lamin B2, and c-myc replication origins in transformed and normal cells
To examine whether the 20mer1, 20mer2, lamin B2, and c-myc replication origins were assembled into nucleosomes or located within the linker region, an MNase-Southern blot assay (Suppl. Fig. 7) was used. Briefly, HeLa, NSF, WI38, and WI38(SV40) nuclei were treated with micrococcal nuclease (MNase), which cleaves DNA between nucleosomes.48 The partial digestion products were resolved by agarose gel electrophoresis, and the results revealed the expected nucleosomal repeat in bulk DNA from the MNase-treated nuclei (Suppl. Fig. 8A) by comparison to untreated nuclei, in which the DNA was undigested (Suppl. Fig. 8A, lane 2); the DNA of nuclei treated with increasing concentrations of MNase was partially digested, giving rise to a more intense nucleosomal ladder (Suppl. Fig. 8A, lanes 3-10). As a control for the proper functioning of the MNase, protein-free DNA was also examined, and the partial digestion products revealed the expected diminishing presence of bulk DNA from the MNase-treated protein-free DNA (Suppl. Fig. 8B), since nontreated protein-free DNA was undigested (Suppl. Fig. 8B, lane 2) but protein-free DNA treated with increasing concentrations of MNase became completely digested (Suppl. Fig. 8B, lanes 3-7). Comparative electrophoretic analysis of MNase-treated nuclei from asynchronously growing transformed and normal cells revealed a similar nucleosomal ladder among all cells used in the study (Fig. 8A, lanes 1-4). Since DNA replication requires the binding of the pre-RC proteins onto origins during G1 phase prior to S phase,49 it most likely accompanies changes in nucleosome positioning around this pre-RC loading time-point; to test this hypothesis, cells were synchronized to G1/S phase (Suppl. Fig. 6E-H) by a double thymidine-mimosine block prior to preparation of MNase-treated nuclei. The treated nuclei from G1/S phase transformed, and normal cells also revealed a similar nucleosomal ladder in all cells used in the study (Fig. 8B, lane 1-4). Both asynchronous and G1/S phase nuclei yielded similar ladders of bands corresponding in size to multiples of the nucleosome core plus linker DNA (~200bp), represented by increasing integers of n (Fig. 8A, B). To examine whether the 20mer1, 20mer2, lamin B2, and c-myc replication origins are nucleosomal, Southern blot hybridization of the MNase-digested genomic DNA from HeLa, NSF, WI38, and WI38(SV40) cells was performed, using probes representing the 4 replication origins. If the probes hybridize to the ladder of nucleosomal bands, then the origins are assembled into nucleosomes. To determine the nucleosome positioning, the genomic DNA was cleaved with a restriction enzyme prior to Southern blot analysis. Probes alone of each origin sequence (20mer1, 20mer2, lamin B2, and c-myc) examined can be seen as a low molecular weight band ((Fig. 8C-F, lane 1). Undigested protein-free DNA results in a single high molecular weight band (Fig. 8C-F, lane 2), whereas protein-free DNA digested with MNase results in a low molecular weight smear (Fig. 8C-F, lane 3). All origin sequences in both transformed and normal cells showed a typical nucleosomal ladder array upon MNase treatment and Southern blot analysis with the origin probes ((Fig. 8C-F, lanes 4, 6, 8, 10), indicating that the origins are assembled into nucleosomes. Cleavage of the genomic DNA prior to Southern blot analysis with different restriction enzymes on either side of the origin sequence yielded the same nucleosomal ladder array ((Fig. 8C-F, lanes 5, 7, 9, 11) for all origins tested in both transformed and normal cells, suggesting that the origins are within nucleosomes that are inconsistently positioned. To enrich for chromatin structure that ensues just prior to the onset of S-phase, MNase treated nuclei were prepared from cells synchronized at G1/S phase. Again, for all origins examined in both transformed and normal cells, a typical nucleosomal ladder array was observed ((Fig. 8C-F, lanes 12, 14, 16, 18), once more indicating that the origins are assembled into nucleosomes, which are inconsistently positioned, as restriction enzyme cleavage yielded the same nucleosomal ladder ((Fig. 8C-F, lanes 13, 15, 17, 19) for every origin in both cell types. Interestingly, the linker regions between nucleosomes in the G1/S phase cells were at least twice as large compared with the logarithmically growing cells, indicating that just prior to the onset of S phase, nucleosomes are spaced further apart at the origins, rendering them accessible and allowing adequate space for the assembly of the pre-RC that is necessary for origin activation.
Figure 8.

Analysis of nucleosome positioning at the 20mer1, 20mer2, lamin B2, and c-myc chromosomal loci in transformed and normal cells by the MNase-Southern blot method. (A, B) Comparative analysis between transformed and normal cells of the MNase digestion banding pattern of (A) LOG and (B) G1/S phase nuclei by agarose gel electrophoresis and visualization by ethidium bromide; Lane 1: GeneRuler DNA Ladder Mix, Lane 2: MNase-treated HeLa nuclei, Lane 3: MNase-treated NSF nuclei, Lane 4: MNase-treated WI38 nuclei, Lane 5: MNase-treated WI38(SV40) nuclei. Nucleosome repeats are denoted on the right of each gel as an integer of n. (C-F) Comparative analysis between transformed and normal cells of the MNase digestion banding pattern of LOG and G1/S phase nuclei by Southern blot analysis using (C) M20mer1, (D) M20mer2, (E) LB2, and (F) Myc11 origin regions as probes; Lane 1: Probe, Lane 2: HeLa free DNA, Lane 3: HeLa free DNA treated with MNase, Lane 4: MNase-treated HeLa (LOG) nuclei, Lane 5: MNase-treated HeLa (LOG) nuclei + RE, Lane 6: MNase-treated NSF (LOG) nuclei, Lane 7: MNase-treated NSF (LOG) nuclei + RE, Lane 8: MNase-treated WI38 (LOG) nuclei, Lane 9: MNase-treated WI38 (LOG) nuclei + RE, Lane 10: MNase-treated WI38(SV40) (LOG) nuclei, Lane 11: MNase-treated WI38(SV40) (LOG) nuclei + RE, Lane 12: MNase-treated HeLa (G1/S) nuclei, Lane 13: MNase-treated HeLa (G1/S) nuclei + RE, Lane 14: MNase-treated NSF (G1/S) nuclei, Lane 15: MNase-treated NSF (G1/S) nuclei + RE, Lane 16: MNase-treated WI38 (G1/S) nuclei, Lane 17: MNase-treated WI38 (G1/S) nuclei + RE, Lane 18: MNase-treated WI38(SV40) (G1/S) nuclei, Lane 19: MNase-treated WI38(SV40) (G1/S) nuclei + RE.
Discussion
Episomal replication origins are bound by pre-RC proteins and have a higher ratio of acetylated histone H3 to methylated histone H3 in both normal and transformed cells
We previously identified a putative 36bp mammalian origin consensus sequence that was capable of supporting the autonomous replication of a plasmid after transfection into eukaryotic cells, whereas initiation of DNA replication in vitro occurred within the consensus. Mutation analysis of the 36bp consensus indicated that an internal 20bp sequence was sufficient to act as a core origin element, whereas the distribution of this 20bp consensus sequence over 1Mb of human chromosomal DNA was similar to the distribution of the ACS on S. cerevisiae chromosomes.12
In this study, we tested a version of the 20bp consensus sequence (at a level of 90% homology) on human chromosome 19q13 as well as a version of the 20bp consensus sequence included in the OBR of the lamin B2 locus (at a level of 75% homology) for ectopic replication activity, in situ replication activity, association with pre-RC proteins (ORC2, Cdc6, Cdt1), and abundance of histone proteins (histone H3 total, histone H3 Ac K9&14, and histone H3 tri-Me K9) in normal and transformed cells by transient episomal replication assays (Fig. 1A, B), nascent strand abundance analysis (Fig. 2A, B), and ChIP assays (Fig. 2C-F), respectively. These versions of the 20bp consensus sequence efficiently supported autonomous replication of their respective plasmids after transfection into both cell types, either alone (p20mer1 and pLB2) or when they were inserted within endogenous sequence (p20mer1F and p20mer(LB2)1F). In contrast, random 20bp genomic sequences cloned (p20merC, pLB2C1) or inserted into endogenous sequence via mutational sequencing (p20mer(LB2C1)1F) were unable to support autonomous replication.
Overall, the results obtained from the ectopic replication assays (Fig. 1 and Fig. 2) provide mechanistic insight for the steps that take place in order for replication to occur. Fig. 1A, B, reveals that the 20bp consensus sequence is necessary for a plasmid to replicate autonomously, as random 20bp does not confer plasmid replication ability. The start site of DNA replication is located at the 20bp consensus sequence within p20mer1 and p20mer1F, but no initiation takes place in p20merC or pBluescript, as nascent DNA abundance was detected at the insert sequences of p20mer1 and p20mer1F but not in p20merC or pBluescript (Fig. 2A, B). The pre-RC association is in concordance with the abundance of the nascent strands generated from the constructs, as p20mer1 and p20mer1F, but not p20merC or pBluescript, are bound by ORC2, Cdc6, and Cdt1 (Fig. 2C, D). Moreover, p20mer1 and p20mer1F, but not p20merC or pBluescript, had higher levels of open (histone H3 Ac K9&14) compared with closed (histone H3 tri-Me K9) chromatin at the insert sequence (Fig. 2E, F), explaining why there was only sufficient space for the pre-RCs to nucleate at the insert sequences of the p20mer1 and p20mer1F constructs and not at the insert sequences of the p20merC or pBluescript constructs, which allow for initiation of nascent strands to commence and hence autonomous replication of the p20mer1 and p20mer1F constructs, similar to what has been observed in other extrachromosomal plasmids.50-52 It should be noted that all aforementioned results were comparable in both normal and transformed cells (Fig. 1 and Fig. 2). Thus, in both normal and transformed cells, only certain cis-acting sequences, containing a version of the 20bp consensus sequence, were bound by the required trans-acting factors for episomal replication to occur, due to the presence of a more favorable chromatin environment (necessary for replication and other cellular processes to occur), which has been recently observed in other episomes.53-55
The chromatin context encompassing chromosomal replication origins regulates the association of pre-RC proteins with them, which in turn correlates with their activity in both transformed and normal cells
The 20mer1, 20mer2, c-myc, and lamin B2 chromosomal loci each contain replication origins in both transformed and normal cells, as indicated by the abundance of nascent DNA at those regions, but the 20mer1, 20mer2, and c-myc origins displayed 2- to 3-fold more activity in the transformed cells (Fig. 3A, B, D), unlike the lamin B2 origin, whose activity was similar in both cell types (Fig. 3C). In agreement with the origin activation data, all the above mentioned origins exhibited in vivo association with the pre-RC proteins (ORC2, Cdc6, and Cdt1) unlike their respective non-origin-containing control regions, but displayed a 2- to 3-fold higher abundance of ORC2, Cdc6, and Cdt1 at the 20mer1, 20mer2, and c-myc origins in the transformed cells (Fig. 4A, B, D), unlike the lamin B2 origin, which displayed an equal abundance of the pre-RC proteins in both cell types (Fig. 4C).
These results indicate that the deregulated increase in replication initiation at some origins may be an early event in the stepwise progression to cancer occurring at the transformation stage, causing replication stress, which may lead to DNA double-strand breaks and activation of the DNA damage checkpoint, increased genomic instability, and tumor progression.56-58 Alternatively, the differential origin activities observed between the transformed and normal cells for the 20mer1, 20mer2, and c-myc origins might be due to some origins being fired more than once, but the repeated initiations are subsequently aborted to prevent gene amplification. It has been speculated that the early events of genomic instability in a cancer cell might entail unregulated origin firing, providing substrates for genetic recombination and further amplification.59 Also, the differential origin activities observed here might be due to the 20mer1, 20mer2, and c-myc origins being activated at a lower frequency per cell cycle in normal cells but at a higher frequency in transformed cells. It is conceivable that in normal cells, at least during some S phases, the DNA at the 20mer1, 20mer2, and c-myc origins might be replicated by upstream or downstream origins flanking these regions, resulting in origin interference.60 Alternatively, the lamin B2 origin might be activated at similar frequencies in transformed and normal cells due to its constitutively expressed gene domain resulting in transcription at the lamin B2 locus being continually active in both cell types,46,47,61 likely maintaining at all times an open chromatin configuration that encompasses the lamin B2 origin, hence allowing equal accessibility for pre-RC protein binding in both cell types.
Numerous studies have described the deregulation of pre-RC proteins during oncogenesis (reviewed in Lau et al. 62) and have led to the suggestion that there is a pre-RC checkpoint lacking in cancer cells63 whereby activation of an ataxia telangiectasia and Rad3-related (ATR)–dependent S phase checkpoint that inhibits replication fork progression is compromised, such that higher levels of DNA replication stress/damage are required to trigger checkpoint response.64
The elevated in vivo association of pre-RC proteins with the 20mer1, 20mer2, and c-myc origins in the transformed cells may be the result of deregulation of the pre-RC checkpoint, causing certain origins to fire more than once per cell cycle, due to their improper licensing, leading to re-replication and thereby causing genetic instability and cancer.65,66 In contrast, the equal in vivo association of pre-RC proteins with the lamin B2 origin in both transformed and normal cells indicates that this origin may remain unaffected by the aberrant deregulation of the pre-RC checkpoint. As previously reported, only a subset of origins were sensitive to an origin licensing perturbation, as re-replication was unevenly distributed across chromosomes in tumor cell lines67; the lamin B2 origin may reside in an unaffected area of the genome. Moreover, both exponentially growing cells and nonproliferating cells showed that the region encompassing the lamin B2 origin has a highly accessible chromatin structure.68 Considering that DNA replication occurs in a chromatin context,69 we focused on analyzing the modifications that take place on histone tails and chromatin modifying enzymes encompassing the aforementioned origins of DNA replication.
Analysis of the histone modifications encompassing the 20mer1, 20mer2, lamin B2, and c-myc origins revealed that the in vivo association of histone H3 Ac K9&14 was more abundant at the origin compared with non-origin-containing regions and that the in vivo association of histone H3 tri-Me K9 was similar at both the origin compared with non-origin-containing regions, in agreement with other studies examining the role of histone acetylation (open) and methylation (closed) marks on chromatin structure at replication origins.70-72 Furthermore, an increased abundance of histone H3 Ac K9&14 in conjunction with a decreased abundance of histone H3 tri-Me K9 at the 20mer1, 20mer2, and c-myc origins was observed in the transformed cells by comparison to the normal ones (Fig. 6A, B, D). However, the lamin B2 origin showed a similar enrichment of histone H3 Ac K9&14 over histone H3 tri-Me K9 in both cell types (Fig. 6C), indicating that cellular transformation does not equally affect the modification of histones with all replication origins. The data also revealed that globally there was a higher ratio of histone H3 Ac K9&14 to histone H3 tri-Me K9 in transformed compared with normal cells (Fig. 5A, B), which may explain why the 20mer1, 20mer2, and c-myc origins were in an environment of more open chromatin structure. Alternatively, the activation of the lamin B2 origin at similar frequencies in transformed and normal cells may be due to its constitutively expressed gene domain46 that might be linked to its nucleotide sequence, as a recent study has suggested that open chromatin structure encoded in DNA sequence is the signature of “master” replication origins in human cells.73 Also, early-firing origins such as the lamin B2 origin display histone modifications that are associated with open chromatin structure,71 in agreement with previous studies in S. cerevisiae showing that histone hyperacetylation correlates with early activation of replication origins,21 probably by allowing equal accessibility for pre-RC protein binding in both cell types. The results indicate that the in vivo association of pre-RC proteins with origins is dependent on the chromatin structure encompassing the origins in transformed and normal cells. Moreover, the varying degrees of open to closed chromatin structure correlate with the activity of the origin. Interestingly, many different patterns of histone H3 Ac K9 and histone H3 tri-Me K9 have been implicated in several types of cancer and are among several histone onco-modifications (reviewed in Fullgrabe et al. 74).
The establishment of the observed differential chromatin environment may be due to the origin-specific recruitment of chromatin modifying enzymes. Analysis of the trithorax group protein Brg-1 and polycomb group protein Bmi-1 encompassing the 20mer1, 20mer2, lamin B2, and c-myc origins revealed that the in vivo association of Brg-1 was slightly more abundant at the origin compared with non-origin-containing regions and that the in vivo association of Bmi-1 was similar at both the origin compared with non-origin-containing regions. Furthermore, an increased abundance of Brg-1 in conjunction with a decreased abundance of Bmi-1 at the 20mer1, 20mer2, and c-myc origins was observed in the transformed cells by comparison to the normal ones (Fig. 7A, B, D), unlike the lamin B2 origin, which showed a similar enrichment of Brg-1 over Bmi-1 in both cell types (Fig. 7C), indicating that cellular transformation does not equally affect the association of chromatin modifying complexes with all replication origins. The data also revealed that globally, both Brg-1 and Bmi-1 are overexpressed and bound to chromatin at higher levels in transformed compared with normal cells (Fig. 5C, D), which is in agreement with previous studies showing that elevated levels of Brg-1 correlated with aggressive prostate cancer75 and are involved in melanoma initiation.76 The role of Brg-1 as a tumor suppressor has been implicated in human cancer through several modes of action (reviewed in Medina et al. 77). Furthermore, Bmi-1 is overexpressed in a number of human malignancies,78 and Bmi-1 expression promotes the stem cell state in tumor cells and overexpression of Bmi-1 correlates with therapy failure in many tumor types, including those in breast, prostate, lung, and ovarian cancer.79-82 Bmi-1’s role as an oncogene has also been implicated in human cancer through several modes of action (reviewed in Jiang et al. 78).
Interestingly both Brg-1 and Bmi-1 have been previously found to interact with replication factors, as Bmi-1 was found to interact with Cdc6 at the replication origin in the INK4/ARF locus83 whereas Brg-1 interacts with TOPB1 (component of the replication fork and sensor of replication stress) and co-localizes with ORC1, PCNA, and GINS and has been implicated in origin firing and the process of replication elongation.84 Geminin, an inhibitor of the DNA replication licensing factor Cdt1, was found to interact with Brg-1 and antagonize its activity.85 The Rae28 subunit of the PcG complex-1 (which contains Bmi-1) interacts with Geminin by inducing polyubiquitination of Geminin by acting as the E3 ubiquitin ligase, and the polyubiquitin chain may serve as a recognition signal for the proteasome to regulate stability of Geminin.86 It seems that the interaction with Geminin is a common denominator between Brg-1 and Bmi-1, which would explain why these proteins are overexpressed and are bound to chromatin at higher levels in transformed cells, as the elevated Bmi-1-containing complex would decrease the expression of Geminin and the elevated Brg-1 would not be kept in check, allowing for a more open chromatin structure, thus allowing more space for pre-RC binding and hence origin activity. Interestingly, in embryonic stem cells, when the expression of Brg-1 was reduced by targeting with RNAi, the expression of Bmi-1 was elevated, suggesting that Brg-1 containing complexes repress Bmi-1 containing complexes.87 Thus, it is conceivable that in the transformed cells used in this study, where the amount of Brg-1 is overriding Bmi-1, the natural balance is being perturbed sufficiently, resulting in an overall more open chromatin structure in the transformed cells, thus allowing a higher origin activity at the 20mer1, 20mer2, and c-myc origins; in the case of the lamin B2 origin, the binding pattern of these polycomb and trithorax proteins is likely attributable to the histone modification pattern of hyperacetylation, resulting in constitutively open chromatin71 and enabling access of trithorax but not polycomb proteins, as it has been shown that various hypermethylated signals can compete for polycomb binding with different effects at different loci.88
Importantly, use of the isogenic pair of WI38 and WI38(SV40) in every experiment ruled out the possibility that cell type effects were responsible for any observed differences in origin activity, association of pre-RC proteins, modified histones, or chromatin remodeling complexes at the origins.
Nucleosomes within replication origins are inconsistently positioned and remodeled prior to S phase in the same manner in both transformed and normal cells
Using an MNase-Southern blot assay in conjunction with RE cleavage ((Fig. 8C-F), we determined in both normal and transformed cells that not only were all the aforementioned origins found to be within nucleosomal regions, displaying nucleosomal ladders, but they were also inconsistently positioned, displaying the same nucleosomal ladders, without a shift that would have indicated an exact position of the nucleosome. Interestingly, cell synchronization to G1/S phase showed that nucleosomes are spaced farther away from each other prior to S-phase entry, suggesting that regardless of cell transformation, a rearrangement of nucleosomes occurs prior to S phase, likely to allow access of replication proteins to the DNA, a process known as nucleosome phasing,89 which is dependent upon the DNA topology, a common feature at origins during replication initiation.14,90 Thus, remodeling of chromatin structure may be necessary to accommodate origin firing and replication fork movement across the replicon, such that the replication machinery has access to the origin to initiate replication. It has been well documented that chromatin structure must be in a favorable configuration for replication to occur,73,91 as it can pose a significant barrier to the progression of DNA replication and other vital processes.92 Nucleosome structure is generally viewed as a roadblock preventing replication initiation, but a properly positioned nucleosome at the replication origin may actually play a positive role in the regulation of initiation. Nucleosomes covering an ARS abolished replication activity, but when they were moved away from the ARS, replication activity returned to normal.93 Moreover, an ORC-dependent nucleosome configuration at ARS1 in budding yeast is required for efficient assembly of the pre-RC and subsequent origin firing.94 Disruption of the ORC-mediated nucleosomal arrangement impairs pre-RC formation and chromosomal initiation. Therefore, although transcription factors at replication origins may increase chromatin accessibility for binding of replication factors, such as ORC, by a direct interaction with pre-RC components or by recruiting chromatin remodeling and histone-modifying complexes,95,96 subsequent nucleosome positioning dictated by the ORC, likely in concert with nucleosome modifiers and remodelers,97 may help recruit or stabilize additional replication initiation proteins to promote origin function. Since the nucleosome phasing is the same in both cell types at all origins examined in this study, it appears that the positional changes of nucleosomes at the level of beads on a string are the same in transformed and normal cells, indicating that cellular transformation, at least for 20mer1, 20mer2, and c-myc origins, causes changes to the higher-order chromatin structure, resulting in differential histone modifications and altered activity of chromatin modifying enzymes encompassing these origins, allowing them to be more accessible to pre-RCs and thus more active. In contrast, cellular transformation does not alter the higher-order chromatin structure encompassing origins in housekeeping gene loci, such as the lamin B2 origin, which is equally active in both transformed and normal cells.
Overall Summary and Conclusion
Overall, the data indicate that the assembly of the pre-RC is dependent on the histone H3 tail modifications at the chromosomal loci of the replication origins, for they must retain an open chromatin configuration, as indicated by high levels of the “activating” histone H3 Ac K9 and low levels of the “silencing” histone H3 tri-Me K9. Other studies have shown the importance of histone modification on regulation of replication origins. For example, the onset of licensing in mammalian cells coincides with an increase in histone H4 Lys 20 monomethylation (H4K20me1) at replication origins by the methyltransferase PR-Set798; furthermore, histone H3 K36me1 together with histone acetylation advances the time of Cdc45 association with replication origins, whereas histone H3 K36me3 together with histone deacetylation delays the time of Cdc45 association with replication origins.99 Several other new roles for chromatin modifications in replication origin control were reviewed by Dorn and Cook.100 Furthermore, polycomb and trithorax group proteins function in distinct multiprotein complexes, which control transcription by altering the structure of chromatin, organizing it into either a “closed” or an “open” conformation, thereby preventing or promoting gene expression, respectively. The Brg-1 and Bmi-1 proteins are involved in modifying the histone tails, as they are part of complexes that remodel the chromatin and mark the chromatin structure, causing permissive or nonpermissive replication states at replication origins. Finally, just prior to the onset of S phase, nucleosomes within origin regions are repositioned based on the action of chromatin modifying complexes (trithorax over polycomb) and how the histone tails are marked (acetylated over methylated), to allow for pre-RC assembly and origin firing. These results correlate well with another study, in which DNA injected into nuclei of cells in early S phase assumes an active hyperacetylated chromatin conformation, whereas DNA injected in late S phase nuclei is packaged into condensed hypoacetylated chromatin,101 indicating how a reorganization of chromatin occurs prior to the onset of S phase.
It is well established that transcription factors and chromatin structure play an important role in replication origin usage. Recent work as well as this study indicates that chromatin-remodeling factors (like Brg-1 containing complexes and Bmi-1 containing complexes) are likely to play an important role in the regulation of replication origin usage. The results to date are most consistent with the role for chromatin remodeling factors in DNA replication as being indirect and very similar to their role in transcription. The current evidence suggests that transcription factors bind to auxiliary sequences adjacent to replication origins and recruit chromatin remodeling factors to create either nucleosome-free regions or regions of specifically spaced nucleosomes. This results in activation of the nearby origin, presumably by making the origin region more accessible to replication factors. Until recently, there has been very little evidence of direct interactions between chromatin remodeling factors and the DNA replication machinery; this study provides direct evidence of such factors interacting with replication origins and gives us a deeper mechanistic understanding of what is occurring at specific origins in both transformed and normal cells. Identification of other chromatin modifying enzymes that are implicated in origin firing as well as replication fork progression will further our understanding of the compete mechanism of initiation of DNA replication.
Materials and Methods
Sequence analyses
The 20mer1, 20mer2, lamin B2, and c-myc origins of DNA replication were scanned for the presence of a 20bp consensus sequence12 using the program fuzznuc (http://bioweb.pasteur.fr/seqanal/interfaces/fuzznuc.html) of the EMBOSS suite of software, allowing 5 mismatches and no gaps (Suppl. Table 1).
Cloning and preparation of constructs
Plasmid constructs used in the transient replication assays were prepared by annealing complementary oligonucleotides or by directionally cloning specifically designed PCR products (Suppl. Tables 2 and 3), some of which had site-directed mutations introduced by sequential PCR steps (Suppl. Table 2 and Suppl. Fig. 1), prepared using a high fidelity DNA polymerase {Pfu DNA polymerase} (Promega, San Luis Obispo, CA, USA) into the BamHI and EcoRI sites of the pBluescript vector (Stratagene, La Jolla, CA, USA) via standard protocol.102 Supercoiled plasmid DNA of the resulting clones as well as the pM1 SEAP vector (Roche Molecular Biochemicals, Indianapolis, IN, USA) was prepared using the Qiagen Maxiprep kit (QIAGEN, Mississauga, ON, Canada) according to manufacturer’s specifications and was sequenced.
Cell culture and FACS analysis
HeLa, NSF (primary normal skin fibroblasts), WI38 (human lung embryo fibroblasts), and WI38 VA13 2RA (WI38 transformed with SV40 virus) were acquired from American Type Culture Collection (Manassas, VA, USA) and cultured in α-minimal essential medium supplemented with penicillin (100 µg/ml), streptomycin (100 µg/ml), 1 mM L-glutamine, tylosin (8 µg/ml), and 10% (v/v) fetal bovine serum (hereafter termed complete medium). When the cells reached 30% to 50% confluence, they were harvested for the isolation of nascent DNA; upon reaching 60% to 80% confluence, they were harvested for isolation of chromatin immunoprecipitated DNA as well as isolation of nuclei for MNase digestion; and upon reaching 100% confluence, they were serum-starved for 48 to 72 hours and harvested for the isolation of genomic DNA. Cell synchronization to the late G1/S phase boundary was carried out by a modification of previously published methods.103,104 In brief, cells were cultured in complete medium in the presence of 2 mM thymidine (Sigma, St Louis, MO) for 12 hours, released for 10 to 11 hours in prewarmed complete medium without thymidine, and then incubated for 12 to 14 hours in complete medium containing either 400 µM mimosine or 2 mM hydroxyurea (Sigma). For flow cytometry analysis, cells were washed twice in ice-cold phosphate-buffered saline (PBS) and resuspended in Vindelov’s solution (3.4 mM Tris, 75 µM propidium iodide, 0.1% NP40, 0.01 M NaCl, 700 U/L Rnase A) overnight at 4°C and then analyzed using a Beckman flow cytometer and the CellQuest program.
Episomal DNA replication (DpnI resistance) assay
For transfections, HeLa, NSF, WI38, and WI38(SV40) cells were seeded in 6-well plates at a density of 3 × 10⁴ cells per well and ~16 hours later were transfected with 3 µg of supercoiled plasmid DNA (2 µg of each construct [pA3/4, p20mer1, p20mer1F, p20merC, pLB2, p20mer(LB2)1F, pLB2C1, p20mer(LB2C1)1F, pBluescript] and 1 µg pM1 SEAP), using FuGENE 6 transfection reagent (Roche Molecular Biochemicals) as per manufacturer’s instructions. At 72 hours post transfection, low molecular weight DNA was isolated and digested with DpnI, the DpnI-digested and undigested DNA were used to transform the DH5α strain of E. coli, and the relative in vivo DNA replication of each transfected plasmid was determined by counting the number of colonies in a bacterial retransformation assay, as previously described.44 The levels of secreted human placental alkaline phosphatase, determined by the SEAP Reporter Gene Assay kit (Roche Molecular Biochemicals) as per manufacturer’s specifications, were used to normalize the transfection efficiency.
Episomal isolation of nascent DNA and chromatin immunoprecipitated DNA
The p20mer1, p20mer1F, p20merC, and pBluescript constructs were transfected into all aforementioned cell lines as described above (see episomal DNA replication [DpnI resistance] assay) with the exception that at 72 hours post transfection, cells were harvested for the isolation of nascent DNA (described below, see isolation of nascent DNA) and chromatin immunoprecipitated DNA (described below, see in vivo cross-linking and chromatin fragmentation and immunoprecipitation and DNA isolation). Primer sets termed plasmid +ve (amplifying a peak region containing the site of an insert) and plasmid −ve (amplifying a control region ~1.5 kb away from the peak region) (refer to Suppl. Table 4 for more information) were specifically designed to amplify solely plasmid DNA (ectopic) and not genomic DNA (endogenous) for real-time PCR quantification analyses of nascent DNA and chromatin immunoprecipitated DNA.
Isolation of genomic DNA
Genomic DNA was isolated using the GenElute Mammalian Genomic DNA Miniprep Kit (Sigma, Oakville, ON, Canada), as per instructions of the manufacturer.
Isolation of nascent DNA
Nascent DNA was prepared using the λ-exonuclease method, as previously described,34,35 with the following modifications: The λ-exonuclease digested samples were heated at 100°C for 3 minutes and then immediately subjected to electrophoresis on a 2% agarose gel. DNA was visualized by staining with 0.02% (w/v) methylene blue (Sigma), and the origin-containing nascent DNA, ranging between 350bp and 1,000bp in size, was excised from the gel, purified with the Sephaglas BandPrep Kit (GE Healthcare, Piscataway, NJ, USA) as per instructions of the manufacturer, and resuspended in TE.
Preparation of whole cell extracts (WCEs)
For the preparation of WCEs, the cells were harvested, washed twice with ice-cold phosphate buffered saline (PBS), and resuspended in 2× packed cell volume (pcv) hypotonic buffer (20 mM HEPES-KOH, pH 7.9, 25% glycerol, 0.42 M NaCl, 1.5 mM MgCl2, 1% Triton X-100, 20 mM EDTA, 50 mM DTT and complete protease inhibitor tablet [Roche Molecular Biochemicals, Indianapolis, IN]). Following a 1-hour incubation at 4°C in constant agitation, the cells were centrifuged at 14,000 g, the supernatant harvested, and its protein concentration determined using the Bradford Protein Assay (Bio-Rad, Hercules, CA).
Chromatin loading
Cell fractionation and preparation of the chromatin-enriched fractions were performed as described in Tatsumi et al. 105 Cells were harvested from 10-cm dishes into ice-cold PBS, centrifuged, resuspended in 1 ml of lysis buffer A (10 mM HEPES-KOH, pH 7.9, 100 mM NaCl, 300 mM sucrose, 0.1% Triton X-100 and complete protease inhibitor tablet [Roche Molecular Biochemicals]), and lysed on ice for 10 minutes. After centrifugation at 2,000 g for 3 minutes at 4°C, pellets were washed once more with ice-cold lysis buffer A and resuspended in lysis buffer B (10 mM HEPES-KOH, pH 7.9, 200 mM NaCl, 300 mM sucrose, 0.1% Triton X-100, 5 mM MgCl2, and complete protease inhibitor tablet [Roche Molecular Biochemicals]) containing 1,000 U of DNase I (Invitrogen). Following incubation at 25°C for 30 minutes, the chromatin-enriched fraction was isolated in the supernatant after centrifugation at 2,500 g for 5 minutes at 4°C and its protein concentration determined using the Bradford Protein Assay (Bio-Rad).
Histone acid extraction
For the preparation of acid extracted histones, the cells were harvested, washed twice with ice-cold PBS containing 5 mM sodium butyrate, centrifuged, and resuspended in buffer A (10mM Tris, pH 8.0, 1.5 mM MgCl2, 5 mM KCl, 0.5 mM DTT, 0.5% NP-40 and complete protease inhibitor tablet [Roche Molecular Biochemicals]); nuclei were collected by centrifugation at 2,000 g for 5 minutes at 4°C. For histone extraction, the isolated nuclei were incubated overnight at 4°C in acid extraction buffer (0.2 N HCl, 10mM Tris, pH 8.8, 1.5 mM MgCl2, and complete protease inhibitor tablet [Roche Molecular Biochemicals]), followed by centrifugation at 11,000 g for 10 minutes at 4°C to pellet the acid-insoluble fraction. The supernatant, containing the acid-soluble proteins, was dialyzed twice for 2 hours against 0.1 N acetic acid and then dialyzed 3 times (1 hour, 3 hours, and overnight) against water. Dialysis was performed using Spectra/Pore 3 Dialysis Membranes 3,500 MWCO (Spectrum Laboratories, Inc., Rancho Dominguez, CA, USA). The concentrations of the histone acid extracts were determined using the Bradford Protein Assay (Bio-Rad).
Isolation of nuclei for micrococcal nuclease (MNase) digestion and genomic DNA purification
Nuclei from HeLa, NSF, WI38, and WI38(SV40) cells were prepared according to Carey and Smale.106 Approximately 2.0 × 10⁷ cells were harvested from 10-cm dishes into ice-cold PBS, centrifuged, and resuspended in ice-cold NP-40 lysis buffer (10 mM Tris-HCl, 10 mM NaCl, 3 mM MgCl2, 0.5% NP-40, 0.15 mM spermine, 0.5 mM spermidine) for 5 min. The resultant nuclei, in addition to high molecular weight genomic DNA (free/naked DNA) isolated from the aforementioned cells using GenElute Mammalian Genomic DNA Miniprep Kit (Sigma) as per manufacturer’s instructions, were pelleted and resuspended in MNase digestion buffer (10 mM Tris-HCl [pH 7.4], 15 mM NaCl, 60 mM KCl, 0.15 mM spermine, 0.5 mM spermidine) containing 1 mM CaCl2. The nuclei and free/naked DNA were then digested with increasing amounts of MNase (Roche Molecular Biochemicals) ranging from 0.1 to 10 U for 5 minutes at room temperature. The reaction was stopped with the addition of MNase stop buffer (100 mM EDTA, 10 mM EGTA [pH 7.5]), and the samples were treated with 25 mg/ml proteinase K overnight at 37°C. Following phenol/chloroform extraction, the samples were treated with 10 mg/ml RNase A for 2 hours, followed by another round of phenol/chloroform extraction. Finally, DNA was ethanol-precipitated and resuspended in TE. The MNase-treated nucleosomal DNA and free/naked DNA were resolved on 1% agarose gels, visualized with ethidium bromide, and photographed with an Eagle Eye apparatus (Speed Light/BT Sciencetech-LT1000).
Probe preparation for southern blot analysis
The probes used in this study were prepared by PCR of the genomic regions corresponding to the M20mer1 origin sequence (probe M20mer1), M20mer2 origin sequence (probe M20mer2), LB2 origin sequence (probe LB2), and Myc11 origin sequence (probe Myc11), which were carried out using their respective primer sets denoted in Suppl. Table 4. PCR products were separated by agarose gel electrophoresis and purified using the QIAquick gel extraction kit (Qiagen) as per manufacturer’s instructions.
MNase-treated nucleosomal DNA digested with restriction enzyme in vitro
MNase-treated nucleosomal DNA (10 µg/reaction) was digested with a different set of restriction enzymes (REs) for every region examined, such that each set of REs was chosen to cleave proximal to either the upstream (5′) or downstream (3′) sites of every probe to be assessed by Southern blot analysis. The list of REs used to cut adjacent to each probe was as follows: BmgBI at the 5′ and FspI at the 3′ of probe M20mer1; SacI at the 5′ and BstEII at the 3′ of probe M20mer2; BglII at the 5′ and FspI at the 3′ of probe LB2; ApaI at the 5′ and ScaI at the 3′ of probe Myc11. Restriction enzyme reactions were prepared as per manufacturer’s instructions.
Southern blot analysis
Southern blot analysis was carried out as described previously.107 Briefly, DNA samples (10 µg) (undigested and digested MNase-treated nucleosomal DNA as well as free/naked DNA) prepared for Southern blot analysis were separated by agarose gel electrophoresis, using a 1% agarose gel run overnight at 50 V. The gels were subsequently treated with 0.5 M HCl for 15 minutes, followed by 1 M NaOH/1.5 M NaCl for 30 minutes, and finally with 1 M Tris-HCl pH7.5/1.5 M NaCl for 30 minutes prior to capillary transfer. The DNA was transferred onto HyBond XL membrane (Amersham) with 0.4 N NaOH overnight. The membrane was prehybridized in hybridization buffer (5× SSC, 5× Denhardt’s solution, 0.5% SDS, 50% formamide, 100 µg/ml sheared Herring sperm DNA) for 90 minutes at 42°C before the addition of the 32P-labeled probe diluted in 20 ml of hybridization buffer. The 32P labeled probes corresponding to the PCR products of chromosomal regions M20mer1, M20mer2, LB2, and Myc11 were prepared using the MegaPrime Labeling kit (Amersham) according to the manufacturer’s instructions. Hybridization was carried out overnight at 42°C and exposed using a phosphorimaging plate (Fuji). Phosphorimages were scanned using the Typhoon Trio Variable Mode Imager (GE).
In vivo cross-linking and chromatin fragmentation
Cells cultured in complete media were washed with prewarmed PBS and treated with 1% formaldehyde for 10 minutes to cross-link proteins and DNA in vivo 104; they were then washed and scraped into ice-cold PBS and resuspended in lysis buffer (50 mM HEPES-KOH pH 7.5, 140 mM NaCl, 1% Triton X-100, 2 mM EDTA) supplemented with a complete protease inhibitor tablet (Roche Molecular Biochemicals). Following passage through a 21G needle 3 times, the nuclei were harvested, resuspended in 1 packed nuclear volume of lysis buffer, and sonicated until DNA fragments of less than 1 kb were obtained. Chromatin size was monitored by electrophoresis. For cell counting, 1 untreated plate was scraped into PBS and resuspended. The cells were then counted with a hematocytometer, and this number was used to derive the total number of treated cells. Also the concentrations of the extracts were determined using the Bradford protein assay (BioRad, Hercules, CA) in order to normalize samples across cell lines.
Immunoprecipitation and DNA isolation
Immunoprecipitation (IP) was carried out as previously described,104 with the following modifications: Briefly, sheared chromatin lysates (500 µg) were precleared by incubation with 50 µl of protein A or protein G agarose (Roche Molecular Biochemicals) to reduce background caused by nonspecific adsorption to the beads, incubated for 6 hours with either 20 µg of anti-ORC2 (Santa Cruz, sc-32734)/(gift from Dr. Anindya Dutta), anti-Cdc6 (Santa Cruz, sc-8341), anti-Cdt1 (Santa Cruz, sc-28262), anti-histone H3 (Millipore, 05-499), anti-diacetyl-histone H3 (Lys 9 + 14) (Millipore, 06-599), anti-trimethyl-histone H3 (Lys9) (Millipore, 07-442), anti-Brg1 (Santa Cruz, sc-17796), anti-Bmi1 (Millipore, 05-637), or normal rabbit serum (NRS) at 4°C with constant rotation. Protein A/G agarose (50 µl) was added and incubated overnight at 4°C. The pelleted beads were washed successively twice with 1 ml of lysis buffer for 15 minutes each at 4°C, followed by 1 ml of WB1 (50 mM Tris-HCl pH 7.5, 500 mM NaCl, 0.1% NP40, 0.05% sodium deoxycholate, complete protease inhibitor tablet), 1 ml of WB2 (50 mM Tris-HCl pH 7.5, 0.1% NP40, 0.05% sodium deoxycholate, complete protease inhibitor tablet), and 1 ml of sterile TE. The beads were resuspended in 200 µl TE/1% SDS, incubated at room temperature for 15 minutes, and centrifuged at 3,000 rpm for 1 minute at room temperature. Half of the supernatant was then incubated overnight at 65°C to reverse the cross-links, followed by 100 µg of proteinase K at 55°C for 2 hours. The DNA was purified using QIAquick PCR purification kit (Qiagen, Valencia, CA) and eluted in 100 µl TE. The remaining half of the supernatant was boiled for 10 minutes in SDS-PAGE loading buffer and subjected to electrophoresis on a 5% stacking/8% separating SDS-PAGE gel for Western blot analysis.
Western blot analysis
Western blot analysis was carried out according to standard protocols.102 Briefly, the indicated amounts of WCEs, chromatin-enriched fractions, and cross-linked immunoprecipitated samples mentioned above were resuspended in SDS loading buffer (50 mM Tris-HCl, pH 6.8, 100 mM DTT, 2% SDS, 0.1% bromophenol blue, 10% glycerol), boiled for 10 minutes, and loaded onto a 5% stacking/8% separating SDS-PAGE gel. Following electrophoresis and transfer onto a PVDF membrane, the membrane was then immunoblotted with the indicated primary and corresponding HRP-conjugated secondary antibodies. The following antibodies were used: anti-ORC2 (Santa Cruz, sc-32734), anti-Cdc6 (Santa Cruz, sc-8341), anti-Cdt1 (Santa Cruz, sc-28262), anti-histone H3 (Millipore, 05-499), anti-diacetyl-histone H3 (Lys 9+14) (Millipore, 06-599), anti-trimethyl-histone H3 (Lys9) (Millipore, 07-442), anti-Brg1 (Santa Cruz, sc-17796), and anti-Bmi1 (Millipore, 05-637). Proteins were visualized using the enhanced chemiluminescence kit according to the manufacturer’s instructions (Amersham Biosciences, Arlington Heights, IL).
Real-time PCR quantification analyses
PCRs were carried out in a total volume of 20 µl with 5 µl of genomic, nascent, or immunoprecipitated DNA, using the LightCycler (Roche Diagnostics), as previously described.36 The sequences and amplification conditions for all primer sets are shown in Suppl. Table 4. Genomic DNA (0.5, 1, 2, 3, and 4 ng) from NSF cells was used to generate the standard curves needed for quantification of all the PCR products, with the exception of the plasmid PCR products, as pBluescript DNA (0.05, 0.1, 0.2, 0.3, and 0.4 ng) was used to generate the standard curves needed for their quantification. A negative control without template DNA was included with each set of reactions. PCR products were also resolved on 2% agarose gels, visualized with ethidium bromide, and photographed with an Eagle Eye apparatus (Speed Light/BT Sciencetech-LT1000). No extraneous bands were generated with any of the primer sets.
Supplementary Material
Footnotes
Supplementary material for this article is available on the Genes & Cancer website at http://ganc.sagepub.com/supplemental.
Author’s Note: This work is dedicated to the memory of Dr. Gerald B. Price, whose expert intellectual and technical advice and most of all friendship is greatly missed.
Declaration of Conflicting Interests: The author(s) declared no potential conflicts of interest with respect to the research, authorship, and/or publication of this article.
Funding: The author(s) disclosed receipt of the following financial support for the research, authorship, and/or publication of this article: This research was supported by grants from the Canadian Prostate Cancer Research Initiative and NCIC–Canadian Cancer Society. D.D.P is a past recipient of a Canadian Institutes of Health Research (CIHR) Cancer Consortium Training Grant Award, a McGill Faculty of Medicine internal studentship award, and present recipient of a Fonds de la Recherche en Santé du Québec (FRSQ) studentship award.
References
- 1. Pospiech H, Grosse F, Pisani FM. The initiation step of eukaryotic DNA replication. Subcell Biochem. 2010;50:79-104 [DOI] [PubMed] [Google Scholar]
- 2. Bell SP, Dutta A. DNA replication in eukaryotic cells. Annu Rev Biochem. 2002;71:333-74 [DOI] [PubMed] [Google Scholar]
- 3. DePamphilis ML, Blow JJ, Ghosh S, et al. Regulating the licensing of DNA replication origins in metazoa. Curr Opin Cell Biol. 2006;18:231-9 [DOI] [PubMed] [Google Scholar]
- 4. Sclafani RA, Holzen TM. Cell cycle regulation of DNA replication. Annu Rev Genet. 2007;41:237-80 [DOI] [PMC free article] [PubMed] [Google Scholar]
- 5. Heller RC, Kang S, Lam WM, et al. Eukaryotic origin-dependent DNA replication in vitro reveals sequential action of DDK and S-CDK kinases. Cell. 2011;146:80-91 [DOI] [PMC free article] [PubMed] [Google Scholar]
- 6. Edenberg HJ, Huberman JA. Eukaryotic chromosome replication. Annu Rev Genet. 1975;9:245-84 [DOI] [PubMed] [Google Scholar]
- 7. Hand R. Eucaryotic DNA: organization of the genome for replication. Cell. 1978;15:317-25 [DOI] [PubMed] [Google Scholar]
- 8. Martin R. The transformation of cell growth and transmogrification of DNA synthesis by simian virus 40. Adv Cancer Res. 1981;34:1-68 [DOI] [PubMed] [Google Scholar]
- 9. Anglana M, Apiou F, Bensimon A, et al. Dynamics of DNA replication in mammalian somatic cells: nucleotide pool modulates origin choice and interorigin spacing. Cell. 2003;114:385-94 [DOI] [PubMed] [Google Scholar]
- 10. Newlon C, Theis J. The structure and function of yeast ARS elements. Curr Opin Genet. Dev. 1993;3:752-8 [DOI] [PubMed] [Google Scholar]
- 11. Dobbs D, Shaiu W, Benbow R. Modular sequence elements associated with origin sequence regions in chromosomal DNA. Nucleic Acids Res. 1994;22:2479-89 [DOI] [PMC free article] [PubMed] [Google Scholar]
- 12. Price GB, Allarakhia M, Cossons N, et al. Identification of a cis-element that determines autonomous DNA replication in eukaryotic cells. J Biol Chem. 2003;278:19649-59 [DOI] [PubMed] [Google Scholar]
- 13. Vashee S, Cvetic C, Lu W, et al. Sequence-independent DNA binding and replication initiation by the human origin recognition complex. Genes Dev. 2003;17:1894-908 [DOI] [PMC free article] [PubMed] [Google Scholar]
- 14. Remus D, Beall EL, Botchan MR. DNA topology, not DNA sequence, is a critical determinant for Drosophila ORC-DNA binding. EMBO J. 2004;23:897-907 [DOI] [PMC free article] [PubMed] [Google Scholar]
- 15. Gilbert DM. Origins go plastic. Mol Cell. 2005;20:657-8 [DOI] [PubMed] [Google Scholar]
- 16. Aladjem MI. Replication in context: dynamic regulation of DNA replication patterns in metazoans. Nat Rev Genet. 2007;8:588-600 [DOI] [PubMed] [Google Scholar]
- 17. Kemp MG, Ghosh M, Liu G, et al. The histone deacetylase inhibitor trichostatin A alters the pattern of DNA replication origin activity in human cells. Nucleic Acids Res. 2005;33:325-36 [DOI] [PMC free article] [PubMed] [Google Scholar]
- 18. Pasero P, Bensimon A, Schwob E. Single-molecule analysis reveals clustering and epigenetic regulation of replication origins at the yeast rDNA locus. Genes Dev. 2002;16:2479-84 [DOI] [PMC free article] [PubMed] [Google Scholar]
- 19. Pappas DL, Jr, Frisch R, Weinreich M. The NAD+-dependent Sir2p histone deacetylase is a negative regulator of chromosomal DNA replication. Genes Dev. 2004;18:769-81 [DOI] [PMC free article] [PubMed] [Google Scholar]
- 20. Crampton A, Chang F, Pappas DL, et al. An ARS element inhibits DNA replication through a SIR2-dependent mechanism. Mol Cell. 2008;30:156-66 [DOI] [PubMed] [Google Scholar]
- 21. Vogelauer M, Rubbi L, Lucas I, et al. Histone acetylation regulates the time of replication origin firing. Mol Cell. 2002;10:1223-33 [DOI] [PubMed] [Google Scholar]
- 22. Aparicio JG, Viggiani CJ, Gibson DG, et al. The Rpd3-Sin3 histone deacetylase regulates replication timing and enables intra-S origin control in Saccharomyces cerevisiae. Mol Cell. Biol 2004;24:4769-80 [DOI] [PMC free article] [PubMed] [Google Scholar]
- 23. Stevenson JB, Gottschling DE. Telomeric chromatin modulates replication timing near chromosome ends. Genes Dev. 1999;13:146-51 [DOI] [PMC free article] [PubMed] [Google Scholar]
- 24. Cosgrove AJ, Nieduszynski CA, Donaldson AD. Ku complex controls the replication time of DNA in telomere regions. Genes Dev. 2002;16:2485-90 [DOI] [PMC free article] [PubMed] [Google Scholar]
- 25. Bell O, Schwaiger M, Oakeley EJ, et al. Accessibility of the Drosophila genome discriminates PcG repression, H4K16 acetylation and replication timing. Nat Struct Mol Biol. 2010;17:894-900 [DOI] [PubMed] [Google Scholar]
- 26. Karnani N, Taylor CM, Malhotra A, et al. Genomic study of replication initiation in human chromosomes reveals the influence of transcription regulation and chromatin structure on origin selection. Mol Biol Cell. 2010;21:393-404 [DOI] [PMC free article] [PubMed] [Google Scholar]
- 27. Rein T, Zorbas H, Depamphilis ML. Active mammalian replication origins are associated with a high-density cluster of mCpG dinucleotides. Mol Cell Biol. 1997;17:416-26 [DOI] [PMC free article] [PubMed] [Google Scholar]
- 28. Delgado S, Gómez M, Bird A, et al. Initiation of DNA replication at CpG islands in mammalian chromosomes. EMBO J. 1998;17:2426-35 [DOI] [PMC free article] [PubMed] [Google Scholar]
- 29. Rein T, Kobayashi T, Malott M, et al. DNA methylation at mammalian replication origins. J Biol Chem. 1999;274:25792-800 [DOI] [PubMed] [Google Scholar]
- 30. Pennings S, Allan J, Davey CS. DNA methylation, nucleosome formation and positioning. Brief Funct Genomic Proteomic. 2005;3:351-61 [DOI] [PubMed] [Google Scholar]
- 31. Martin RG, Oppenheim A. Initiation points for DNA replication in nontransformed and simian virus 40-transformed Chinese hamster lung cells. Cell. 1977;11:859-69 [DOI] [PubMed] [Google Scholar]
- 32. Oppenheim A, Martin RG. Initiation points for DNA replication in nontransformed and simian virus 40-transformed BALB/c 3T3 cells. J Virol. 1978;25:450-2 [DOI] [PMC free article] [PubMed] [Google Scholar]
- 33. Tao L, Nielsen T, Friedlander P, et al. Differential DNA replication origin activities in human normal skin fibroblast and HeLa cell lines. J Mol Biol. 1997;273:509-18 [DOI] [PubMed] [Google Scholar]
- 34. Tao L, Dong Z, Leffak M, et al. Major DNA replication initiation sites in the c-myc locus in human cells. J Cell Biochem. 2000;78:442-57 [DOI] [PubMed] [Google Scholar]
- 35. Tao L, Dong Z, Zannis-Hadjopoulos M, et al. Immortalization of human WI38 cells is associated with differential activation of the c-myc origins. J Cell Biochem. 2001;82:522-34 [DOI] [PubMed] [Google Scholar]
- 36. Di Paola D, Price GB, Zannis-Hadjopoulos M. Differentially active origins of DNA replication in tumor versus normal cells. Cancer Res. 2006;66:5094-103 [DOI] [PubMed] [Google Scholar]
- 37. Dorn ES, Chastain PD, 2nd, Hall JR, et al. Analysis of re-replication from deregulated origin licensing by DNA fiber spreading. Nucleic Acids Res. 2009;37:60-9 [DOI] [PMC free article] [PubMed] [Google Scholar]
- 38. Di Paola D, Rampakakis E, Chan MK, et al. Increased origin activity in transformed versus normal cells: identification of novel protein players involved in DNA replication and cellular transformation. Nucleic Acids Res. 2010;38:2314-31 [DOI] [PMC free article] [PubMed] [Google Scholar]
- 39. Valenzuela MS, Hu L, Lueders J, et al. Broader utilization of origins of DNA replication in cancer cell lines along a 78 KB region of human chromosome 2q34. J Cell Biochem. 2012;113:132-40 [DOI] [PMC free article] [PubMed] [Google Scholar]
- 40. Di Paola D, Zannis-Hadjopoulos M. Comparative analysis of pre-replication complex proteins in transformed and normal cells. J Cell Biochem. 2012;113:1333-47 [DOI] [PubMed] [Google Scholar]
- 41. Trotter KW, Archer TK. The BRG1 transcriptional coregulator. Nucl Recept Signal. 2008;6:e004. [DOI] [PMC free article] [PubMed] [Google Scholar]
- 42. Schuringa JJ, Vellenga E. Role of the polycomb group gene BMI1 in normal and leukemic hematopoietic stem and progenitor cells. Curr Opin Hematol. 2010;17:294-9 [DOI] [PubMed] [Google Scholar]
- 43. Giacca M, Zentilin L, Norio P, et al. Fine mapping of a replication origin of human DNA. Proc Natl Acad Sci U S A. 1994;91:7119-23 [DOI] [PMC free article] [PubMed] [Google Scholar]
- 44. Matheos D, Novac O, Price GB, et al. Analysis of the DNA replication competence of the xrs-5 mutant cells defective in Ku86. J Cell Sci. 2003;116:111-24 [DOI] [PubMed] [Google Scholar]
- 45. DePamphilis ML. The search for origins of DNA replication. Methods 1997;13:211-9 [DOI] [PubMed] [Google Scholar]
- 46. Biamonti G, Perini G, Weighardt F, et al. A human DNA replication origin: localization and transcriptional characterization. Chromosoma. 1992;102:S24-S31 [DOI] [PubMed] [Google Scholar]
- 47. Kumar S, Giacca M, Norio G, et al. Utilization of the same DNA replication origin by human cells of different derivation. Nucleic Acids Res. 1996;24:3289-94 [DOI] [PMC free article] [PubMed] [Google Scholar]
- 48. Kornberg RD, LaPointe JW, Lorch Y. Preparation of nucleosomes and chromatin. Methods Enzymol. 1989;170:3-14 [DOI] [PubMed] [Google Scholar]
- 49. Prasanth SG, Mendez J, Prasanth KV, et al. Dynamics of pre- replication complex proteins during the cell division cycle. Philos Trans R Soc Lond B Biol Sci. 2004;359:7-16 [DOI] [PMC free article] [PubMed] [Google Scholar]
- 50. Schaarschmidt D, Baltin J, Stehle IM, et al. An episomal mammalian replicon: sequence-independent binding of the origin recognition complex. EMBO J. 2004;23:191-201 [DOI] [PMC free article] [PubMed] [Google Scholar]
- 51. Ritzi M, Tillack K, Gerhardt J, et al. Complex protein-DNA dynamics at the latent origin of DNA replication of Epstein-Barr virus. J Cell Sci. 2003;116:3971-84 [DOI] [PubMed] [Google Scholar]
- 52. Wang J, Lindner SE, Leight ER, et al. Essential elements of a licensed, mammalian plasmid origin of DNA synthesis. Mol Cell Biol. 2006;26:1124-34 [DOI] [PMC free article] [PubMed] [Google Scholar]
- 53. Stedman W, Deng Z, Lu F, et al. ORC, MCM, and histone hyperacetylation at the Kaposi’s sarcoma-associated herpesvirus latent replication origin. J Virol. 2004;78:12566-75 [DOI] [PMC free article] [PubMed] [Google Scholar]
- 54. Rupprecht S, Lipps HJ. Cell cycle dependent histone dynamics of an episomal non-viral vector. Gene. 2009;439:95-101 [DOI] [PubMed] [Google Scholar]
- 55. Tessadori F, Zeng K, Manders E, et al. Stable S/MAR-based episomal vectors are regulated at the chromatin level. Chromosome Res. 2010;18:757-75 [DOI] [PMC free article] [PubMed] [Google Scholar]
- 56. Bartkova J, Horejsi Z, Koed K, et al. DNA damage response as a candidate anti-cancer barrier in early human tumorigenesis. Nature. 2005;434:864-70 [DOI] [PubMed] [Google Scholar]
- 57. Gorgoulis VG, Vassiliou LV, Karakaidos P, et al. Activation of the DNA damage checkpoint and genomic instability in human precancerous lesions. Nature. 2005;434:907-13 [DOI] [PubMed] [Google Scholar]
- 58. Bartek J, Bartkova J, Lukas J. DNA damage signalling guards against activated oncogenes and tumour progression. Oncogene. 2007;26:7773-9 [DOI] [PubMed] [Google Scholar]
- 59. Bandura JL, Calvi BR. Duplication of the genome in normal and cancer cell cycles. Cancer Biol Ther. 2002;1:8-13 [DOI] [PubMed] [Google Scholar]
- 60. Lebofsky R, Heilig R, Sonnleitner M, et al. DNA replication origin interference increases the spacing between initiation events in human cells. Mol Biol Cell. 2006;17:5337-45 [DOI] [PMC free article] [PubMed] [Google Scholar]
- 61. Biamonti G, Giacca M, Perini G, et al. The gene for a novel human lamin maps at a highly transcribed locus of chromosome 19 which replicates at the onset of S-phase. Mol Cell. Biol 1992;12:3499-506 [DOI] [PMC free article] [PubMed] [Google Scholar]
- 62. Lau E, Tsuji T, Guo L, et al. The role of pre-replicative complex (pre-RC) components in oncogenesis. FASEB J. 2007;21:3786-94 [DOI] [PubMed] [Google Scholar]
- 63. Lau E, Jiang W. Is there a pre-RC checkpoint that cancer cells lack? Cell Cycle. 2006;5:1602-6 [DOI] [PubMed] [Google Scholar]
- 64. Lau E, Chiang GG, Abraham RT, et al. Divergent S phase checkpoint activation arising from prereplicative complex deficiency controls cell survival. Mol Biol Cell. 2009;20:3953-64 [DOI] [PMC free article] [PubMed] [Google Scholar]
- 65. Dutta A. Chaotic license for genetic instability and cancer. Nat Genet. 2007;39:10-1 [DOI] [PubMed] [Google Scholar]
- 66. Blow JJ, Gillespie PJ. Replication licensing and cancer—a fatal entanglement? Nat Rev Cancer. 2008;8:799-806 [DOI] [PMC free article] [PubMed] [Google Scholar]
- 67. Vaziri C, Saxena S, Jeon Y, et al. A p53-dependent checkpoint pathway prevents rereplication. Mol Cell. 2003;11:997-1008 [DOI] [PubMed] [Google Scholar]
- 68. Dimitrova D, Giacca M, Demarchi F, et al. In vivo protein-DNA interactions at a human DNA replication origin. Proc Natl Acad Sci U S A. 1996;93:1498-503 [DOI] [PMC free article] [PubMed] [Google Scholar]
- 69. Tabancay AP, Forsburg SL. Eukaryotic DNA replication in a chromatin context. Curr Top Dev Biol. 2006;76:129-84 [DOI] [PubMed] [Google Scholar]
- 70. Zhou J, Chau CM, Deng Z, et al. Cell cycle regulation of chromatin at an origin of DNA replication. EMBO J. 2005;24:1406-17 [DOI] [PMC free article] [PubMed] [Google Scholar]
- 71. Rampakakis E, Di Paola D, Chan MK, et al. Dynamic changes in chromatin structure through post-translational modifications of histone H3 during replication origin activation. J Cell Biochem. 2009;108:400-7 [DOI] [PubMed] [Google Scholar]
- 72. Goren A, Tabib A, Hecht M, et al. DNA replication timing of the human beta-globin domain is controlled by histone modification at the origin. Genes Dev. 2008;22:1319-24 [DOI] [PMC free article] [PubMed] [Google Scholar]
- 73. Audit B, Zaghloul L, Vaillant C. et al. Open chromatin encoded in DNA sequence is the signature of ‘master’ replication origins in human cells. Nucleic Acids Res. 2009;37:6064-75 [DOI] [PMC free article] [PubMed] [Google Scholar]
- 74. Fullgrabe J, Kavanagh E, Joseph B. Histone onco-modifications. Oncogene. 2011;30:3391-403 [DOI] [PubMed] [Google Scholar]
- 75. Sun A, Tawfik O, Gayed B, et al. Aberrant expression of SWI/SNF catalytic subunits BRG1/BRM is associated with tumor development and increased invasiveness in prostate cancers. Prostate. 2007;67:203-13 [DOI] [PubMed] [Google Scholar]
- 76. Lin H, Wong RP, Martinka M, et al. BRG1 expression is increased in human cutaneous melanoma. Br J Dermatol. 2010;163:502-10 [DOI] [PubMed] [Google Scholar]
- 77. Medina PP, Sanchez-Cespedes M. Involvement of the chromatin-remodeling factor BRG1/SMARCA4 in human cancer. Epigenetics. 2008;3:64-8 [DOI] [PubMed] [Google Scholar]
- 78. Jiang L, Li J, Song L. Bmi-1, stem cells and cancer. Acta Biochim Biophys Sin (Shanghai). 2009;41:527-34 [DOI] [PubMed] [Google Scholar]
- 79. Glinsky GV. Stem cell origin of death-from-cancer phenotypes of human prostate and breast cancers. Stem Cell Rev. 2007;3:79-93 [DOI] [PubMed] [Google Scholar]
- 80. Li DW, Tang HM, Fan JW, et al. Expression level of Bmi-1 oncoprotein is associated with progression and prognosis in colon cancer. J Cancer Res Clin Oncol. 2010;136:997-1006 [DOI] [PubMed] [Google Scholar]
- 81. Vrzalikova K, Skarda J, Ehrmann J, et al. Prognostic value of Bmi-1 oncoprotein expression in NSCLC patients: a tissue microarray study. J Cancer Res Clin Oncol. 2008;134:1037-42 [DOI] [PubMed] [Google Scholar]
- 82. Wang H, Pan K, Zhang HK, et al. Increased polycomb-group oncogene Bmi-1 expression correlates with poor prognosis in hepatocellular carcinoma. J Cancer Res Clin Oncol. 2008;134:535-41 [DOI] [PubMed] [Google Scholar]
- 83. Agherbi H, Gaussmann-Wenger A, Verthuy C, et al. Polycomb mediated epigenetic silencing and replication timing at the INK4a/ARF locus during senescence. PLoS One. 2009;4:e5622. [DOI] [PMC free article] [PubMed] [Google Scholar]
- 84. Cohen SM, Chastain PD, 2nd, Rosson GB, et al. BRG1 co-localizes with DNA replication factors and is required for efficient replication fork progression. Nucleic Acids Res. 2010;38:6906-19 [DOI] [PMC free article] [PubMed] [Google Scholar]
- 85. Seo S, Herr A, Lim JW, et al. Geminin regulates neuronal differentiation by antagonizing Brg1 activity. Genes Dev. 2005;19:1723-34 [DOI] [PMC free article] [PubMed] [Google Scholar]
- 86. Ohtsubo M, Yasunaga S, Ohno Y, et al. Polycomb-group complex 1 acts as an E3 ubiquitin ligase for Geminin to sustain hematopoietic stem cell activity. Proc Natl Acad Sci U S A. 2008;105:10396-401 [DOI] [PMC free article] [PubMed] [Google Scholar]
- 87. Kaeser MD, Aslanian A, Dong MQ, et al. BRD7, a novel PBAF-specific SWI/SNF subunit, is required for target gene activation and repression in embryonic stem cells. J Biol Chem. 2008;283:32254-63 [DOI] [PMC free article] [PubMed] [Google Scholar]
- 88. Ringrose L, Ehret H, Paro R. Distinct contributions of histone H3 lysine 9 and 27 methylation to locus-specific stability of polycomb complexes. Mol Cell. 2004;16:641-53 [DOI] [PubMed] [Google Scholar]
- 89. Blank TA, Becker PB. The effect of nucleosome phasing sequences and DNA topology on nucleosome spacing. J Mol Biol. 1996;260:1-8 [DOI] [PubMed] [Google Scholar]
- 90. Rampakakis E, Gkogkas C, Di Paola D, et al. Replication initiation and DNA topology: the twisted life of the origin. J Cell Biochem. 2010;110:35-43 [DOI] [PubMed] [Google Scholar]
- 91. Klochkov DB, Gavrilov AA, Vassetzky YS, et al. Early replication timing of the chicken alpha-globin gene domain correlates with its open chromatin state in cells of different lineages. Genomics. 2009;93:481-6 [DOI] [PubMed] [Google Scholar]
- 92. Groth A, Rocha W, Verreault A, et al. Chromatin challenges during DNA replication and repair. Cell. 2007;128:721-33 [DOI] [PubMed] [Google Scholar]
- 93. Simpson RT. Nucleosome positioning can affect the function of a cis-acting DNA element in vivo. Nature. 1990;343:387-9 [DOI] [PubMed] [Google Scholar]
- 94. Lipford JR, Bell SP. Nucleosomes positioned by ORC facilitate the initiation of DNA replication. Mol Cell. 2001;7:21-30 [DOI] [PubMed] [Google Scholar]
- 95. Kohzaki H, Murakami Y. Transcription factors and DNA replication origin selection. Bioessays. 2005;27:1107-16 [DOI] [PubMed] [Google Scholar]
- 96. Cayrou C, Coulombe P, Mechali M. Programming DNA replication origins and chromosome organization. Chromosome Res. 2010; 18:137-45 [DOI] [PubMed] [Google Scholar]
- 97. Berbenetz NM, Nislow C, Brown GW. Diversity of eukaryotic DNA replication origins revealed by genome-wide analysis of chromatin structure. PLoS Genet. 2010;6. [DOI] [PMC free article] [PubMed] [Google Scholar]
- 98. Tardat M, Brustel J, Kirsh O, et al. The histone H4 Lys 20 methyltransferase PR-Set7 regulates replication origins in mammalian cells. Nat Cell Biol. 2010;12:1086-93 [DOI] [PubMed] [Google Scholar]
- 99. Pryde F, Jain D, Kerr A, et al. H3 k36 methylation helps determine the timing of cdc45 association with replication origins. PLoS One. 2009;4:e5882. [DOI] [PMC free article] [PubMed] [Google Scholar]
- 100. Dorn ES, Cook JG. Nucleosomes in the neighborhood: new roles for chromatin modifications in replication origin control. Epigenetics. 2011;6:552-9 [DOI] [PMC free article] [PubMed] [Google Scholar]
- 101. Zhang J, Xu F, Hashimshony T, et al. Establishment of transcriptional competence in early and late S phase. Nature. 2002;420:198-202 [DOI] [PubMed] [Google Scholar]
- 102. Sambrook J, Fritsch EF, Maniatis T. Molecular cloning. 2nd ed. Cold Spring Harbor, NY: Cold Spring Harbor Laboratory Press; 1989 [Google Scholar]
- 103. Stephens RE, Pan CJ, Ajiro K, et al. Studies of human histone messenger RNA. I Methods for the isolation and partial characterization of RNA fractions containing human histone message from HeLa S3 polyribosomes. J Biol Chem. 1977;252:166-72 [PubMed] [Google Scholar]
- 104. Sibani S, Price GB, Zannis-Hadjopoulos M. Decreased origin usage and initiation of DNA replication in haploinsufficient HCT116 Ku80+/- cells. J Cell Sci. 2005;118:3247-61 [DOI] [PubMed] [Google Scholar]
- 105. Tatsumi Y, Tsurimoto T, Shirahige K, et al. Association of human origin recognition complex 1 with chromatin DNA and nuclease-resistant nuclear structures. J Biol Chem. 2000;275: 5904-10 [DOI] [PubMed] [Google Scholar]
- 106. Carey M, Smale ST. Transcriptional regulation in eukaryotes: concepts, strategies, and techniques. Cold Spring Harbor, NY: Cold Spring Harbor Laboratory Press; 2000 [Google Scholar]
- 107. Ausubel FM. Current protocols in molecular biology. Brooklyn, NY: Greene Pub. Associates; 1987 [Google Scholar]
Associated Data
This section collects any data citations, data availability statements, or supplementary materials included in this article.