

Abstract
Previous studies have shown that insulin augments GnRH-stimulated LH synthesis and release from primary gonadotrophs. In this study, regulation of LHβ gene expression by GnRH and insulin was examined in LβT2 cells. Endogenous LHβ mRNA is stimulated 2.4-fold by insulin alone, 2.6-fold by GnRH alone, and 4.7-fold by insulin together with GnRH. This effect of insulin, like GnRH, mapped to sequences −140 to +1 in the mouse LHβ gene. Insulin together with GnRH stimulates activity of an LHβ-reporter gene 7.1-fold; whereas, GnRH alone or insulin alone stimulates the reporter activity 2.8- and 3.1-fold, respectively. Blocking the binding of Egr-1 to sequences −51 to −42 in the LHβ gene inhibits effects of insulin and GnRH. Insulin together with GnRH increases Egr-1 mRNA levels and total Egr-1 binding to LHβ DNA. These findings indicate that insulin may impact regulation of the reproductive axis at the level of the pituitary.
Keywords: Insulin, Luteinizing hormone, Egr-1, GnRH
1. Introduction
For many years, a relationship between GnRH and growth factors signaling in the pituitary has been suggested. Gonadotropin-releasing hormone (GnRH) stimulates gonadotrophs to synthesize and secrete luteinizing hormone (LH) and follicle stimulating hormone (FSH), which are both critical for normal reproductive function. GnRH bound to its receptor on pituitary gonadotrophs activates intracellular signaling pathways shared with insulin and other growth factors. Insulin receptors are expressed in the rat anterior pituitary (Werther et al., 1987; Havrankova and Roth, 1978). Insulin augments GnRH-stimulated secretion of LH from anterior pituitary cells (Soldani et al., 1994; Xia et al., 2001). Neuron-specific disruption of the insulin receptor gene in mice (NIRKO mice) did not affect brain development but impaired fertility and decreased circulating levels of LH, mimicking hypogonadotropic hypogonadism (Bruning et al., 2000). The low levels of LH in NIRKO mice most likely impaired spermatogenesis and maturation of ovarian follicles. After NIRKO mice were treated with lupron, a GnRH receptor agonist, LH levels acutely increased, indicating that expression of insulin receptors in the brain is critical for normal regulation of LH secretion via the hypothalamus. It is also possible that this effect of lupron on LH secretion was, in part, mediated via changes in LHβ gene expression in the pituitary gondaotroph.
Insulin binds to its cell surface receptor and stimulates intracellular phosphorylation of insulin receptor substrates (IRSs) and other proteins. Several IRS proteins have been identified. Insulin stimulates tyrosine (Tyr) phosphorylation of IRS-2 but not IRS-1 in the mouse pituitary (Burks et al., 2000). Mice lacking expression of the IRS-2 gene (IRS-2KO mice) developed type 2 diabetes and were infertile with reduced levels of circulating LH (Burks et al., 2000; Kubota et al., 2000). Disruption of the IRS-2 gene in these mice did not cause abnormal development of the external genitalia or the reproductive tract, but female IRS-2KO mice had small ovaries with few follicles that did not respond to exogenous gonadotropic hormone treatment. Interestingly, IRS-2KO mice had small pituitaries (30% reduction in size) with a 40% decrease in the number of gonadotrophs compared to other cells located in the pituitary, and this most likely contributed to the low circulating level of LH. These findings suggest that signaling pathways involving IRS-2 play an important role in the development, maintenance, and/or normal function of pituitary gonadotrophs, specifically the regulation of LHβ gene expression.
Regulation of LHβ gene expression by GnRH has been examined extensively. Although the nuclear receptor SF-1, the bicoid-related homeoprotein Ptx1, and the early growth response gene Egr-1 all play a role in modulating expression of LHβ, Egr-1 is primarily responsible for mediating the effect of GnRH on LHβ gene expression (Halvorson et al., 1998; Luo et al., 1998; Zhao et al., 2001; Dorn et al., 1999; Tremblay and Drouin, 1999). The effect of GnRH is primarily mediated via a binding site for Egr-1 located between sequences −42 to −51 in the proximal promoter of the mouse LHβ gene (Tremblay and Drouin, 1999). This effect is achieved by marked enhancement of Egr-1 gene expression by GnRH and its downstream signaling pathway via PKA. Furthermore, mice lacking expression of Egr-1 are infertile and lack expression of the LHβ gene (Lee et al., 1996; Topilko et al., 1998). Taken together, these studies indicate that Egr-1 is critical for mediating effects of GnRH on LHβ gene expression.
The Egr-1 gene (also referred as Krox24, NGFI-A, TIS8, or zif268) encodes a zinc finger DNA-binding protein that is increased by various stimuli including growth factors and hormones (Gashler and Sukhatme, 1995; Sukhatme et al., 1987). Other studies have found that Egr-1 gene expression is also induced by insulin in different cell lines (Harada et al., 1995; Mohn et al., 1990; Stumpo and Blackshear, 1991; Alexander-Bridges et al., 1992; Jhun et al., 1995; Sasaoka et al., 1993; Sartipy and Loskutoff, 2003; Keeton et al., 2003). Therefore, Egr-1 can mediate effects of GnRH signaling pathways as well as the insulin-signaling pathway. It is unclear whether Egr-1 can mediate effects of both GnRH and insulin on the same gene target.
In this study, we examined regulation of the mouse LHβ gene by insulin and GnRH. Insulin together with GnRH has an additive effect on LHβ gene expression compared to GnRH or insulin alone. Like GnRH, we found that the effect of insulin on LHβ gene expression is mediated via the Egr-1 binding site located between sequences −51 and −42 in the mouse LHβ gene. Insulin enhances GnRH-activated binding of an Egr-1 complex to LHβ DNA, and this effect correlates with increases in Egr-1 mRNA levels and protein by insulin and GnRH. This is the first study to show that insulin together with GnRH modulates LHβ gene expression and this effect of insulin like GnRH is mediated via Egr-1.
2. Results and discussion
2.1. Detection of IR and IR-activated signaling pathway in LβT2 cells
LβT2 gonadotrope cells were isolated from pituitary tumors that developed in transgenic mice expressing the rat LHβ subunit regulatory region fused upstream of the SV40 T-antigen oncogene (Turgeon et al., 1996). LβT2 cells express LHβ subunit, α subunit, and GnRH receptors. To determine whether LβT2 cells contain components of the insulin-signaling pathway, we first examined whether insulin receptors are expressed in these cells. To detect expression of the IR gene, mRNA was isolated from LβT2 cells and then used in an RT-PCR reaction with primers specific for exon 4 of the IRβ subunit gene. A400 bp DNA product was detected in the presence of LβT2 mRNA (Fig. 1A, lanes 3 and 6 compared to lane 2). This DNA product was consistent with the expected size of exon 4 of the IRβ gene when compared with IRβ gene product in RT-PCR reactions with mRNA from mouse liver and kidney tissues (Fig. 1A, lanes 4 and 5, respectively). To determine whether IRβ protein is also present in LβT2 cells, whole cell extracts were made from LβT2 cells and used in a Western blot analysis with an IRβ subunit antibody. A 95 kDa protein was detected with increasing amounts of LβT2 whole cell extracts (Fig. 1B, lanes 1–3), and this protein comigrated with the IRβ protein detected in Chinese hamster ovary cells overexpressing human insulin receptors (Fig. 1B, lane 4). Therefore, insulin receptor mRNA and protein are both expressed in LβT2 cells.
Fig. 1.
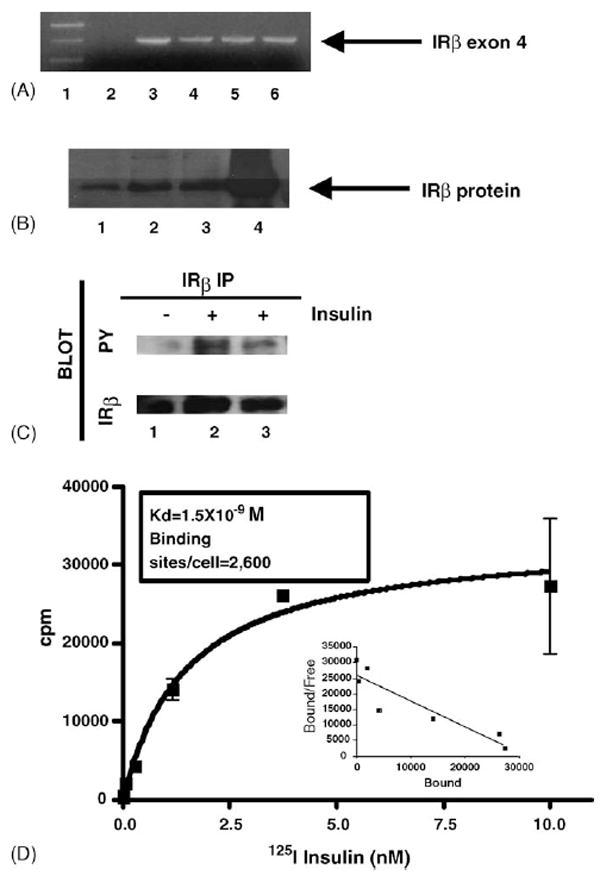
Detection and activation of insulin receptors in LβT2 cells. (A) LβT2 mRNA was isolated and used in a RT-PCR assay to detect the IRβ subunit. PCR products from a reaction with no mRNA template (lane 2), LβT2 mRNA template (lanes 3 and 6), mouse liver mRNA (lane 4), or mouse kidney mRNA (lane 5) was analyzed on an agarose gel as shown. Hi-Lo molecular weight marker (Bionexus) was used to determine the DNA product size (lane 1). A 400 bp product consistent with the size of exon 4 of the IRβ subunit gene was detected as indicated by the arrow. (B) Western blot analysis of whole cell extracts, made from LβT2 cells, was performed with an IRβ subunit antibody. Increasing amounts of LβT2 whole cell extracts (lane 1, 7 μg; lane 2, 14 μg; and lane 3, 21 μg) were used and a 95 kDa band, consistent with the size of the IRβ subunit protein was detected as indicated by the arrow. Whole cell extract from Chinese hamster ovarian cells overexpressing the human insulin receptorwas used as a positive control (lane 4). (C) Whole cell extracts from cells stimulated with insulin for 2 and 10 min (lanes 2 and 3, respectively) compared to unstimulated cells (lane 1) were immunoprecipitated with an IRβ antibody and then analyzed by Western blot analysis with a phosphotyrosine antibody (PY). The blot was reprobed with an IRβ antibody. The autoradiographs are shown. The phosphotyrosine blot is represented by PY and the IRβ blot is represented by IRβ. (D) Saturation radioligand binding assay was performed with 125I-insulin in LβT2 cells. Specific binding of 125I-insulin is displayed as cpm vs. concentration of radiolabeled insulin. The inset shows Schatchard plot of data.
We next examined whether binding of insulin stimulates activation of its signaling pathway in LβT2 cells via inducing Tyr phosphorylation of insulin receptors. IRβ was immunoprecipitated from LβT2 cells stimulated with insulin at 2 and 10 min, and then Tyr phosphorylation of IRβ was detected by Western blot analysis with a phosphotyrosine antibody (Fig. 1C). Insulin alone at 2 and 10 min stimulated activation of IRβ as measured by Tyr phosphorylation in LβT2 cells (Fig. 1C, lanes 2 and 3). There was slightly more phosphorylation detected at 2 min compared to 10 min. Therefore, insulin receptors are expressed in LβT2 cells, and insulin stimulates activation of its receptor in LβT2 cells.
Insulin binding studies were performed to determine the number of insulin receptors in LβT2 cells and the affinity of insulin for its receptor in these cells. The binding of 125I-insulin reached equilibrium at 6 h at 4 °C. The addition of unlabeled insulin to displace the bound radiolabeled insulin was used to determine the specific binding. Graphs of the specific binding and the corresponding Schatchard plot are shown(Fig. 1D). The Kd for insulin binding was 1.5±0.4×10⁻⁹M (R2: 0.9209), and LβT2 cells contain 2600 insulin binding sites per cell. Therefore, insulin binds with high affinity to its receptor in LβT2 cells to activate the insulin-signaling pathway.
2.2. Regulation of LHβ gene expression by insulin and GnRH in LβT2 cells
Since insulin can augment GnRH-stimulated release of LH (Soldani et al., 1994), we examined whether insulin regulates expression of the endogenous LHβ gene. Total RNA was isolated from LβT2 cells stimulated with GnRH pulses followed by additional GnRH alone or GnRH together with insulin, or insulin alone for 30 min and 1 h. Changes in LHβ gene expression were then detected by quantitative RT-PCR with specific primers for the LHβ gene. At 30 min, GnRH alone stimulated LHβ gene expression 1.7-fold; whereas insulin alone had no effect at 30 min (Fig. 2A). Insulin together with GnRH further stimulated LHβ gene expression by 2.6-fold (Fig. 2A, p value < 0.05 compared to unstimulated cells). At 1 h, insulin alone stimulated LHβ gene expression 2.4-fold (Fig. 2B, p value < 0.01) and GnRH alone stimulated LHβ gene expression 2.6-fold (Fig. 2B, p value < 0.001). Together, insulin and GnRH stimulated LHβ gene expression 4.7-fold (Fig. 2B, p value < 0.001 compared to unstimulated cells, and p value < 0.05 compared to cells stimulated with GnRH alone or <0.01 compared to cells stimulated with insulin alone). Therefore, insulin together with GnRH stimulates LHβ gene expression in LβT2 cells.
Fig. 2.
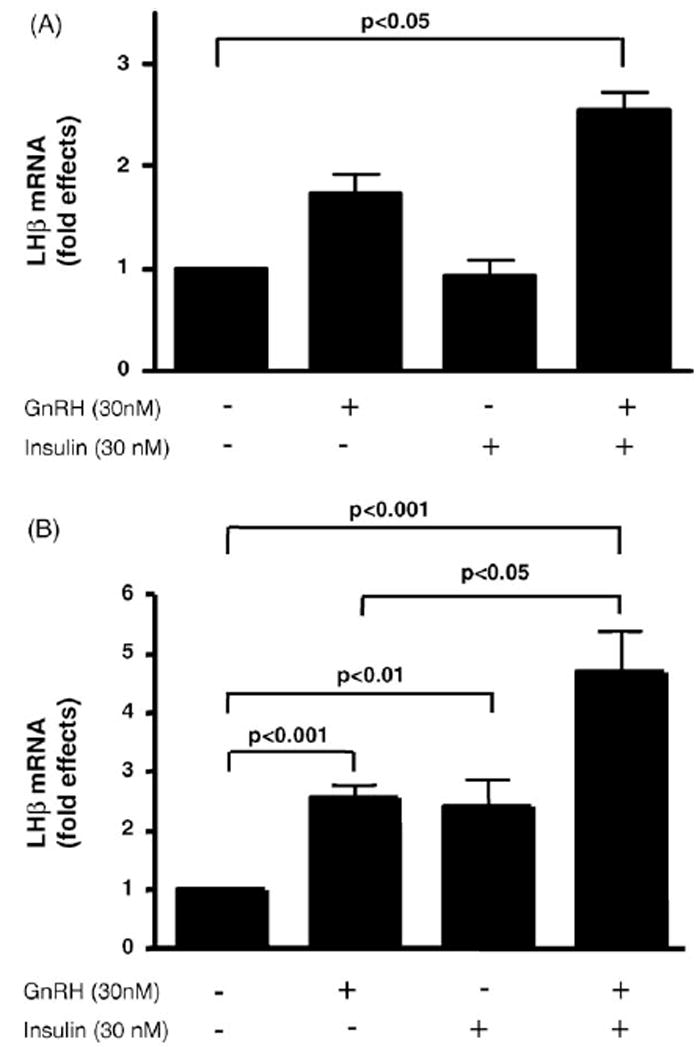
Regulation of LHβ gene expression by insulin and GnRH in LβT2 cells. LβT2 cells were treated with GnRH pulses and then stimulated with insulin alone or GnRH in the absence or presence of insulin for 30 min or 1 h. Total RNA was isolated and quantitative RT-PCR was performed to detect stimulation of LHβ gene expression. Fold effects were determined by comparing expression of LHβ in stimulated cells to unstimulated cells (A) fold effects at 30 min and (B) fold effects at 1 h. Two experiments with a total of four independent samples were analyzed for the 30-min time point, and three experiments with a total of eight independent samples were analyzed for the 1-h time point.
To determine if the effect of insulin on LHβ gene expression is mediated via sequences in the mouse LHβ gene promoter, a reporter construct (LHβ-LUC) was made by linking the mouse LHβ subunit gene (sequences −140 to +1) upstream of sequences encoding the luciferase gene (Fig. 3). LβT2 cells were transfected with the LHβ-LUC and then treated with insulin. Luciferase activity was stimulated 3.5-fold by 5 nM insulin and 3.7-fold by 30nM insulin (p value < 0.05). Insulin had no significant effect on the activity of the reporter gene β-galactosidase (data not shown), nor on a promoterless Luciferase control vector (data not shown). Taken together, these studies show that the effect of insulin on LHβ gene expression is mediated via sequences −140 to +1 in the mouse LHβ gene.
Fig. 3.
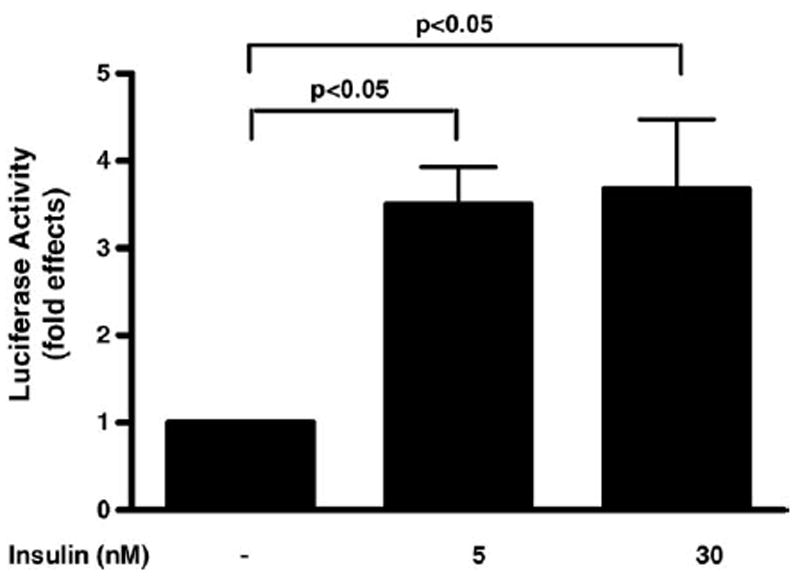
Regulation of LHβ gene promoter activity by insulin in LβT2 cells. LβT2 cells were transfected with a mouse LHβ-luciferase construct (LHβ-LUC) containing mouse LHβ promoter sequences (−140 to +1). Cells transfected with LHβ-LUC and β-galactosidase reporter were stimulated with insulin (5 or 30 nM) at 2 h. Luciferase activity was determined and expressed as fold effects compared to unstimulated cells divided by the corresponding fold effects of β-galatosidase activity. The average of two different experiments with a total of four to six independent samples for each treatment is shown.
2.3. The effect of insulin, like GnRH, on LHβ gene is mediated via Egr-1 binding site
To identify which specific sequences in the mouse LHβ promoter (sequences −140 to +1) are important for mediating the effect of insulin on LHβ-LUC activity, we mutated the Egr-1 binding site located between sequences −51 to −42. Our mutation was almost identical to the Egr-1 binding site mutation previously shown to be important for mediating the effects of GnRH on LHβ gene expression (Tremblay and Drouin, 1999). The LHβ-LUC construct containing the mutant Egr-1 binding site was designated as (mutLHβ-LUC). LβT2 cells were transfected with either LHβ-LUC or a mutLHβ-LUC construct and treated with GnRH (30 nM) alone and/or insulin (30 nM). Similar to our earlier observations, LHβ-LUC activity was stimulated 3.3-fold by insulin alone (p value < 0.05), 3.7-fold by GnRH alone (p value < 0.05), and 7.5-fold by GnRH together with insulin (p value < 0.001 compared to unstimulated cells and p < 0.001 compared to cells stimulated with GnRH alone, Fig. 4A). In contrast, the mutLHβ-LUC activity was not stimulated by GnRH or insulin (Fig. 4B). There was no significant change in β-galactosidase reporter activity by insulin and/or GnRH compared to wild-type or mutant LHβ-LUC reporter activity (data not shown). These results indicate that mutating the Egr-1 binding site in the LHβ promoter blocks both the effect of GnRH and insulin on LHβ gene expression.
Fig. 4.
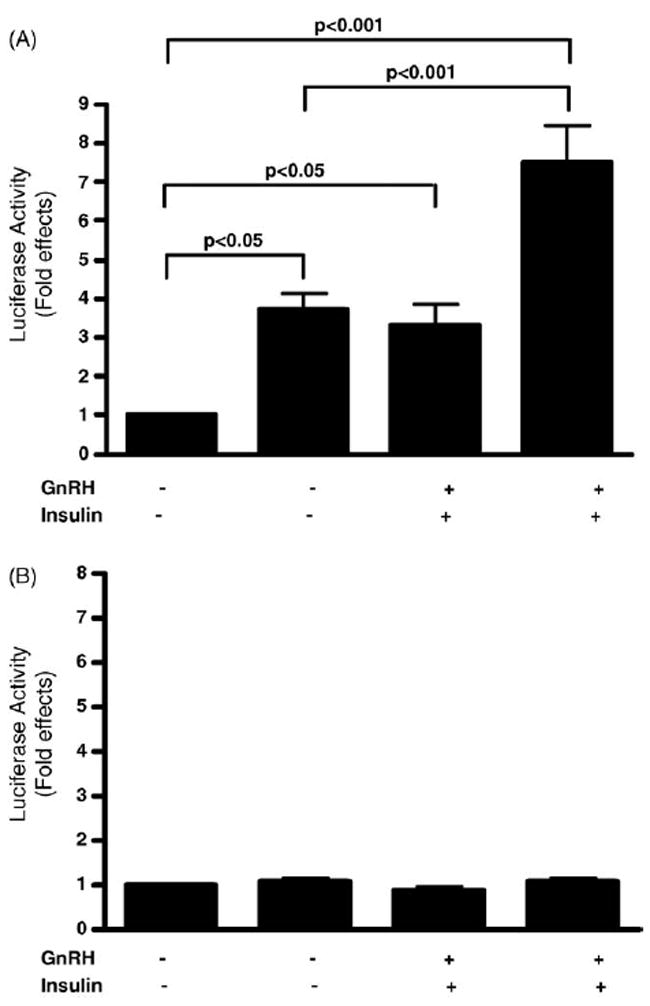
The Egr-1 binding site in the LHβ promoter mediates the effect of insulin and GnRH on LHβ gene promoter activity in LβT2 cells. LβT2 cells were transfected with LHβ-LUC or a mutant LH promoter construct (mutLHβ-LUC), which mutates the binding site for Egr-1. A β-galactosidase reporter was also cotransfected with the luciferase reporters. Cells were treated with GnRH (30 nM) and/or insulin (30 nM) for 2 h as indicated. Luciferase activity was determined and is expressed as fold effects compared to unstimulated cells. The average of three different experiments with a total of eight to nine independent samples for each treatment condition is shown. (A) A graphic representation of LHβ-LUC fold effects divided by the corresponding fold effects of β-galactosidase activity is shown. (B) A graphic representation of mutant LHβ-LUC fold effects divided by the corresponding fold effects of β-galactosidase activity is shown.
2.4. GnRH and insulin modulate Egr-1 gene expression and protein in LβT2 cells
Since the Egr-1 binding site is important for mediating effects of insulin and GnRH on LHβ gene transcription, we examined whether insulin together with GnRH modulates expression of the Egr-1 gene in LβT2 cells. Using quantitative RT-PCR, changes in Egr-1 gene expression were detected after cells were treated with GnRH (30 nM) alone and/or insulin (30 nM). Compared to unstimulated cells, Egr-1 mRNA increased by 181-fold after treatment with GnRH alone for 30 min and 234-fold after treatment with GnRH for 60 min (Fig. 5, p value < 0.001 compared to unstimulated cells). Compared to unstimulated cells, Egr-1 mRNA increased by 3-fold after treatment with insulin for 30 min and 7-fold after treatment with insulin for 60 min (Fig. 5, at 60 min, p value < 0.05 compared to unstimulated cells). In the presence of insulin together with GnRH, Egr-1 was further stimulated to 231-fold at 30 min and 1021-fold at 60 min (Fig. 5, at 60 min, p value < 0.001 compared to unstimulated cells, p value < 0.05 compared to cells treated with GnRH alone at 60 min).
Fig. 5.
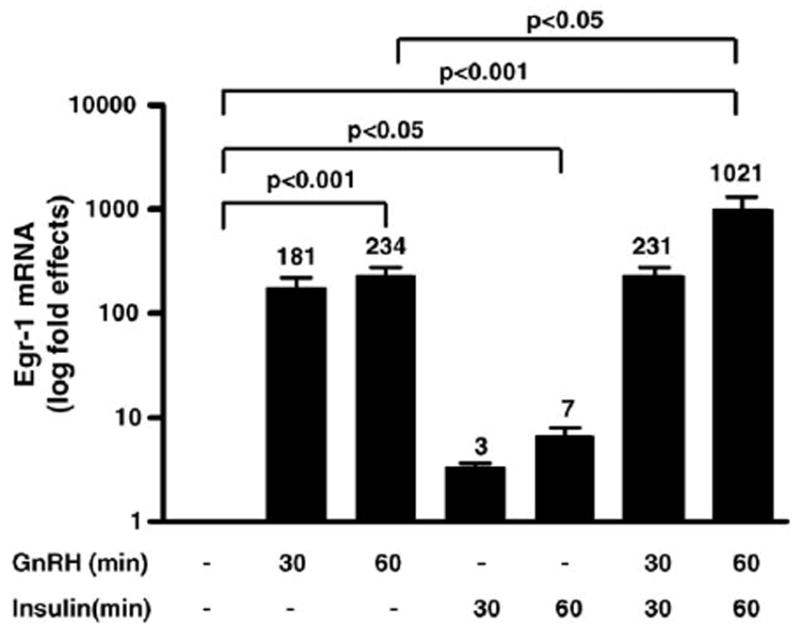
GnRH and insulin modulate expression of Egr-1. TotalRNAwas isolated from LβT2 cells treated with GnRH (30 nM) alone at 30 or 60 min and/or insulin (30 nM) for 30 or 60 min. Quantitative RT-PCR was used to detect Egr-1 gene expression. Fold effects of Egr-1 activated gene expression were determined by comparing stimulated to unstimulated cells. Data from three experiments with a total of four independent samples for the 30 min time point and six independent samples for the 60 min time point is shown. Note data are graphed on a log scale. The fold effects are shown on top of each bar in the graph.
To determine whether changes in Egr-1 gene expression correlates with changes in Egr-1 protein, nuclear extracts were made from LβT2 cells treated with GnRH alone or together with insulin for 30 min and 1 h. Compared to untreated cells, GnRH markedly stimulates Egr-1 protein levels (Fig. 6A, lanes 2 and 3 compared to lane 1). Together with insulin, GnRH more markedly stimulates Egr-1 protein levels compared to GnRH alone (Fig. 6A, lanes 6 and 7 compared to lanes 2 and 3). Fold effects of Egr-1 protein induction by GnRH and insulin was determined and the graph is shown(Fig. 6B). GnRH alone stimulates Egr-1 protein expression by 2.2-fold at 30 min and 5.5-fold at 1 h; whereas together with insulin, GnRH stimulates Egr-1 protein by 4.1-fold at 30 min and 9.7-fold at 1 h (p value < 0.001 for GnRH alone at 60 min and GnRH together with insulin at 60 min compared to unstimulated cells and p value < 0.001 for GnRH alone at 60 min compared to GnRH together with insulin at 60 min). At 30 and 60 min after insulin stimulation, we were unable to observe an increase in Egr-1 protein levels (Fig. 6A, lanes 4 and 5). In a separate experiment after 2 h of stimulation by insulin alone, GnRH alone or GnRH together with insulin, changes in Egr-1 protein levels were examined (Fig. 6C). At this 2-h time point, Egr-1 protein levels did increase in the presence of insulin alone. Fold effects of Egr-1 protein induction at this time point were determined and the graph is shown (Fig. 6D). Insulin alone stimulates Egr-1 protein by 2.6-fold and GnRH alone stimulates Egr-1 protein levels by 10.2-fold. Insulin together with GnRH stimulates Egr-1 protein levels by 15.5-fold at 2 h (Fig. 6C). Therefore, insulin together with GnRH enhances Egr-1 mRNA and protein levels in LβT2 cells.
Fig. 6.
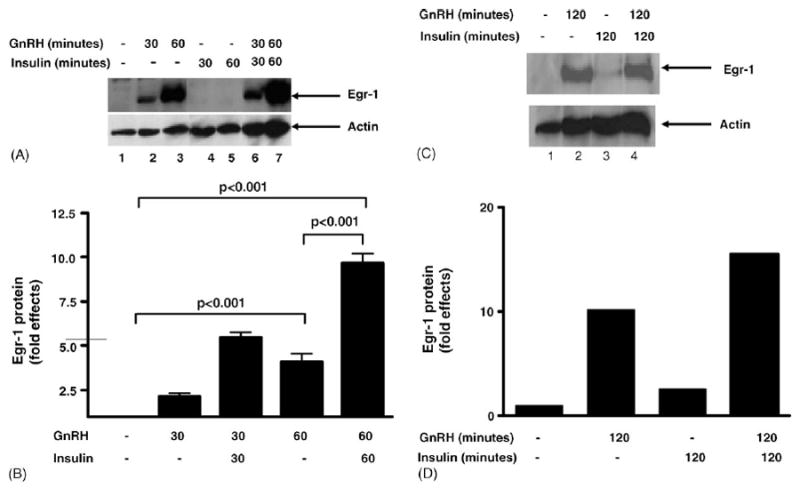
Induction of Egr-1 protein by GnRH and insulin. Nuclear extracts from LβT2 cells stimulated with GnRH alone (lanes 2 and 3), insulin alone (lanes 4 and 5), or GnRH together with insulin (lanes 6 and 7) compared to unstimulated cells (lane 1) were used in a Western blot analysis with an Egr-1 specific antibody. (A) The autoradiograph of a representative experiment is shown. The top panel shows the Egr-1 protein (indicated by the arrow), and the bottom panel shows the control protein, actin. (B) Relative band intensity was quantitated for three experiments with three independent samples for each time point and then corrected for protein loading by using relative band intensity for actin. Fold effects were determined by comparing stimulated cells (GnRH and/or insulin treatment) to unstimulated cells and the graph is shown. (C) Nuclear extracts from LβT2 cells stimulated for two hours with GnRH alone (lane 2), insulin alone (lane 3), or GnRH together with insulin (lane 4) compared to unstimulated cells (lane 1) were used in a Western blot analysis with an Egr-1 specific antibody, and the autoradiograph of a representative experiment is shown. The top panel shows the Egr-1 protein, and the bottom panel shows the control protein, actin. (D) Relative band intensity for Egr-1 was quantitated and then corrected for protein loading by using relative band intensity for actin, and then fold effects were determined by comparing stimulated cells (GnRH and/or insulin treatment) to unstimulated cells and the graph is shown.
2.5. Insulin enhances GnRH-stimulated binding of Egr-1 to LHβ DNA
Since the Egr-1 binding site is important for mediating effects of insulin and GnRH on LHβ gene transcription and GnRH together with insulin markedly enhances Egr-1 mRNA and protein levels in LβT2 cells, we examined whether insulin and GnRH alter binding of Egr-1 to LHβ DNA. Using electrophoretic mobility shift assays, we examined the binding of nuclear extracts made from LβT2 cells treated with GnRH and/or insulin to LHβ DNA. GnRH alone stimulated formation of a new complex compared to untreated cells (Fig. 7, lane 2 versus lane 1 and lane 5 versus lane 4). This new complex was supershifted (ssEgr-1) with an Egr-1 antibody (Fig. 7, lane 3 versus lane 2). Binding of this new complex to LHβ DNA was not detected in cells treated with insulin alone (Fig. 7, lane 6). GnRH together with insulin enhanced formation of this complex to LHβ DNA compared to GnRH treatment alone (Fig. 7, lane 7 versus lanes 5 and 2). Thus, the absence of this complex after insulin treatment alone may reflect the lower induction by insulin and/or a decreased sensitivity of the binding assay. The addition of an Egr-1 specific antibody to nuclear extract from cells treated with GnRH together with insulin, supershifted the new complex (ssEgr-1) similarly to the supershifted complex detected with GnRH alone, indicating that it contains Egr-1 (Fig. 7, lane 8 versus lane 3). In contrast, the addition of an antibody for Oct-1, a protein unrelated to Egr-1 and used a non-specific control, did not alter the binding activity of the Egr-1 complex (Fig. 7, lane 9 versus lane 7). The presence of the same mutation that blocked the effects of GnRH and insulin on LHβ-LUC activity (Fig. 4B) also abolished binding of the Egr-1 complex to LHβ DNA (Fig. 7, lanes 11 and 13 compared to lanes 2, 5, and 7). Taken together, these findings indicate that insulin augments GnRH-mediated activation of LHβ gene expression via an increase in total Egr-1 binding to the LHβ promoter.
Fig. 7.
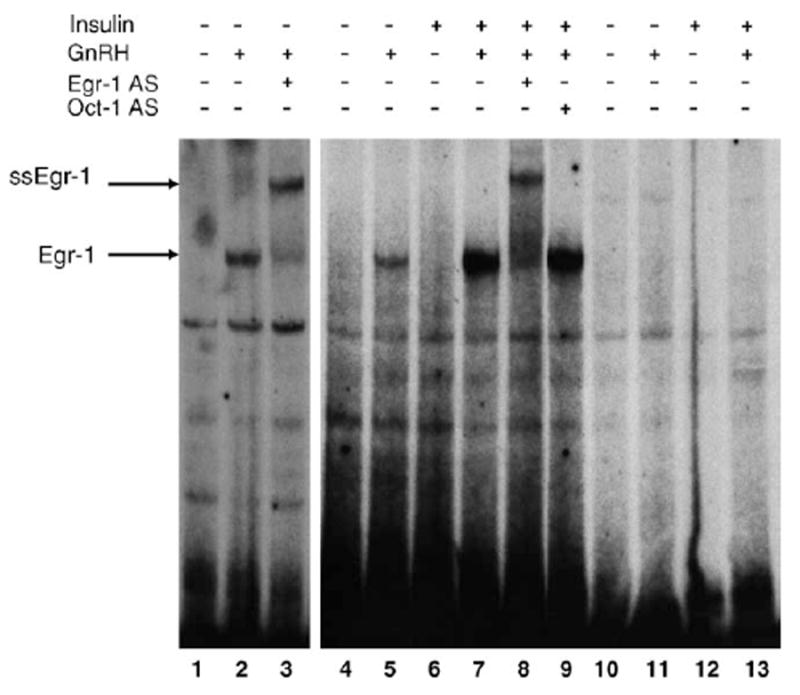
Insulin enhances GnRH-activated Egr-1 binding activity to LHβ DNA. EMSA was performed with [α-32P]dCTP-labeled wild-type LHβ DNA (−59 to −32). Two separate experiments are shown. Binding of wild-type LHβ DNA with nuclear extract from untreated cells (lanes 1 and 4) or cells treated with GnRH alone (lanes 2 and 5), GnRH in the presence of an Egr-1 specific antibody (lane 3), insulin alone (lane 6), or GnRH together with insulin in the absence (lane 7) or presence (lane 8) of an Egr-1 specific antibody is shown. An antibody to a protein (Oct-1) unrelated to Egr-1 was added to the binding reaction as a non-specific control (lane 9). Binding of mutant LHβ DNA with nuclear extract from untreated cells (lane 10), cells treated with GnRH alone (lane 11), cells treated with insulin alone (lane 12), or cells treated with GnRH together with insulin (lane 13) is shown. The Egr-1 binding complex is identified by the arrow, and ssEgr-1 indicates the location of the supershifted Egr-1 complex.
3. Conclusion
This is the first study to demonstrate that insulin together with GnRH modulates expression of the LHβ gene in a gonadotroph cell line, LβT2. These pituitary derived cells contain high affinity binding sites for insulin and insulin binding leads to activation of the insulin-signaling pathway in LβT2 cells. We observed that insulin alone increases expression of the endogenous mouse LHβ gene in LβT2 cells, and further stimulation of LHβ gene expression was obtained by treatment with insulin together with GnRH. This effect of insulin, like GnRH, mapped to promoter sequences −140 to +1 located in the mouse LHβ gene. Although GnRH alone modulates LHβ gene expression, there is further enhancement of the effect of GnRH in the presence of insulin.
Similar to GnRH, the effect of insulin on LHβ gene expression is dependent on the transcription factor Egr-1. Our studies show that sequences −140 to +1 of the mouse LHβ gene confer insulin- and GnRH-stimulated activation of the mouse LHβ-reporter construct. The mouse LHβ promoter contains a binding site for Egr-1 located between sequences −51 and −42. This Egr-1 binding site has been previously shown to mediate effects of GnRH on LHβ gene expression (Tremblay and Drouin, 1999). Mutating the Egr-1 binding site in the reporter construct, LHβ-LUC, blocked the stimulatory effects of both insulin and GnRH. Therefore, similar to GnRH, the effect of insulin on LHβ gene expression is dependent on a functional binding site for Egr-1 in the mouse LHβ promoter.
To further elucidate a mechanism through which the effect of insulin is mediated, we found that insulin enhances GnRH-stimulated increases in Egr-1 mRNA and protein level as well as binding of Egr-1 to LHβ DNA. Therefore, it appears that effects of insulin and GnRH on Egr-1 gene expression most likely contribute to changes in LHβ gene expression. These observations are consistent with other studies that have shown that Egr-1 gene expression is modulated by GnRH (Tremblay and Drouin, 1999; Dorn et al., 1999) or insulin alone (Harada et al., 1995; Mohn et al., 1990; Stumpo and Blackshear, 1991; Alexander-Bridges et al., 1992; Jhun et al., 1995; Sasaoka et al., 1993; Sartipy and Loskutoff, 2003; Keeton et al., 2003), and therefore provides a mechanism through which the effects of insulin and GnRH on LHβ gene expression is mediated.
Recent observations by Dorn et al. (2004) found that insulin enhances LHβ gene activity and the effect of insulin was dependent upon binding elements for Egr-1 and SF-1, which also mediated effects of GnRH on the LHβ gene. Since this study did not find that insulin increases Egr-1 or SF-1 mRNA levels; they postulated that perhaps insulin modulates interactions between Egr-1 and SF-1. Furthermore, in this study, insulin had no effect of the GnRH-mediated activation of the LHβ gene.
In contrast, our study provides a mechanism through which insulin, like GnRH, mediates its effect via Egr-1. Differences in cell culture condition between our study and that of Dorn et al. may explain why we were able to observe an interaction between GnRH and insulin-signaling pathways. This mechanism of enhancing Egr-1 transcription and protein level is in keeping with previous reports that insulin regulates Egr-1 transcription (Harada et al., 1995; Mohn et al., 1990; Stumpo and Blackshear, 1991; Alexander-Bridges et al., 1992; Jhun et al., 1995; Sasaoka et al., 1993; Sartipy and Loskutoff, 2003; Keeton et al., 2003). Furthermore, others have shown that GnRH utilizes mitogen-activated protein kinase (MAPK) pathways to regulate expression of gonadotropin genes (Naor et al., 2000; Harris et al., 2002). Regulation of the equine LHβ (eLHβ) promoter by GnRH is mediated partly via a protein kinase C/MAPK pathway (Call and Wolfe, 1999). The MAPK inhibitor, PD98054, completely blocked activation of Egr-1 gene expression and partly blocked GnRH-activated expression of the LHβ gene. Insulin-signaling pathways also stimulate MAPK pathways, but additional studies may provide more insight into whether the effects of GnRH and insulin utilize the same signaling components upstream of activating Egr-1. It is also possible that non-MAPK signaling pathways, such as PI3-kinase pathway, may also mediate effects of insulin on LHβ gene expression, since only part of the effect of GnRH on eLHβ was MAPK-dependent.
The observation that insulin modulates expression of the LHβ gene may provide new insights into mechanisms through which hyperinsulinism can potentially impact the reproductive axis. Studies in IRS-2KO mice indicate that IRS-2 signaling is important for gonadotroph development and/or maintenance (Burks et al., 2000), and our study indicates that insulin signaling is also important for direct regulation of LHβ gene expression especially in the presence of GnRH. Therefore, our findings would indicate that the decrease in LH levels in the IRS-2KO mice may reflect a lack of insulin’s direct effect on LHβ gene expression.
Disorder of hyperinsulinism one of which is commonly seen in polycystic ovary syndrome (PCOS) is characterized by menstrual irregularity, hyperandrogenism, and polycystic ovaries. PCOS is associated with diabetes, obesity, and the metabolic syndrome. A clear genetic etiology or mechanism connecting effects of insulin to the menstrual irregularity seen in PCOS has not been clearly elucidated. Since a subset of women with PCOS have elevated LH levels and may also have hyperinsulinism, we propose that the elevation of LH in these women may reflect an effect of insulin on expression of the LHβ gene that is augmented in the presence of GnRH. Therefore, exploring mechanisms through which insulin regulates the reproductive axis at the level of the pituitary gonadotroph may be important for examining effects of hyperinsulinism on the regulation of puberty and reproduction.
4. Experimental procedures
4.1. Cell culture and transfection studies
All tansfections were performed with FuGENE 6 Transfection Reagent (Roche). LβT2 cells were grown in Dulbecco modified Eagle medium (Cellgro) and supplemented with 10% fetal calf serum and plated at approximately 1×10⁶ cells per well in a 6-well plate the evening prior to transfection. The following morning, cells were transfected with the wild-type mouse LHβ promoter (−140 to +1)-luciferase construct (0.46 μg/well) or mutant LHβ promoter-luciferase (mutLHβ-LUC) construct, which blocks binding of Egr-1. The mutLHβ-LUC was generated by the Transformer Site-Directed Mutagenesis Kit (CLONTECH Laboratories, Inc.). The mutagenic primer used to alter the Egr-1 binding site was 5′-GTTAGTGGCCTTGCTGTTCTTAGAGCCCGCAGGTTAAAG (mutations are indicated by bold type). Six hours after DNA was added, cells were serum-starved overnight. The following morning the cells were stimulated with GnRH (30 nM) for 2 h and/or insulin at varying concentrations (5 or 30 nM). Standard luciferase assays were performed 24 h after transfection using Lumat LB 9507 (Perkin-Elmer). Transfection efficiency was determined by using a β-galactosidase control reporter vector which has the SV40 early promoter inserted upstream of the lacZ gene (CLONTECH). Each experiment was performed with three independent samples and at least three separate experiments were used for each figure. Results were expressed as fold effects of relative luciferase units by comparing stimulated values to control (luciferase activity in unstimulated cells divided by the corresponding fold effects of β-galactosidase activity (a control gene).
4.2. Quantitative RT-PCR
To examine LHβ gene expression, LβT2 cells were treated with three 15-min pulses of GnRH as previously described (Turgeon et al., 1996) for 2 days. Cells were serum-starved overnight (after day 1 of GnRH pulse treatment) and then stimulated with GnRH (30 nM) and/or insulin (30 nM) for 30 min and 60 min (insulin was added with the third GnRH pulse on day 2). To examine Egr-1 gene expression, LβT2 cells were stimulated with GnRH (30 nM) and/or insulin (30 nM) for 30 min and 60 min after cells were placed in serum-free medium overnight. Total RNA was obtained from LβT2 cells (Aurum Total RNA, Biorad). Two micrograms of RNA was reverse transcribed (iScript cDNA Synthesis Kit, Biorad) to produce cDNA. cDNA representing 10 ng of starting RNA was used in each reaction. Twenty-five microliters of PCR reactions were performed using the IQ SybrGreen supermix (Biorad). Reactions were measured using the ICycler quantitative real time PCR machine (Biorad). Primer sets for mouse LHβ (sense, 5′-AACTCTGGCCGCAGAGAATG-3′ and antisense 5′-GCAGTACTCGGACCATGCTA-3′), Egr-1 (sense 5′-CAGCGGCGGTAATAGCA-3′ and antisense 5′-GGAGAAGCGGCCAGTAT-3′) and a ribosomal 18S control (sense, 5′-CGGCTACCACATCCAAGGAA-3′ and antisense, 5′-GCTGGAATTACCGCGGCT-3′) were used. Serial 10-fold dilutions of a representative sample were used to assess efficiency of each reaction. Cycle threshold (Ct) was calculated for each sample. Only samples for which the Ct fell within a range calculated to have 100–120% efficiency were used. A corrected Ct (Delta Ct) was calculated by subtracting the 18S Ct from the Egr-1 Ct for each sample. Relative differences from the control sample were then calculated by using the formula: fold change = 2̂(Control Delta Ct minus Sample Delta Ct).
4.3. RT-PCR
LβT2 mRNA was isolated and cDNA was made using the Access RT-PCR Introductory System (Promega®). The cDNA was then used in a standard PCR reaction with mouse insulin receptor primers (sense 5′-AACTGCTCAGTCATTGAGGG-3′ and antisense 5′-ACATCCCCACATTCCTCGTT-3′). PCR products were analyzed by electrophoresis.
4.4. Electrophoretic mobility shift assays (EMSAs)
Nuclear extracts were made from cells treated with GnRH (100 nM) alone and/or insulin (100 nM) for 2 h using a buffer containing 20mM Hepes, 0.4M NaCl, 1mM EDTA, 1mM EGTA, 1mM DTT, and protease inhibitors. Nuclear extract was incubated with [α-32P]dCTP-labeled LHβ DNA generated by PCR amplification with the following primers: for 5′-TGGCCTTGCCACCCCCACAACCCGCAGGCAAACCCCG CCAGCGTC for wild-type LHβ DNA or TGGCCTTGCTGTTCTTAGAGCCCGCAG GCAAACCCCGCCAGCGTC for mutant LHβ DNA (with mutations indicated by bold type). A common reverse primer was used in the PCR reactions to generate the LHβ DNA. The nuclear extract and DNA probe were incubated in binding buffer (50mM KCl, 20% glycerol, 20mM Hepes, 5mM MgCl2, 1mM DTT, 0.1 mg/ml BSA, poly(dI-dC), and salmon sperm DNA at 4 °C as previously described (Tan et al., 2003). For supershift analysis, an Egr-1 specific activity or Oct-1 antibody (Santa Cruz Biotechnology) was added 30 min after nuclear extract was incubated with the DNA probe, and then the binding reaction was continued for 30 additional minutes at 4 °C before analysis by Tris borate–EDTA buffer electrophoresis followed by autoradiography.
4.5. Western blot analysis
Nuclear and whole cell extracts were made from LβT2 cells. Whole cell extracts were made using RIPA buffer (1 × PBS, 0.1% SDS, 1% NP-40, 1mM DTT, and protease inhibitors). Nuclear extracts were made as described above. Egr-1 and insulin receptor β subunit antibodies (Santa Cruz Biotechnologies) were used to detect Egr-1 and IRβ subunit proteins via ECL Western Blotting Detection Kit (Amersham Pharmacia, UK). For the Egr-1 Western blot, relative band intensity was quantitated using NIH image version 1.63.
4.6. Immunoprecipitation and immunoblotting
Immunoprecipitation was performed as described in (Deng et al., 2003). Whole cell extracts were prepared as described above after treatment of LβT2 cells with insulin (100 nM) for 2 or 10 min. Each reaction contained WCE (500 μcg) with an IRβ antibody (Santa Cruz Biotechnology).
4.7. Insulin binding assays
Saturation radioligand binding assays were performed using cell extract obtained from LβT2 cells. Cells were incubated at 4 °C for 6 h with 3.75 nM to 4.6 pM 125I-insulin in the absence of presence of 10 mM unlabeled competitor insulin. 125I-activity in cell lysate was measured by gamma counter. Kd and binding sites per cells were calculated by non-linear regression analysis. Cells were counted in a parallel plate to determine binding sites per cell. Experiments were performed in triplicates and repeated twice.
4.8. Statistics
Each transfection experiment was performed with three independent samples for each treatment group and repeated three separate times. All quantitative RT-PCR studies were performed with duplicate determination of each individual sample and analyzed via ANOVA using Bonferroni’s Multiple Comparison Test to determine statistical significance. Data were presented as ±S.E.M. A p value of less than 0.05 was determined to be significant. For quantitative RT-PCR experiments, statistical analysis was performed on the corrected cycle threshold data before conversion to fold effects.
Acknowledgments
We thank P. Mellon for generously providing LβT2 cells to perform these studies. We thank J. Harris, R. Lurvey, and A.T. Mpungu for excellent technical assistance. This work was supported by grants from the National Institutes of Health (NICHD U54 HD41859 and P60 DK20595) to S.R. and F.E.W. as well as grants from the National Institutes of Health (NIDDK DK069518-01) and the Robert Wood Johnson Foundation to C.B.
References
- Alexander-Bridges M, Buggs C, Giere L, Denaro M, Kahn B, White M, Sukhatme V, Nasrin N. Mol Cell Biochem. 1992;109:99–105. doi: 10.1007/BF00229762. [DOI] [PubMed] [Google Scholar]
- Bruning JC, Gautam D, Burks DJ, Gillette J, Schubert M, Orban PC, Klein R, Krone W, Muller-Wieland D, Kahn CR. Science. 2000;289:2122–2125. doi: 10.1126/science.289.5487.2122. [DOI] [PubMed] [Google Scholar]
- Burks DJ, de Mora JF, Schubert M, Withers DJ, Myers MG, Towery HH, Altamuro SL, Flint CL, White MF. Nature. 2000;407:377–382. doi: 10.1038/35030105. [DOI] [PubMed] [Google Scholar]
- Call GB, Wolfe MW. Biol Reprod. 1999;61:715–723. doi: 10.1095/biolreprod61.3.715. [DOI] [PubMed] [Google Scholar]
- Deng Y, Bhattacharya S, Swamy OR, Tandon R, Wang Y, Janda R, Riedel H. J Biol Chem. 2003;278:39311–39322. doi: 10.1074/jbc.M304599200. [DOI] [PubMed] [Google Scholar]
- Dorn C, Mouillet JF, Yan X, Ou Q, Sadovsky Y. Am J Obstet Gynecol. 2004;191:132–137. doi: 10.1016/j.ajog.2004.01.054. [DOI] [PubMed] [Google Scholar]
- Dorn C, Ou Q, Svaren J, Crawford PA, Sadovsky AY. J Biol Chem. 1999;274:13870–13876. doi: 10.1074/jbc.274.20.13870. [DOI] [PubMed] [Google Scholar]
- Gashler A, Sukhatme VP. Prog Nucleic Acid Res. 1995;50:191–224. doi: 10.1016/s0079-6603(08)60815-6. [DOI] [PubMed] [Google Scholar]
- Halvorson LM, Ito M, Jameson JL, Chin WW. J Biol Chem. 1998;273:14712–14720. doi: 10.1074/jbc.273.24.14712. [DOI] [PubMed] [Google Scholar]
- Harada S, Smith RM, Smith JA, Shah N, Hu DQ, Jarett L. J Biol Chem. 1995;270:26632–26638. doi: 10.1074/jbc.270.44.26632. [DOI] [PubMed] [Google Scholar]
- Harris D, Bonfil D, Chuderland D, Kraus S, Seger R, Naor Z. Endocrinology. 2002;143:1018–1025. doi: 10.1210/endo.143.3.8675. [DOI] [PubMed] [Google Scholar]
- Havrankova J, Roth J. Nature. 1978;272:827–829. doi: 10.1038/272827a0. [DOI] [PubMed] [Google Scholar]
- Jhun BH, Haruta T, Meinkoth JL, Leitner W, Draznin B, Saltiel AR, Pang L, Sasaoka T, Olefsky JM. Biochemistry. 1995;34:7996–8004. doi: 10.1021/bi00025a005. [DOI] [PubMed] [Google Scholar]
- Keeton AB, Bortoff KD, Bennett WL, Franklin JL, Venable DY, Messina JL. Endocrinology. 2003;144:5402–5410. doi: 10.1210/en.2003-0592. [DOI] [PubMed] [Google Scholar]
- Kubota N, Tobe K, Terauchi Y, Eto K, Yamauchi T, suzuki R, Tsubamoto Y, Komeda K, Nakano R, Miki H, Satoh S, Sekihara H, Sciacchitano S, lesniak M, Aizawa S, Nagai R, Kimura S, Akanuma Y, Taylor SI, Kadowaki T. Diabetes. 2000;49:1880–1889. doi: 10.2337/diabetes.49.11.1880. [DOI] [PubMed] [Google Scholar]
- Lee SL, Sadovsky Y, Swirnoff AH, Polish JA, Goda P, Gavrilina G, Milbrandt J. Science. 1996;273:1219–1221. doi: 10.1126/science.273.5279.1219. [DOI] [PubMed] [Google Scholar]
- Luo X, Ikeda Y, Parker KL. Cell. 1998;77:481–490. doi: 10.1016/0092-8674(94)90211-9. [DOI] [PubMed] [Google Scholar]
- Mohn KL, Lax TM, Melby AE, Taub R. J Biol Chem. 1990;265:21914–21921. [PubMed] [Google Scholar]
- Naor Z, Benard O, Seger R. Trends Endocrinol Metab. 2000;11:91–99. doi: 10.1016/s1043-2760(99)00232-5. [DOI] [PubMed] [Google Scholar]
- Sartipy P, Loskutoff DJ. J Biol Chem. 2003;278:52298–52306. doi: 10.1074/jbc.M306922200. [DOI] [PubMed] [Google Scholar]
- Sasaoka T, Takata Y, Kusari J, Anderson CM, Langlois WJ, Olefsky JM. Proc Natl Acad Sci U S A. 1993;90:4379–4383. doi: 10.1073/pnas.90.10.4379. [DOI] [PMC free article] [PubMed] [Google Scholar]
- Soldani R, Cagnacci A, Yen SS. Eur J Endocrinol. 1994;131:641–645. doi: 10.1530/eje.0.1310641. [DOI] [PubMed] [Google Scholar]
- Stumpo DJ, Blackshear PJ. J Biol Chem. 1991;266:455–460. [PubMed] [Google Scholar]
- Sukhatme VP, Kartha S, Toback FG, Taub R, Hoover RG, Tsai-Morris CH. Oncogene Res. 1987;1:343–355. [PubMed] [Google Scholar]
- Tan L, Peng H, Osaki M, Choy BK, Auron PE, Sandell LJ, Goldring MB. J Biol Chem. 2003;278:17688–17700. doi: 10.1074/jbc.M301676200. [DOI] [PubMed] [Google Scholar]
- Topilko P, Schneider-Maunoury S, Levi G, Trembleau A, Gourdji D, Driancourt MA, Rao CV, Charnay P. Mol Endocrinol. 1998;12:107–122. doi: 10.1210/mend.12.1.0049. [DOI] [PubMed] [Google Scholar]
- Tremblay JJ, Drouin J. Mol Cell Biol. 1999;19:2567–2576. doi: 10.1128/mcb.19.4.2567. [DOI] [PMC free article] [PubMed] [Google Scholar]
- Turgeon JL, Kimura Y, Waring DW, Mellon PL. Mol Endocrinol. 1996;10:439–450. doi: 10.1210/mend.10.4.8721988. [DOI] [PubMed] [Google Scholar]
- Werther GA, Hogg A, Oldfield BJ, McKinley MJ, Figdor R, Allen AM, Mendelsohn FA. Endocrinology. 1987;121:1562–1570. doi: 10.1210/endo-121-4-1562. [DOI] [PubMed] [Google Scholar]
- Xia Y-X, Weiss J-M, Polack S, Diedrich K, Ortmann O. Eur J Endocrinol. 2001;144:73–79. doi: 10.1530/eje.0.1440073. [DOI] [PubMed] [Google Scholar]
- Zhao L, Bakke M, Krimkevich Y, Cushman LJ, Parlow AF, Camper SA, Parker KL. Development. 2001;128:147–154. doi: 10.1242/dev.128.2.147. [DOI] [PubMed] [Google Scholar]