

Abstract
Objective
To design a simple matching acuity test based on hand gestures that is minimally dependent on familiarity with symbols and letters. The visual acuity results obtained from children using the Handy Eye Chart™ were compared with results obtained with the Early Treatment Diabetic Retinopathy Study (ETDRS) chart.
Design
Evaluation of diagnostic test or technology.
Participants
60 children between 6 and 16 years of age were recruited consecutively from the Pediatric Ophthalmology section of the Emory Eye Center.
Methods
Monocular visual acuity was tested using both the new eye chart and the ETDRS chart, alternating the order of administration between subjects. Testing was performed on the subject’s eye with the poorest acuity.
Main Outcome Measures
Outcome measures were monocular logarithm of the minimum angle of resolution (logMAR) visual acuity scores for each chart.
Results
The acuities were shown to have a strong linear correlation (r = 0.95) and a mean difference in acuity of −0.03 (95% confidence interval −0.05 to −0.01) logMAR, equivalent to approximately 1.5 letters, with the new eye chart underestimating the vision as determined by the ETDRS chart. The 95% limits of agreement were ±1.6 lines.
Conclusion
The present study supports the validity of the new eye chart as a measure of visual acuity in pediatric patients ages 6 to 18 with vision ranging from 20/16 to 20/200.
Assessing vision in non-verbal or developmentally challenged individuals can be difficult, but is especially necessary in educational settings where academic placement testing often depends on visual performance. A variety of functional visual assessment tools are used in educational settings, often by classroom vision teachers, to obtain a general sense of a child’s level of visual function1. One of us (CLH, a teacher of visually impaired children) designed a useful functional visual assessment tool, “The Thumbs Up Test™2. The test relies on a child’s ability to see a printed symbol of a hand positioned in one of three gestures: a thumbs-up gesture, a thumbs-down gesture or a victory sign (also sometimes recognized as a peace symbol). Progressively smaller font sizes of the symbols are presented to the child, and the result of the test is provided in a descriptive manner as the smallest sized symbol that the child can identify and the distance at which the symbol was held for the child to identify it. Informal testing performed by this group, with ten typically-developing subjects wearing Bangerter occlusions foils, revealed that the test was not capable of discriminating between individuals with normal and impaired vision because the optotypes did not blur equally and could be recognized even at the smallest font size. As such, the test was unable to distinguish between patients with normal vision and those considered “legally blind” with vision worse than 20/200. The test has therefore been redesigned to form the The Handy Eye Chart™, applying the concept of the Thumbs-up Test™ (using hand gesture optotypes to test vision). The new chart consists of four new optotypes that appear to blur equally, in a linear eye chart designed in accordance with accepted standards for visual acuity chart construction (Figure 1)3,4. The purpose of this study was to validate the new eye chart by comparing visual acuities obtained with this chart to those obtained with the standard Early Treatment Diabetic Retinopathy Study (ETDRS) chart.
Figure 1.
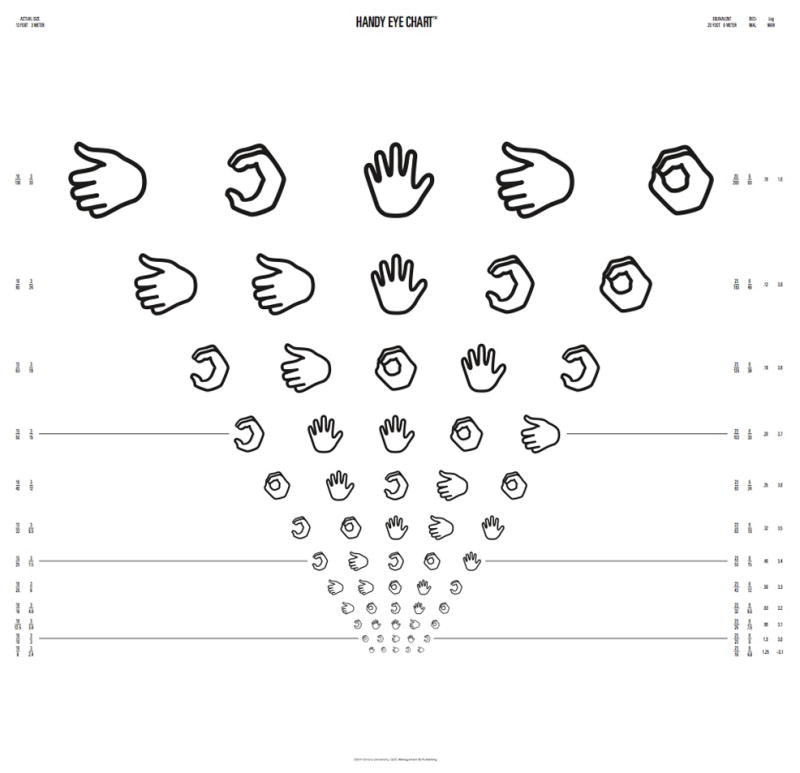
The Handy Eye Chart™ (reduced size).
Methods
The study was reviewed and approved by the Emory University Institutional Review Board, was HIPAA (Health Insurance Portability and Accountability Act) compliant and conformed to the tenets of the Declaration of Helsinki. Patients and/or their guardians gave informed consent to participate in the study.
In order to follow the recognized standard, the new eye chart was designed in the logarithmic linear format of the ETDRS chart. Four symbols representing “thumbs-up”, “circle”, “palm” and the letter “C” hand gestures were used as optotypes (Figure 1). Initially the symbols were designed to be exactly the same height as the Sloan letters on the ETDRS chart, but a preliminary analysis revealed that visual acuity was consistently underestimated by the new chart; therefore, the size of the optotypes was increased using Adobe vector graphic sizing and empirical assessment.
Each row on the new chart contains five optotypes, including at least one of each of the four symbols. The order in which the symbols are presented on each line was randomized. The optotypes are spaced proportionally and the lines progress in 0.1 log unit steps from 20/16 logarithm of the minimum angle of resolution (logMAR) −0.1) to 20/200 (logMAR 1.0) at a viewing distance of ten feet. Therefore the optotypes on each line are approximately 1.26 (the tenth root of ten or 0.1 log unit) times the height of the optotypes on the next lower line. The vertical distance between adjacent rows is equal to the height of the row below (e.g. the smaller of the two rows).
Consecutive patients presenting for eye examinations at the Pediatric Ophthalmology section of Emory Eye Center were invited to participate in the study if they were between the ages of 6 and 18 years, were deemed capable of undergoing visual acuity testing with the ETDRS chart, and had visual acuity in at least one eye in the range 20/16 to 20/200 as determined by testing with the ETDRS chart.
Distance visual acuity was determined monocularly using both the gold-standard ETDRS chart and the new chart, alternating the order of administration between patients. The worst seeing eye of each patient was tested so as to obtain a sample across a wide range of visual acuities without fatiguing the children. Visual acuity was measured on both charts by a single examiner, who was not masked to the results of the first test when conducting the second. The chart stand was positioned at a distance of 10 feet from the examination chair. The subject’s other eye was occluded with opaque tape during testing. Routine clinical lighting was used to illuminate the chart, and every patient was tested in the same room for both tests.
For both charts, the tester asked the subject to identify the optotypes on a single line two lines larger than the most recently recorded acuity, from left to right. Acuity was scored as the total number of optotypes identified correctly. The following formula, which assigns a value of 0.02 log unit to each optotype identified, was used to transform scores to logMAR values:
where Tc = the total number of optotypes measured correctly. This method of visual acuity determination was based on a previous study in which another set of four optotypes, the LEA symbols, were compared to the Bailey-Lovie chart.5
In addition, for each optotype identified incorrectly, both the symbol that was given as a response and the symbol that was missed were noted. Patient age, ocular diagnoses, and the order in which the two charts were administered were also recorded.
All data analyses were performed using SAS (Statistical Analysis Software, SAS Institute, Cary NC). The agreement between the two visual acuity tests was assessed using a paired t test, limits of agreement, and a linear regression, while differences in difficulty in identifying each of the four optotypes were determined using the percent misidentifications and a chi-square goodness of fit test.
Results
Sixty children were enrolled in the study. Mean patient age was 9.4 years (standard deviation(SD)=2.7, range=6 to16). There were 34 male and 26 female patients. The tested eye diagnoses are listed in Table 1, and included a range of pathology as well as apparently typically developing eyes.
Table 1.
Participant Diagnoses*
| Active Diagnosis | # Participants (%) |
|---|---|
| Strabismus | 32 (53) |
| Anisometropia | 6 (10) |
| Amblyopia | 15 (25) |
| Anterior Segment Opacity | 3 (5) |
| Retinal Pathology | 4 (7) |
| Optic Nerve Pathology | 4 (7) |
| Other | 23 (38) |
| Normal | 4 (7) |
some participants had more than one diagnosis
Figure 2 shows the raw acuity data. Best-corrected logMAR visual acuity ranged from −0.1 to 1.02 for the ETDRS chart and from −0.04 to 0.98 for the new chart using the scoring method described above. Mean ± SD logMAR visual acuity obtained with the new eye chart was 0.26 (20/36) ± 0.25, as compared with 0.22 (20/33) ± 0.25 for the ETDRS. Although this difference was statistically significantly different (t = −3.09 p = 0.003) the difference was not clinically significant.
Figure 2.

Raw acuity data from the ETDRS (Early Treatment Diabetic Retinopathy Study) chart and The Handy Eye Chart™ for each patient. The mean and median values for each test are shown. (VA = visual acuity, logMAR = logarithm of the minimum angle of resolution)
Figure 3 illustrates the difference between the tests for each patient (ETDRS value minus the new chart value). The mean acuity difference was −0.03 LogMAR (SD=± 0.08, range −0.24 to 0.1), with a 95% confidence interval (CI) for the mean difference of −0.05 to −0.01, indicating that on average the patients scored 1.5 letters better with the ETDRS chart than with the new eye chart.
Figure 3.

Histogram of the acuity difference between the Handy Eye Chart™ and the ETDRS (Early Treatment Diabetic Retinopathy Study) chart for each participant. The mean acuity difference is −0.03 +/−0.08 logMAR (95% CI = −0.05 to 0.01), or approximately 1.5 letters. The range of acuity differences was −0.24 to 0.1 logMAR. (VA = visual acuity, logMAR = logarithm of the minimum angle of resolution, CI = confidence interval).
Figure 4 provides a Bland Altman style plot of the difference between monocular acuities obtained using the new chart and ETDRS plotted as a function of the mean of the two. This plot also shows the limits of agreement of the two tests (defined as the mean ± 2 SD), which were −0.19 to 0.13 logMAR. In terms of the number of lines (with one line = 0.1 logMAR), the width of the interval defined by the limits of agreement was 0.32 logMAR, which is equivalent to ± 1.6 lines. This difference did not appear to vary as a function of the mean acuity.
Figure 4.

Bland-Altman style plot showing monocular acuity difference as a function of the mean acuity for each participant. The lines are drawn at the mean and ± 2 standard deviations. The difference in acuity between the two tests appears uniform across the range of visual acuity tested. The 95% limits of agreement between the two tests are −0.19 to 0.13 logMAR (logarithm of the minimum angle of resolution). (SD = standard deviation, VA = visual acuity, ETDRS = Early Treatment Diabetic Retinopathy Study)
Figure. 5 is a regression analysis of the new chart versus ETDRS acuities. The correlation coefficient is 0.95, indicating a strong linear association between acuities measured with the two charts. The 95% prediction interval for the visual acuity measured by the new chart at a given ETDRS visual acuity is ± 1.7 lines, which agrees with the limits of agreement value calculated from the standard deviation of the differences between the two tests.
Figure 5.

Linear regression of the Handy Eye Chart™ against ETDRS (Early Treatment Diabetic Retinopathy Study) chart monocular acuities, showing a strong linear correlation of 0.95. The dotted lines are the 95% PI (prediction intervals) indicating the limits of agreement at ± 0.17 logMAR or ± 1.7 lines. The regression equation is: Handy Eye Chart™ = 0.05 + 0.97 (ETDRS). (VA = visual acuity, logMAR = logarithm of the minimum angle of resolution).
Among all 60 children there were 186 misidentified optotypes. These misidentifications were distributed across the 4 optotypes as follows: Up: 45 (24%), “C”: 42 (23%), Palm: 53 (28%), Circle: 46 (25%). These percentages did not differ significantly from the expected 25% for each optotype when the optotypes are equally difficult (p = 0.71).
Discussion
The results of the present study support the validity of the new Handy Eye Chart™ as a measure of visual acuity in pediatric patients ages 6 to 18 years over a wide range of visual acuities. There was a strong linear correlation, of 0.95, and a mean difference between the charts of 0.03 ± 0.08 logMAR, equivalent to approximately 1.5 letters of acuity difference. This means that, on average, children scored one and a half letters better on the ETDRS than on the new chart over the range of acuities tested (from 20/16 to 20/200). In the context of individual assessments, the 95% limits of agreement were ±1.6 lines, suggesting that in 95% of cases the difference between the two measured acuities would be within ± 1.6 lines.
These data suggest that the functional vision assessment technique (the Thumbs-up Test™) that is currently in use in the Dekalb County, Georgia Public School System might be improved upon. Although vision teachers in the school system have found this test to be useful as a gross estimate of the vision of multiply handicapped and non-verbal children, our preliminary analysis suggested that the test was actually not capable of discriminating between normally sighted eyes and those with visual acuity less than 20/200 (designated level for “legal blindness” in the USA). The new chart was therefore developed based on the same concept of using hand gestures to communicate visual recognition of a symbol, with modified symbols, an increased number of symbols, and an eye chart format that conformed to accepted standards.
A range of visual acuity tests are available for use with children. Unlike tests of visual acuity for adults, which are based more strictly upon geometric principles (each subunit of a single optotype is designed to subtend one minute of arc and the entire optotype to subtend five minutes of arc), the most thoroughly validated visual acuity test for children (the Lea symbol chart) was validated empirically6. The Lea symbols chart has been widely used and assessed in a number of studies5,7–11. The analysis of the Handy Eye Chart was therefore patterned on a prior study used to validate the Lea symbol chart7.
The introduction of the new eye chart has promising implications, in that it adds a tool to the arsenal of visual acuity testing methods for children. In the clinical setting, visual acuity is often tested in non-verbal children using the technique of matching. This limits the ability of the examiner to perform simultaneous measurements, such as refraction at the phoropter when the child must look down and away from the phoropter to select a matching optotype. Our chart would allow the child to show with one hand what he can see while maintaining fixation on the chart.
The new chart might also aid in the visual acuity screening of children with language delay, patients who do not speak English, who are shy or who have aphasia. By removing spoken language from the screening procedure, vision can be assessed in these populations. The new chart would also be useful at those times when an HOTV or Lea Symbol matching card is not available.
One issue that has been raised about our new chart is a concern that some of the gestures used may have offensive meanings in some countries, thus awareness of cultural differences is important when considering the use of this chart in international settings.
This study is preliminary and the optotypes have not yet been subjected to the extensive analysis to which the Lea symbols have withstood. However, this study forms a first step in this assessment. A recent analysis of adult discrimination performance for pediatric acuity test optotypes revealed that adults with no ocular disorders generate varying acuity estimates when completing a battery of commonly used pediatric acuity tests, and that optotype discrimination performance varies within most of the tests11. The study concludes that there is room for improvement in many of the commonly used pediatric visual acuity tests.
Although this study demonstrated potential for use of the new eye chart in children aged 6–18 years, additional study will be required to see how the optotypes perform when presented in isolated fashion and when introduced to the population of children for whom they were intended (younger, non-verbal and developmentally delayed children).
Acknowledgments
Financial support by: An unrestricted gift to the Emory Eye Center from The Georgia Knights Templar Foundation, an unrestricted grant to the Emory Eye Center from Research to Prevent Blindness, Inc., New York, New York, and a National Eye Institute Departmental Core grant EY06360.
Footnotes
Conflict of interest: Dr. Hutchinson, Ms. Cromelin and Ms. Harrington have a proprietary interest in the Handy Eye Chart™
This material is accepted for presentation at the 2012 Annual meeting of the Association for Research and Vision In Ophthalmology
Publisher's Disclaimer: This is a PDF file of an unedited manuscript that has been accepted for publication. As a service to our customers we are providing this early version of the manuscript. The manuscript will undergo copyediting, typesetting, and review of the resulting proof before it is published in its final citable form. Please note that during the production process errors may be discovered which could affect the content, and all legal disclaimers that apply to the journal pertain.
References
- 1.Langley B, Dubose RF. Functional vision screening for severely handicapped children. New Outlook Blind. 1976;70:346–50. [Google Scholar]
- 2.Harrington CL. In: Thumbs-Up test: Visual acuity estimation assessment and functional vision screening. Group TL, editor. Atlanta, GA: GOC Management and Publ; 2000. pp. xx–xx. [Google Scholar]
- 3.Recommended standard procedures for the clinical measurement and specification of visual acuity. Report of Working Group 39. Committee on Vision. Assembly of Behavioral and Social Sciences, National Research Council, National Academy of Sciences, Washington, D. C. Adv Ophthalmol. 1980;42:103–48. [PubMed] [Google Scholar]
- 4.Bailey IL, Lovie JE. New design principles for visual acuity letter charts. Am J Optom Physiol Opt. 1976;53:740–5. doi: 10.1097/00006324-197611000-00006. [DOI] [PubMed] [Google Scholar]
- 5.Dobson V, Clifford-Donaldson CE, Miller JM, et al. A comparison of Lea Symbol vs ETDRS letter distance visual acuity in a population of young children with a high prevalence of astigmatism. J AAPOS. 2009;13:253–7. doi: 10.1016/j.jaapos.2009.01.007. [DOI] [PMC free article] [PubMed] [Google Scholar]
- 6.Hyvarinen L, Nasanen R, Laurinen P. New visual acuity test for pre-school children. Acta Ophthalmol (Cophen) 1980;58:507–11. doi: 10.1111/j.1755-3768.1980.tb08291.x. [DOI] [PubMed] [Google Scholar]
- 7.Vision in Preschoolers (VIP) Study Group. Visual acuity results in school-aged children and adults: Lea Symbols chart versus Bailey-Lovie chart. Optom Vis Sci. 2003;80:650–4. doi: 10.1097/00006324-200309000-00010. [DOI] [PubMed] [Google Scholar]
- 8.Graf MH, Becker R, Kaufmann H. Lea Symbols: visual acuity assessment and detection of amblyopia. Graefes Arch Clin Exp Ophthalmol. 2000;238:53–8. doi: 10.1007/s004170050009. [DOI] [PubMed] [Google Scholar]
- 9.Becker R, Hubsch S, Graf M, Kaufmann H. Examination of young children with Lea symbols. Br J Ophthalmol. 2002;86:513–6. doi: 10.1136/bjo.86.5.513. [DOI] [PMC free article] [PubMed] [Google Scholar]
- 10.Vision in Preschoolers (VIP) Study Group. Threshold visual acuity testing of preschool children using the crowded HOTV and Lea Symbols acuity tests. J AAPOS. 2003;7:396–9. doi: 10.1016/s1091-8531(03)00211-8. [DOI] [PubMed] [Google Scholar]
- 11.Candy TR, Mishoulam SR, Nosofsky RM, Dobson V. Adult discrimination performance for pediatric acuity test optotypes. Invest Ophthalmol Vis Sci. 2011;52:4307–13. doi: 10.1167/iovs.10-6391. [DOI] [PMC free article] [PubMed] [Google Scholar]
- 12. [Accessed April 20, 2011.];Development of the LEA Optotypes. Available at: http://www.lea-test.fi/en/vistests/pediatric/history/symbhist.html.