

Abstract
Transcranial magnetic stimulation (TMS) of cerebral cortex is a popular technique for the non-invasive investigation of motor function. TMS is often assumed to influence spinal circuits solely via the corticospinal tract. We were interested in possible trans-synaptic effects of cortical TMS on the ponto-medullary reticular formation in the brainstem, which is the source of the reticulospinal tract and could also generate spinal motor output. We recorded from 210 single units in the reticular formation of three anaesthetized macaque monkeys whilst TMS was performed over primary motor cortex. Short latency responses were observed consistent with activation of a cortico-reticular pathway. However, we also demonstrated surprisingly powerful responses at longer latency, which often appeared at lower threshold than the earlier effects. These late responses seemed to be generated partly as a consequence of the sound click made by coil discharge, and changed little with coil location. This novel finding has implications for the design of future studies using TMS, as well as suggesting a means of non-invasively probing an otherwise inaccessible important motor centre.
Key points
Transcranial magnetic stimulation (TMS) is a popular technique for the non-invasive investigation of motor function and is often assumed to influence spinal circuits solely via the corticospinal tract.
In anaesthetized monkeys, we observed robust responses to TMS over motor cortex in single units recorded within the brainstem reticular formation.
Short latency responses were consistent with activation of a cortico-reticular pathway. More powerful later responses seemed to be associated with the click sound produced by the coil on discharge.
Activation of brainstem neurones by sound must be considered as a potential confound during future TMS studies.
TMS might provide an easy, non-invasive method for activating the motor reticular formation in human subjects.
Introduction
In humans, the corticospinal tract is the major pathway relaying motor commands from brain to spinal cord, and is especially important for hand control. Transcranial magnetic stimulation (TMS; Barker et al. 1985) is frequently used to investigate this pathway both in healthy subjects and for diagnostic purposes in patients. The superficial location of the primary motor cortex (M1) on the anterior bank of the central sulcus readily lends itself to activation by this technique.
Our understanding of the corticospinal activity elicited by TMS is underpinned by invasive recordings both in monkey (Edgley et al. 1990, 1997) and in human subjects (Di Lazzaro et al. 1998, 1999). In addition to corticospinal activation, it is known that TMS over M1 can stimulate intracortical elements (Kujirai et al. 1993), as well as projections to other cortical (Ferbert et al. 1992; Ilmoniemi et al. 1997; Siebner et al. 2001), and subcortical regions (Strafella et al. 2001). However, few studies have made direct recordings of the neural activity elicited in remote neural centres by TMS to the cortex.
One important sub-cortical motor structure with input from M1 is the ponto-medullary reticular formation (PMRF) (Matsuyama & Drew, 1997; Rho et al. 1997; Kably & Drew, 1998), which gives rise to the reticulospinal tract (Sakai et al. 2009; Baker, 2011). We have recently shown that the primate reticulospinal tract can influence a diverse range of muscles in the upper limb, even including the intrinsic muscles of the hand (Riddle et al. 2009). Such connections may become especially important after damage to the corticospinal tract (e.g. after stroke), when reticulospinal pathways have been suggested to contribute to functional recovery (Dewald et al. 1995; Mazevet et al. 2003; Baker, 2011; Zaaimi et al. 2012). However, at present methods for non-invasive assessment of this pathway are limited. Some cortico-reticular connections from M1 are collaterals of corticospinal neurones (Keizer & Kuypers, 1989); since TMS over M1 stimulates the corticospinal tract, it should also activate the reticular formation transsynaptically. Consistent with this, at high intensities TMS over M1 can elicit responses in ipsilateral muscles (Wassermann et al. 1994; Ziemann et al. 1999). These effects have a longer latency than those in contralateral muscles, and are influenced by neck rotation (Ziemann et al. 1999), suggesting that they could be mediated via a bilaterally organized brainstem descending pathway (most likely the reticulospinal tract).
In this paper, we characterize the impact of TMS over M1 on PMRF neurones, including a small number of identified reticulospinal cells. We show that cells are activated by the stimulus at a range of latencies, which may reflect multiple underlying pathways.
Methods
Experiments were performed in three anaesthetized macaque monkeys (all female, weights 9.5 kg, 10.5 kg and 8.4 kg). Animal procedures were carried out in accordance with UK Home Office regulations (Animals (Scientific Procedures) Act 1986) and approved by the Local Research Ethics Committee of Newcastle University.
Surgical preparation
Surgical procedures were performed under deep general anaesthesia using sevoflurane inhalation (3–5% in 100% O2) and intravenous infusion of alfentanil (7–23 μg kg−1 h−1). Initial preparation included a tracheotomy, and insertion of central arterial and venous lines via the major neck vessels. A laminectomy was made of vertebrae C4–C5, and a craniotomy of the occipital bone was created extending 5–8 mm bilaterally, dorsal to the foramen magnum. The dura under this window was removed, and the cistern opened.
Following this surgery, anaesthesia was switched to an intravenous infusion of propofol (5–14 mg kg−1 h−1) and alfentanil (doses as above). The vertebral column was clamped at the high thoracic and midlumbar levels and the head was fixed in a stereotaxic frame with the neck flexed by ∼70 deg. To prevent the metal frame attachments from interfering with magnetic stimulation, the head was then fixed by a separate system of two rigid plastic rods, clamped to the stereotaxic frame and anchored to the cranium with dental acrylic and titanium skull screws. Once the acrylic had set and the head was firmly held by this arrangement the standard metal ear and eye bars were removed, leaving the head fixed in the stereotaxic planes but held only by plastic attachments. Neuromuscular blockade was achieved with atracuronium (0.7 mg kg−1 h−1) and a bilateral pneumothorax minimized respiratory movements. Continuous monitoring of physiological measures (heart rate, arterial and venous blood pressure, pulse oximetry, capnography, central and peripheral temperature) was performed throughout the experiment to maintain deep and stable anaesthesia. Slow increasing trends in heart rate or blood pressure, or more rapid and transient increases in response to noxious stimulation, were taken as evidence of lightening anaesthesia and infusion rates were adjusted accordingly.
Transcranial magnetic stimulation
TMS target sites were marked on the scalp using stereotaxic measurements before removal of the ear and eye bars. Stimulation targets were left and right primary motor cortex (located at A13, ML18, based on our previous experience of recording from M1 in macaques). A small figure-of-eight TMS coil (loop diameter 25 mm) was fixed on the stereotaxic frame using a manipulator for accurate positioning. The coil was angled to be tangential to the scalp surface, approximately 45 deg to the sagittal plane, generating a current in the brain which ran from posteriolateral to anteriomedial. TMS was delivered at 0.2 Hz; blocks of 20 stimuli were delivered per intensity and these were not randomized. Stimulation was performed either ipsilateral or contralateral to the recording site; where recording stability permitted, stimuli were delivered to both sides. Due to the length of the experiment, the coil was prone to overheating and was cooled throughout using frozen gel packs which could be moulded over the coil.
Electrophysiological recordings
Single unit recordings were made with a 16-channel Eckhorn Microdrive (Thomas Recording, Giessen, Germany) loaded with glass-insulated platinum electrodes or tetrodes. Penetrations were made through the window cut into the bone dorsal to the foramen magnum, and angled rostrally 30–40 deg relative to the spinal column. They were targeted towards the PMRF using co-ordinates adapted from stereotaxic atlases of the macaque brain (Smith et al. 1972; Martin & Bowden, 1996) and from the parasagittal templates provided by Sakai et al. (2009). Electrodes were arranged in a 4 × 4 array (0.5 mm inter-electrode spacing). With this configuration, the recording microdrive and amplifiers were located caudal to the skull (above the spinal column, with electrodes heading rostrally through the occiput), while the TMS coil was on the skull's dorsal surface over M1. This ensured that there were no mechanical interactions between the stimulus and recording systems.
In order to stimulate the reticulospinal tract, stimulating electrodes were constructed from short lengths of parylene-insulated stainless steel electrodes (MS501G, Microprobe Inc., Gaithersburg, Maryland, USA) soldered to Teflon-insulated multi-stranded stainless steel wire; the joint was insulated with epoxy resin. The electrode assemblies were made with either 5 mm or 3.5 mm protrusion beyond the epoxy, to target the medial or lateral reticulospinal tract, respectively. Each electrode was inserted by hand into the spinal cord between the C4 and C5 vertebrae, while field potential responses were observed from an electrode placed within the PMRF; the stimulating electrode was fixed with cyanoacrylate glue at the approximate location with the largest short-latency (antidromic) response. Three pairs of such electrodes were inserted (rostral-caudal separation approximately 5 mm), in the midline (targeting the ventromedial funiculi) or around 4 mm lateral (targeting the left or right lateral funiculus).
Stimulation to identify PMRF cells was performed between pairs of spinal electrodes located at the same laterality. In PMRF cells which appeared to respond at fixed latency, a collision test was performed to confirm the antidromic nature of the response. Only cells which had low-jitter responses to spinal stimulation and passed the collision test were classified as reticulospinal neurones (example shown in Fig. 1A). However, it is likely that many other recorded cells were also reticulospinal. In some cases the spinal stimulus might fail to spread to activate the descending axon; in others, even though the cell responded at fixed latency, a low spontaneous firing rate precluded performing a collision test.
Figure 1. Antidromic identification and artefact removal.
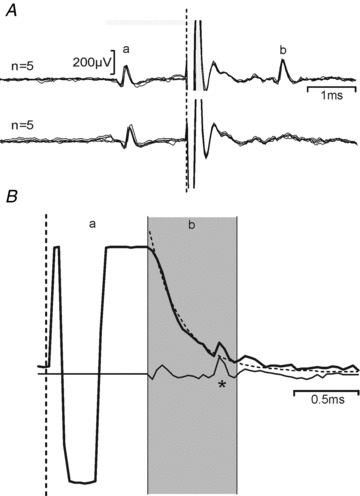
A, example identification of a reticulospinal neurone. Successful collision of a spontaneous spike (a) from a neurone within PMRF with an antidromic spike (b) elicited by spinal cord stimulation at a spike-stimulus interval of 1.3 ms (bottom) but not at 1.4 ms (top). B, example application of the artefact removal algorithm. The unprocessed recording in response to a single stimulus is shown as a thick line. The artefact may be divided into a period where the amplifier has saturated (a), and a subsequent phase where neural activity can be detected on a shifted baseline (b, shaded grey). This baseline was fitted to a double exponential curve (dotted line) and subtracted, yielding the trace shown underneath (thin line) in which a spike may be discerned responding to the stimulus (*). Dashed vertical lines in all panels represent stimulus time.
Spike waveforms were amplified (gain 2–10 k), filtered (bandpass 300 Hz to 10 kHz), and continuously sampled at 25 kHz to a computer hard disc together with stimulus markers.
The stimulus artefact generated in microelectrode recordings following TMS nearby can severely limit the ability to discern neural responses. We found that careful adjustment of the route taken by the power and signal cables running to and from the pre-amplifiers was essential to minimize the artefact; this was carried out at the start of each new penetration, and the cables then carefully fixed in the optimal location. Movement of the cables away from this route by just a few millimetres was often sufficient to lengthen the artefact by tens of milliseconds. A typical raw recording is illustrated in Fig. 1B (thick line). In this trace, two periods of artefact can be discerned. In the early region labelled a, the recording system has saturated, and it is not possible to recover any neural signal. In the later period labelled b, neural activity is clearly visible. However, the slowly changing baseline shift would prevent automated detection of spike waveforms by threshold crossing. To counteract this, we post-processed the recorded data by fitting the later part of the artefact in each sweep by a double exponential function:
where V(t) is the voltage waveform as a function of time t, and Ai, ki and τi are parameters optimized in the fitting process. The fitted waveform (overlain dashed line in Fig. 1B) was then subtracted from the experimentally recorded artefact in the later region. The earlier part of the artefact was blanked (set to zero). This processed waveform is illustrated in Fig. 1B (thin line).
Following this post-processing step, the times of single unit discharges were detected using custom written clustering software (GetSpike, S. N. Baker). Discrimination was subsequently checked using an interactive program which displayed all accepted and rejected waveforms, and allowed the user to modify the classification. Subsequent analysis involved construction of peri-stimulus time histograms (PSTHs). The significance of a response within a given post-stimulus time window was assessed by comparing the number of spikes to those expected given the pre-stimulus (baseline) firing rate, using the Poisson distribution with a criterion of P < 0.005. All analysis code was written in the MATLAB programming environment (The Mathworks, Inc., Natick, MA, USA).
To examine the variation of responses with TMS intensity, we computed three measures. The first used the threshold (lowest intensity at which a response was observed) to compile a cumulative probability curve. This showed the fraction of cells which responded at a given intensity, expressed relative to the number which responded at the highest intensity tested. Secondly, we measured the response magnitude, as the mean number of spikes per stimulus above baseline within a given post-stimulus window. This was averaged across all cells which responded at that intensity; error bars were determined as the standard error of this mean. Finally, we computed the product of these two measures. This can be interpreted as the average response magnitude, including (as zeros) cells which did not respond.
Error bars for this composite measure were computed using the following Monte Carlo resampling method, which took account of the variability in each contributing measure. For a given intensity, suppose that m/M cells were observed to have a threshold less than or equal to this intensity, and that N measures of response amplitude were available, leading to a mean μ. We determined a resampled number of responding cells m′, by drawing at random from a binomial distribution with success probability m/M and number of trials M. The resampled mean response amplitude μ′ was measured by finding the mean of N samples drawn from the N available responses (sampling with replacement). This led to a resampled composite measure computed as m′μ′/M. The procedure was repeated 1000 times; the standard deviation of these 1000 resampled estimates provided an estimate of the standard error of the measurement made from the experimental data mμ/M.
Click stimuli
Click stimuli were delivered using a B71 bone vibrator (Radioear Corporation, New Eagle, Pennsylvania, USA) placed on the scalp over the motor cortex, at the same marked locations used for TMS. As described by Colebatch et al. (1994), stimuli were generated by 0.1 ms square voltage pulses delivered to the bone vibrator by a power amplifier.
It was important to compare the sound output from the bone vibrator with that from the TMS coil. In separate calibration experiments, we placed the bone vibrator on a wooden beam, supported at only one end, and recorded the acceleration at a distance of 38.5 cm using a miniature accelerometer (Isotron 35A, Endevco, San Juan Capistrano, CA, USA) firmly taped to the base. A curve was constructed of the peak acceleration versus the gain setting of the power amplifier. A similar experiment was then carried out to measure the peak acceleration generated by the TMS coil, placed at the same distance from the accelerometer. The separation of accelerometer and TMS coil ensured that the stimulus artefact (occurring simultaneously with the stimulus due to electromagnetic propagation) did not influence measurement of the delayed sound wave. By comparison of these curves, we were able to estimate the TMS intensity (in percentage of maximal stimulator output) which produced the same peak acceleration as the bone vibrator at a given setting of the power amplifier gain. In this paper, we thus report the bone vibrator intensity in terms of the equivalent TMS intensity (eTMS). A 10 V excitation pulse into the B71 (as described by Welgampola et al. 2003) corresponded to 31% eTMS.
Anatomical reconstruction
Following successful penetrations, marker lesions were made by passing current (100 μA for 20 s, electrode negative) through selected electrodes. At the end of the experiment, animals were killed by an overdose of anaesthetic and perfused through the heart with phosphate buffered saline followed by formal saline. The brainstem was removed, and immersed in ascending concentrations of sucrose solution for cryoprotection (final concentration 30%) before being cut on a freezing microtome (50 μm parasagittal slices) and stained with cresyl violet. The location of the marker lesions, together with the noted coordinates of the electrode drive and depth of electrodes during recording, allowed an anatomical reconstruction of the penetrations.
Results
Recordings were made from a total of 210 cells in the PMRF of three macaque monkeys. Many of these cells showed robust responses to TMS over the primary motor cortex, usually involving a stimulus-locked increase in firing rate from 1–30 ms after the stimulus. Example raster plots from three single units are shown in Fig. 2A–C. In each of these plots, the lines of the raster indicate the response to a single stimulus. Responses to different TMS intensities (expressed as a percentage of the stimulator's maximal output, MSO) are shown in the raster sections delineated by horizontal lines.
Figure 2. Individual PMRF cell responses to TMS.
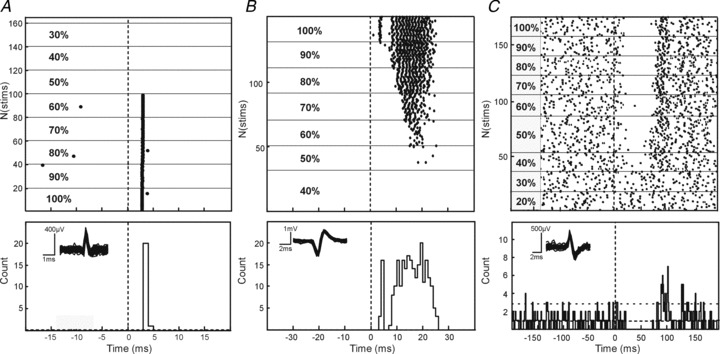
Example raster plots of single cells responding with spikes in the early latency window (A), early and late windows (B) and with suppression of firing following TMS (C). Dotted line denotes stimulus onset. Corresponding peri-stimulus time histograms are shown for each cell during TMS at an intensity of 100% MSO; dashed horizontal lines mark the mean, and mean + 2 SD, of the baseline (pre-stimulus) firing. Overlain waveforms for the discriminated spikes are shown as insets.
For the cell illustrated in Fig. 2A, stimulus intensities up to 50% MSO produced no response. At higher intensities, the PMRF neurone responded in most trials with a single spike at short latency (2.88 ms), yielding a single bin of elevated firing probability in the PSTH.
In addition to an early single-spike response, the cell illustrated in Fig. 2B also showed clear responses starting at intensities of 60% MSO. However, these responses were later (mean onset latency at 60% intensity 17.2 ms), and comprised multiple spikes per sweep (range 1–3 spikes at 60%, mean 1.84). With increasing intensity, the response latency shortened and it grew stronger (latency 8.5 ms, average of 12.5 spikes per sweep at 90% MSO). At the highest intensity tested (100% MSO) an early response appeared, similar to that seen in the cell illustrated in Fig. 2A. This early single spike response coexisted with a powerful later response (Fig. 2B), similar to those seen at lower intensities.
In some cases, PMRF cells responded to TMS with a suppression of firing (example illustrated in Fig. 2C). Since many of the recorded cells had little or no baseline firing, detection of suppression was often impossible (Aertsen & Gerstein, 1985) and its quantification across the population unreliable. Accordingly, we do not present further analysis of these suppressive effects.
In total, 159 cells showed a significant response to TMS regardless of latency; this amounts to 76% of the total population. Figure 3A provides a visual representation of the variety of responses which were observed; each line of this false colour map represents the response of a single neurone, at a single intensity of TMS. Cells which responded at multiple intensities will thus contribute more than one line to this plot. Only cell-intensity combinations which showed a significant response (calculation described in Methods) are illustrated. Responses have been sorted according to the onset latency of the earliest response (first elevated PSTH bin). The distribution of this first response latency is shown in Fig. 3B– once again, cells could contribute multiple counts to this histogram if they responded at multiple intensities.
Figure 3. Population PMRF responses to TMS.
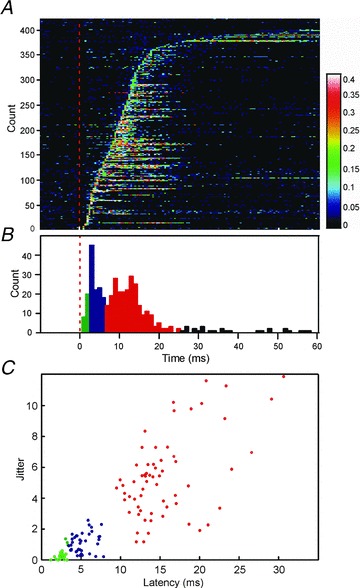
A, plot of response probability for all cells across the population which respond to TMS (n = 159). Each horizontal bar represents a single cell response to a single stimulus intensity; response is indicated using the false colour scale on the right, which gives the probability of firing in a 1 ms bin. The dotted red line denotes stimulus onset. Rows have been sorted by response onset latency. Cells which responded at multiple intensities contribute multiple rows to this figure. B, distribution of onset latency (first elevated PSTH bin post-stimulus), assessed from A. Bins have been colour coded according to the different response latency windows (green, early; blue, middle; red, late). C, scatter plot of response jitter against latency (standard deviation, and mean, of single-trial first-spike latency respectively). Each point in C describes the response from one cell at an intensity 100% MSO; n = 124 cells were used to compile this plot.
Figure 3C provides some quantitative analysis of the response properties; for this panel, only the responses to intensities of 100% MSO have been used. Each response was characterized by its onset latency (measured from the PSTH as the earliest elevated bin, as in Fig. 3B), and jitter (the standard deviation of the time of the first spike occurring at or after this onset latency). The scatter plot of Fig. 3C suggests that responses can be divided into three categories. Those with onsets earlier than 3 ms had very low jitter (all below 1.37 ms; green points in Fig. 3C). At such a short latency, the only plausible pathway is direct input from fast cortico-reticular connections; the low jitter is consistent with a monosynaptic connection. Responses at an intermediate latency (3–7 ms; blue points in Fig. 3C) showed a variety of jitter, suggesting multiple possible pathways.
The third major class of responses occurred at longer latency (7–25 ms, red points in Fig. 3C). These showed a wide range of jitters, all of which exceeded the low jitter seen for the earliest responses, suggesting oligosynaptic mediation.
It is important to note that the analysis of response onset latency and jitter in Fig. 3B and C only considers the first component of a given cell's response. As in the cell illustrated in Fig. 2B, several neurones responded in more than one of these latency windows. This is made clear in the display of Fig. 3A, where several of the rows with early responses also contain later facilitations. Overall, 25%, 28% and 41% of cells showed significantly increased firing (P < 0.005) in the early (1–3 ms), middle (3–7 ms) and late (7–25 ms) latency windows, respectively. In interpreting these proportions, we must express one note of caution. Cells were occasionally lost mid-way through the testing period, so that not all cells were tested at all intensities. Early responses tended to occur with higher thresholds than late responses (see below). This meant that late responses were marginally more likely to be detected than early responses, which may have slightly biased the response percentages.
The intensity of TMS is expressed on an arbitrary scale (%MSO); this reflects the great variety of uncontrolled factors which can alter stimulus efficacy. In human studies, intensity is often expressed relative to the threshold stimulus required to produce a motor evoked potential. In these experiments, we were able to record epidural volleys from electrodes placed on the dorsal surface of the spinal cord (C4/C5 segments); example recordings are shown in Fig. 4A. This allowed us to estimate the threshold stimulus to evoke a corticospinal volley. In the illustrated animal (monkey P), the threshold to produce a D wave volley was 30% MSO. At intensities of 80% MSO and higher, an earlier volley (circled in Fig. 4A) was elicited, probably reflecting activation of the white matter deep to the cortical surface; a similar volley was reported by Edgley et al. (1990) following high intensity electrical stimulation. At intensities of 90% MSO and above, a small I1 wave could be seen. In the other animals, the D wave threshold was 30% MSO (monkey V), and 35% MSO (monkey U). However, it should be noted that this is a conservative estimate of threshold since we did not determine it to the nearest 1% MSO.
Figure 4. Response characteristics.
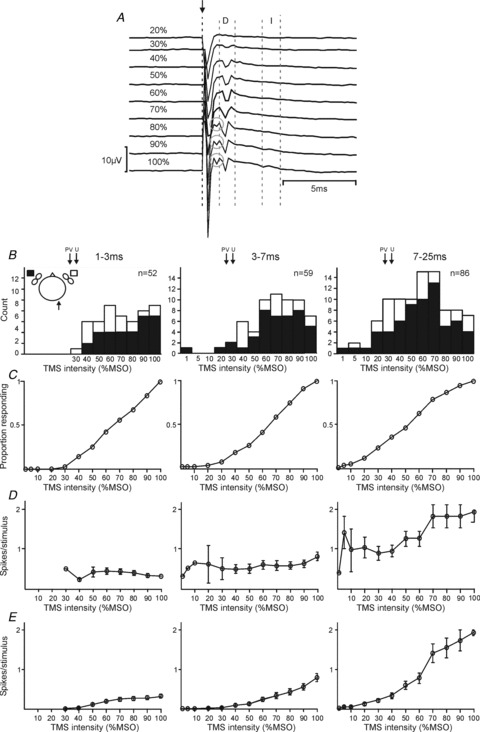
A, spinal epidural recordings following ascending intensities of TMS from monkey P, recorded from a ball electrode on the spinal dura between the C4 and C5 vertebrae. Stimulus onset is marked with a dashed black line and arrow; direct (D) and indirect (I) responses are shown within the dashed grey lines. Grey circles denote an early D response, probably due to white matter activation. B, histograms of response thresholds for responses of 1–3 ms (column 1), 3–7 ms (column 2) and 7–25 ms (column 3) after the stimulus. Black and white shading indicates responses to contralateral and ipsilateral M1 stimulation, respectively (see inset schematic diagram of head, in which recording side is indicated by an arrow). In each plot, n indicates the number of cells responding. Arrows indicate, for comparison, the threshold for a spinal volley in each animal (30% for animal P, 30% for V, and 35% for U). C, cumulative probability distribution of response thresholds for each response window; data from ipsilateral and contralateral responses has been combined for this figure. D, spikes elicited per stimulus for cells which responded to TMS at a given intensity. Error bars designate SEM. E, the product of the plots in C and D. This can be interpreted as the spikes elicited per stimulus averaged across all cells, including (as zeros) those cells which did not respond. Error bars represent SEM, determined by the Monte Carlo resampling procedure described in Methods.
Figure 4B shows the distribution of the threshold intensity required to elicit responses in the PMRF cells. Separate plots describe each latency window. A single cell could contribute to more than one of these plots, if it had a significant response in multiple latency windows. For comparison, the thresholds to generate corticospinal D waves are marked above the histograms by arrows, for the three different animals. The threshold was significantly lower for late responses compared with both early and middle latency responses (P < 0.005; t test), but not significantly different between early and middle latency responses (P > 0.05; t test). The mean thresholds were 71%, 68% and 55% MSO for the early, middle and late latency categories respectively.
In Fig. 4B, responses to stimulation of the contralateral or ipsilateral M1 have been indicated by black or white bars, respectively. Thresholds did not differ between the two sides for either the middle or late windows; however, for early responses, the threshold was significantly lower for responses to ipsilateral stimulation than for contralateral (P < 0.05; unpaired t test). Although we observed more PMRF responses to stimulation of the contralateral than the ipsilateral hemisphere, this reflected a bias in our testing: around twice as many cells were tested with contralateral than ipsilateral stimulation. The proportions of responses to ipsilateral and contralateral stimuli were in fact similar (early: ipsi 20/82 = 24%, contra 32/149 = 21%; middle: ipsi 19/82 = 23%, contra 43/149 = 29%; late: ipsi 29/82 = 35%, contra 64/149 = 43%).
Figure 4C replots the threshold data of Fig. 4B as a cumulative probability distribution; results from ipsilateral and contralateral stimuli have been combined in this plot. This display is useful, as it allows us to read off the proportion of cells which responded to TMS at a given intensity.
Figure 4D presents data on the variation of response magnitude (i.e. the average number of spikes elicited per stimulus) in different latency windows with stimulus intensity. Similar to the single cell illustrated in Fig. 2A, the mean number of spikes elicited at the early latency did not grow with increased intensity (P > 0.3, linear regression of response magnitude on intensity; Fig. 4D). This was not the case for the middle latency, which showed a small but significant increase with intensity (P = 0.047). By contrast, late responses became much stronger on average as the stimulus intensity was increased (P < 0.005). At the highest intensity, the late responses contained on average six times more spikes than the early responses (average of 0.32, 0.81 and 1.92 spikes per stimulus for early, middle and late responses, respectively, at 100% MSO).
Figure 4C and D present complementary information about the responses which we observed; however, neither fully represents how the response of the population of recorded cells changed with stimulus intensity. In order to address this, we calculated the product of Fig. 4C (response probability) with Fig. 4D (response magnitude). This plot is illustrated in Fig. 4E, and represents the mean number of spikes elicited per stimulus, including (as zeros) those cells which did not respond at a given intensity. Such a display clearly indicates the growth of the population response with increasing stimulus intensity.
It was often difficult to identify cells antidromically in this study, since spontaneous firing rates were usually low, making it difficult to perform a collision test. However, a total of eight cells were positively identified as reticulospinal neurones (example in Fig. 1A). Of these cells, one showed an early response, two responded within the late window and one showed both early and late responses.
Figure 5 shows an anatomical reconstruction of the recording sites in this study, drawn on a representative parasagittal section. In each panel, cells which responded within a given latency window are shown in red; cells without a significant response at that post-stimulus time are marked in black. The points outlined in green were identified reticulospinal cells. It is clear that all of the neurones reported were located in the nucleus gigantocellularis of the reticular formation. No difference in the location of cells responding in the different latency windows was apparent.
Figure 5. Anatomical reconstruction of recording sites.
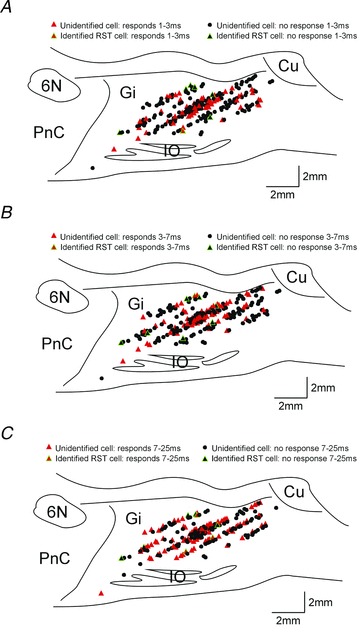
Representative parasagittal sections through the brainstem showing the location of recording sites and cells responding in early (1–3 ms, A), middle (3–7 ms, B) and late (7–26 ms, C) latency windows. Red triangles indicate cells with significant responses; black circles cells with no responses. Symbols outlined in green mark identified RST cells. The location of some symbols have been shifted to allow all recording sites to be seen more clearly without overlap; such shifts for display clarity were always less than 0.5 mm. Gi, gigantocellular reticular nucleus; Cu, cuneate; IO, inferior olive; PnC, caudal pontine reticular nucleus; 6N, abducens nucleus.
We were interested in which pathway might elicit the long latency responses observed. One possibility was that cells responded to cutaneous stimulation of the scalp by the magnetic stimulus. However, in one single unit (illustrated in Fig. 6A) and three multi-unit recordings where responses occurred in the late window, we also tested the effects of electrical stimulation delivered to the skin underlying the TMS coil delivered through two subcutaneous needles (spacing ∼25 mm; current 10 mA). In no case did cells respond to such stimuli.
Figure 6. Evidence on which pathways contribute to PMRF response to TMS.
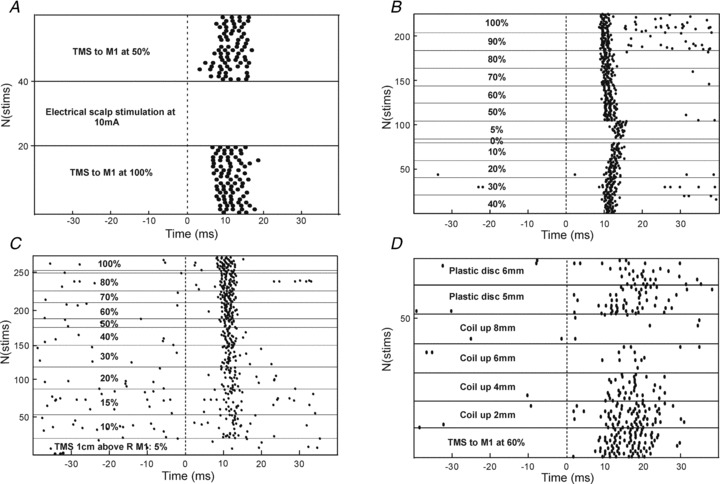
A, a cell which responded strongly to contralateral TMS in the late latency window, but which did not respond to electrical stimulation of the scalp through percutaneous needles inserted beneath the coil (10 mA, 0.2 ms pulse width). B, responses from a single cell during contralateral TMS. Note that the responses persisted even at the lowest non-zero intensity tested of 5% MSO. C, responses from a different cell following contralateral TMS, with the coil positioned 1 cm above the scalp. D, responses following contralateral TMS at 60% MSO, as the coil was raised off the head by the distances indicated. In the final two periods, a plastic disc (6.35 mm thickness) was inserted to fill the gap between the coil and the head, restoring the response in the late window. In all panels, responses are shown as raster displays, with stimulus conditions fixed within the regions denoted by horizontal lines. Dashed vertical line marks time of stimulus.
Several unexpected observations during experiments conceived as controls provided clues to how the late responses might be mediated. Firstly, in some cells late responses could be generated at exceptionally low stimulus intensities. For the cell illustrated using response rasters in Fig. 6B, there was a robust late response even with a stimulus of 5% MSO. For comparison, the threshold to produce a corticospinal D wave in this animal was 30%. As indicated by Fig. 4C, at least 10/86 cells (12%) showed late responses at intensities lower than the corticospinal D wave threshold. There are likely to be more cells showing subthreshold responses, given our conservative identification of spinal volley threshold for each animal. Corticospinal axons are amongst the fastest corticofugal fibres, and their cells of origin are large pyramidal neurones (Phillips & Porter, 1977; Swadlow, 1994). If a stimulus is too weak to excite corticospinal output, it seems unlikely it could activate any cortical efferents.
The cell illustrated in Fig. 6C was even more remarkable. In this case, a response appeared at 10% MSO, and this grew as the intensity of TMS was increased. However, all of the records in this panel were taken with the TMS coil placed 10 mm above the scalp, leaving a visible air gap between the coil and skin. Given the rapid attenuation of the magnetic field with distance, it is hard to believe that TMS under these conditions could excite any neural elements. Fifteen cells within our population responded when the coil was not in contact with the head; four of these had a threshold which was below that for a spinal volley. This is likely to be a conservative estimate since most of our cells were not tested with such low intensities of TMS.
The cell illustrated in Fig. 6D showed a clear late response to TMS over M1 at 60% MSO. As the coil was progressively lifted off the scalp this response reduced, until with an 8 mm air gap between skin and coil the response was abolished. We then inserted a polycarbonate disc between the coil and skin, leaving the distance between coil and head unchanged. Since the permittivity of this plastic is similar to air, the magnetic field experienced by the cortex should have been little changed by this manoeuvre. However, following the insertion of the plastic disc, the neural response in the late window returned.
These observations led us to suspect that the sound of the TMS coil discharging could contribute to the late response. This would explain why responses sometimes persisted at low intensities, even with the coil lifted off the head. It would also explain why changing the mechanical coupling between the coil and head could alter the response: transmission of the sound of the discharge to the skull would be more effective through plastic than through air.
In 12 cells which showed a late response to TMS, we were also able to test the response to sound directly by delivering click stimuli to the scalp through a miniature bone vibrator. Seven cells responded significantly to this stimulus at similar latency as to TMS; an example is shown in Fig. 7, where both the response latency and number of spikes elicited per stimulus were strikingly similar between the two forms of stimulation. In this case, the cell was exquisitely sensitive to sound, responding to the weakest stimulus which produced an audible click (eTMS 7%). By contrast, the cell responded to TMS only at intensities of 50% and higher. We can only speculate on why responses should be seen at lower intensities of sound produced by the bone vibrator than the TMS coil. It is likely that there were differences in the frequency content of the click from the two devices, and also in the surface area in contact with the scalp, and the contact force. Additionally, it is possible that the corticoreticular volley elicited by TMS generated some inhibition of this cell (cf. Fig. 2C), and that a larger sound stimulus was thus required to produce an overt facilitated discharge than with the sound stimulus alone.
Figure 7. Single cell response to TMS and click stimuli.
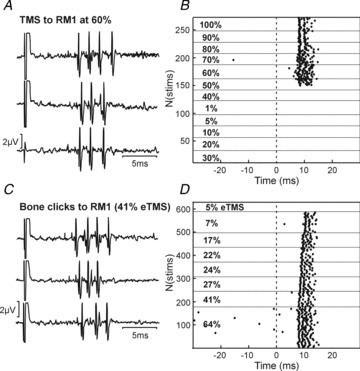
A, raw recordings of responses to TMS stimuli over contralateral motor cortex at 60% MSO. B, raster plots showing how responses varied with TMS intensity. C, single sweep responses from the same cell, following click stimuli delivered through a bone vibrator placed at the same location as the coil in A and B. D, raster plot showing changes in response to clicks at different intensities. Click intensity is expressed as eTMS%, the intensity of TMS which produced comparable sound intensities in separate calibration experiments.
Discussion
This study is the first to measure the responses in the primate ponto-medullary reticular formation to TMS delivered over M1. We find that this stimulus can influence PMRF cells via multiple pathways, which could be distinguished on the basis of response latency, jitter, and threshold intensity. A small number of the recorded PMRF cells were antidromically identified as reticulospinal neurones, although definitive antidromic identification was often prevented by the low spontaneous firing rates in our anaesthetized preparation. However, the remaining unidentified cells were located interspersed with the antidromically identified neurones within the nucleus gigantocellularis, which is known to be a major area of origin of the reticulospinal tract (Sakai et al. 2009). Extracellular recordings have a well-known bias towards large cells (Humphrey & Corrie, 1978); in previous work in the awake cat, ∼39% of recorded PMRF cells could be antidromically identified (Drew et al. 1986). It is highly likely, therefore, that many of the unidentified cells in this study also projected axons to the spinal cord.
Early PMRF responses to TMS
The earliest PMRF response was always a single spike, tightly time locked to the stimulus (mean jitter only 0.32 ms). The only plausible pathway for these responses is the cortico-reticular projection. This system is best characterized in the cat, where two groups of pericruciate neurones projecting to the medial brainstem can be separated on the basis of conduction velocity. The fastest fibres relay M1 activity to reticulospinal neurones with a delay between 1.2 and 2.7 ms; for the slower cortico-reticular population, this lengthens to 2.9–6.8 ms (Pilyavsky & Gokin, 1978). During the experiment reported here, the early responses all had onset latencies shorter than 3.2 ms. Antidromic responses in M1 following stimulation of the medullary pyramids, which are at a similar level of the neuraxis as the PMRF, have comparable latencies in cat and monkey (Evarts, 1965; Takahashi, 1965), so it would be reasonable to expect cortico-reticular delays also to be comparable. Cortico-reticular fibres terminate widely throughout the PMRF, and projections are frequently bilateral (Kuypers, 1958; Kuypers & Lawrence, 1967; Matsuyama & Drew, 1997). Early responses in this study were found both ipsilateral and contralateral to the stimulation site, which is again consistent with mediation by a cortico-reticular pathway.
The middle latency response (3–7 ms onset) was most likely mediated via mixed pathways. For some cells the response jitter was as low as for the early response (Fig. 3C), suggesting monosynaptic mediation. The longer latency could then result from conduction over the slower conducting population of cortico-reticular fibres mentioned above. For other cells, the middle latency response was associated with increased jitter, suggesting an indirect oligosynaptic pathway. This could arise via local circuit interactions within the PMRF. Alternatively, these responses may reflect indirect activation of cortico-reticular axons at the cortical level (I waves), with subsequent monosynaptic activation of the PMRF cell. These possibilities are not mutually exclusive: monosynaptic and disynaptic input from cortico-reticular D and I waves probably occur in all cells, with the relative magnitude in a given cell determining the overt pattern of extracellular spiking which we measured.
Previous work in humans has reported ipsilateral motor evoked potentials (iMEPs) following TMS to M1. These responses are most evident with high background contractions (Alagona et al. 2001) and high stimulation intensity; their amplitude can be modulated by neck position (Ziemann et al. 1999). The latency of iMEPs in the upper limb is 3.5–13 ms later than the presumed corticospinally mediated responses in the homologous contralateral muscle (Wassermann et al. 1994; Ziemann et al. 1999; Alagona et al. 2001; MacKinnon et al. 2004). All of these features are consistent with a brainstem (probably reticulospinal) pathway mediating ipsilateral MEPs. By contrast, the ipsilateral corticospinal tract has little direct impact on motoneurones, both in cat (Edgley et al. 2004) and in monkey (Soteropoulos et al. 2011). In the present study, early PMRF responses occurred with a threshold on average 36–41% MSO higher than that to elicit a corticospinal volley. As well as the extra delay produced by the cortico-reticular synapse, a substantial part of reticulospinal input to motoneurones is disynaptic (Riddle et al. 2009), which would add further extra delay compared with contralateral responses. Our findings are therefore wholly consistent with the idea that ipsilateral MEPs involve a cortico-reticulospinal pathway.
Cortico-reticular projections do not originate solely from M1. In cat, many projecting cell bodies are located in area 6 (Keizer & Kuypers, 1984; Matsuyama & Drew, 1997; Rho et al. 1997). This appears similar in monkey, with inputs from both motor and premotor cortices, including SMA (Keizer & Kuypers, 1989) and F5 (Borra et al. 2010). However, M1 does provide a considerable number of the cortico-reticular fibres –Rho et al. (1997) estimated between 30 and 45% depending on the specific reticular target nucleus. In this study, although the stimulus was delivered over M1, current spread to premotor regions was very likely, especially at the higher intensities used, such that some of the presumed cortico-reticular effects which we observed could have resulted from non-primary motor areas.
Long latency responses to TMS
The origin of the late responses in PMRF to TMS is more difficult to determine. At these onset latencies, there is time for excitation to traverse multiple synapses. The response jitter was considerable (Fig. 3C), which is also consistent with a polysynaptic route. As mentioned above, the PMRF receives projections from non-primary cortical motor areas including cingulate cortex, supplementary motor area and region F5 (Keizer & Kuypers, 1989; Borra et al. 2010), as well as input from subcortical structures as diverse as the cerebellum (Bantli & Bloedel, 1975), cuneate nucleus (Leiras et al. 2010) and pedunculopontine nucleus (Rolland et al. 2011). All of these systems receive input from M1 (Allen & Tsukahara, 1974; Bentivoglio & Rustioni, 1986; Rouiller et al. 1994; Matsumura et al. 2000; Dum & Strick, 2005). Our study cannot provide any information on whether such pathways partially mediate the late responses to TMS seen in PMRF. It should also be noted that our recordings were carried out under anaesthesia, which would most likely depress all but the most direct pathways. These neural circuits may thus assume even greater importance in the awake animal than evident here.
However, several observations suggested that the sound click made by the discharging TMS coil might be important in generating the late responses. In some cells, responses persisted even when the coil was lifted off the head (Fig. 6C). In other cells, improving the mechanical contact between scalp and coil increased the responses (Fig. 6D). They sometimes occurred at TMS intensities below that required to elicit a corticospinal volley (Fig. 4B). Finally, delivery of clicks via a miniature bone vibrator was capable of eliciting similar late responses in some cells as those following TMS (Fig. 7).
PMRF responses to sound have previously been reported in cat at latencies of 10–30 ms (Irvine & Jackson, 1983). In the caudal pontine reticular nucleus (PnC), auditory input plays an important role in the acoustic startle circuit (Davis et al. 1982). Such inputs are transduced by the cochlea. In the present experiments animals were anaesthetized with propofol, which acts mainly on GABAA receptors (Concas et al. 1990) and blocks sodium channels (Rehberg & Duch, 1999). Anaesthesia is known to depress brainstem responses to sound, a phenomenon which finds clinical utility in the monitoring of anaesthetic depth (Thornton, 1991). This suggests that PMRF responses to sound will be even more powerful in an awake animal than under anaesthesia as reported here. However, one limitation of our study was that – due to anaesthesia – the spontaneous firing rate of PMRF units was low. This made it difficult to detect suppression of discharge, although this undoubtedly sometimes occurred (e.g. Fig. 2C). It is thus possible that we missed an extensive inhibition of unit discharge, and that in an awake animal the sound input would have no net effect on PMRF firing, or even result in an overall suppression.
There is an additional possible sensory receptor by which sound can influence the brainstem. Brief clicks at high intensity can activate the vestibular system, predominantly although not exclusively the saccule (Didier & Cazals, 1989; McCue & Guinan, 1994; Murofushi et al. 1995; Zhu et al. 2011). Such clicks can be delivered either through the air, or via bone conduction by the same miniature vibrator as used here. Following the click, evoked responses can be recorded in the muscles of the neck, leg and eye (Rosengren et al. 2010). These vestibular evoked myographic potentials (VEMPs) find clinically utility in the diagnosis of vestibular dysfunction. Since the vestibular nuclei project strongly to the PMRF (Peterson & Abzug, 1975), the mechanism underlying VEMPs could also contribute to the late neural responses which we observed. Although the vestibulospinal tract is usually assumed to mediate VEMPs, our data suggest that there is also probably a reticulospinal contribution. This may be especially so for VEMPs recorded in leg muscles, where the considerable central delay (∼30 ms; Watson & Colebatch, 1998) is consistent with the increased number of interposed synapses entailed by a vestibulo-reticulo-spinal pathway.
It is likely that both cochlear and vestibular receptors contribute to the late responses which we report. In some cells, late responses were seen at low TMS intensities (Fig. 4D). The amplitude of the sound click in these cases was unlikely to be loud enough to produce vestibular activation, which requires a minimum of 75–80 dB (Didier & Cazals, 1989; McCue & Guinan., 1994). The cell illustrated in Fig. 7D responded with an excitation pulse to the B71 bone vibrator of only 0.17 V, generating a sound similar to TMS at 7%. This is likely to be too low to elicit vestibular activation. However, 53/86 cells required a TMS intensity ≥60% MSO to yield a late response. This would be very likely to activate the vestibular system, making some contribution of vestibulo-reticular connections probable.
The present findings may also explain recent results from another group, who reported disruption of saccades following appropriately timed TMS (Xu-Wilson et al. 2011); disruption occurred regardless of the stimulation site, and even with the coil distant from the head. The PMRF is well known to be an important centre in the control of eye movements; it is plausible that the long latency powerful activation of PMRF cells which we report could disrupt saccadic processing.
Possible consequences of reticulospinal volley following TMS over M1
Our findings may also be important for interpreting studies which used paired-pulse TMS delivered to M1. In particular, preceding a supra-threshold TMS test stimulus with a sub-threshold conditioning stimulus at intervals around 10 ms produces a facilitation of the response to the test stimulus in contralateral muscles, a phenomenon referred to as intra-cortical facilitation (ICF; Kujirai et al. 1993). Interestingly, the corticospinal volleys evoked by the test stimulus are not affected by the conditioning stimulus, suggesting that the facilitation may not occur at a cortical level (Di Lazzaro et al. 2006). If the conditioning stimulus evoked a reticulospinal volley, this would raise the excitability of motoneurones (Riddle et al. 2009), and segmental (Riddle & Baker, 2010) and propriospinal interneurones (Lundberg, 1999). This would increase the response to the subsequent (unchanged) input from the corticospinal tract elicited by the test stimulus.
If TMS over M1 generates a reticulospinal volley, this would be expected to influence the firing probability of single motor units. There have been many studies reporting the responses of single motor units to TMS, but these have often not noted a later peak consistent with evoked reticulospinal activity. There may be several explanations for this. Firstly, PMRF neurones were sometimes activated by TMS only at high intensity. Single motor unit studies tend to use relatively weak stimulus intensities, so as to avoid large response contractions which would risk losing the unit. Secondly, we know that reticulospinal EPSPs in motoneurones innervating upper limb motoneurones are only around one-fifth of the amplitude of corticospinal EPSPs (Riddle et al. 2009); any late reticulospinally mediated excitation would thus be hard to detect relative to the earlier corticospinal effects. Finally, TMS often generates a powerful silent period following the initial excitation; late responses would be undetectable during such a period of suppression.
Despite these potential difficulties, several previous studies have reported motor unit responses consistent with the reticulospinal activation described here. Human pectoralis major motor units exhibit an early response peak following TMS over contralateral M1, consistent with corticospinal activation, but there is also a subsequent peak ∼10 ms later. This late peak is seen in isolation following TMS over ipsilateral M1, which would be consistent with mediation through bilaterally projecting reticulospinal axons (MacKinnon et al. 2004). In monkey, Olivier et al. (2001) reported that electrical stimulation of the pyramidal tract produces a brief short-latency facilitation of forelimb motor units, consistent with monosynaptic corticospinal action. However, in some of their illustrated units there is a subsequent broad period of facilitated unit discharge, beginning around 10 ms after the initial response peak (e.g. their Fig. 4A and B). There are multiple other possible explanations for such activity – for example, it could represent rebound firing at the end of corticospinally activated inhibition – but it is also consistent with reticulospinal outflow generated by corticoreticular collaterals of corticospinal axons.
Conclusions
In this study, we have characterized the influence on PMRF cells of TMS over M1. As well as the expected effects from cortico-reticular connections activated by the magnetic field, we have also revealed a powerful later activation, which may be partly mediated by the click made by the discharging coil. We suggest that caution is required when interpreting the results of TMS studies, which may thus cause an unintended widespread activation of the PMRF. Placebo coils, commonly used as a control stimulus, are designed to emit similar clicks as active coils, suggesting that they may exert unintended physiological effects. Finally, activation of the PMRF by TMS and sound clicks may provide a useful tool for non-invasive investigation of this important motor centre in man.
Acknowledgments
This work was supported by the Wellcome Trust and MRC. The authors would like to thank Terri Jackson, Jo Butler and Norman Charlton for technical assistance, Paul Flecknell and Silke Corbach-Soehle for anaesthesia support, and Caroline Fox and Denise Reed for theatre nursing.
Glossary
- eTMS
equivalent transcranial magnetic stimulation intensity
- iMEP
ipsilateral motor evoked potential
- M1
primary motor cortex
- MSO
maximal stimulator output
- PMRF
ponto-medullary reticular formation
- PSTH
peri-stimulus time histogram
- RST
reticulospinal tract
- TMS
transcranial magnetic stimulation
- VEMP
vestibular evoked myogenic potential
Author contributions
All authors contributed to the design and performance of the experiments. KF and SNB analyzed the data. KF wrote the first draft of the paper. All authors contributed to revisions of the paper, and have seen and approved the final version.
References
- Aertsen AMHJ, Gerstein GL. Evaluation of neuronal connectivity: sensitivity of cross correlation. Brain Res. 1985;340:341–354. doi: 10.1016/0006-8993(85)90931-x. [DOI] [PubMed] [Google Scholar]
- Alagona G, Delvaux V, Gerard P, De Pasqua V, Pennisi G, Delwaide PJ, Nicoletti F, Maertens de Noordhout A. Ipsilateral motor responses to focal transcranial magnetic stimulation in healthy subjects and acute-stroke patients. Stroke. 2001;32:1304–1309. doi: 10.1161/01.str.32.6.1304. [DOI] [PubMed] [Google Scholar]
- Allen GI, Tsukahara N. Cerebrocerebellar communication systems. Physiol Rev. 1974;54:975. doi: 10.1152/physrev.1974.54.4.957. [DOI] [PubMed] [Google Scholar]
- Baker SN. The primate reticulospinal tract, hand function and functional recovery. J Physiol. 2011;589:5603–5612. doi: 10.1113/jphysiol.2011.215160. [DOI] [PMC free article] [PubMed] [Google Scholar]
- Bantli H, Bloedel JR. Monosynaptic activation of a direct reticulo-spinal pathway by the dentate nucleus. Pflugers Arch. 1975;357:237–242. doi: 10.1007/BF00585978. [DOI] [PubMed] [Google Scholar]
- Barker AT, Jalinous R, Freeston IL. Non-invasive magnetic stimulation of the human motor cortex. Lancet. 1985;i:1106–1107. doi: 10.1016/s0140-6736(85)92413-4. [DOI] [PubMed] [Google Scholar]
- Bentivoglio M, Rustioni A. Corticospinal neurons with branching axons to the dorsal column nuclei in the monkey. J Comp Neurol. 1986;253:260–276. doi: 10.1002/cne.902530212. [DOI] [PubMed] [Google Scholar]
- Borra E, Belmalih A, Gerbella M, Rozzi S, Luppino G. Projections of the hand field of the macaque ventral premotor area F5 to the brainstem and spinal cord. J Comp Neurol. 2010;518:2570–2591. doi: 10.1002/cne.22353. [DOI] [PubMed] [Google Scholar]
- Colebatch JG, Halmagyi GM, Skuse NF. Myogenic potentials generated by a click-evoked vestibulocollic reflex. J Neurol Neurosurg Psychiatry. 1994;57:190–197. doi: 10.1136/jnnp.57.2.190. [DOI] [PMC free article] [PubMed] [Google Scholar]
- Concas A, Santoro G, Mascia MP, Serra M, Sanna E, Biggio G. The general anesthtic propofol enhances the function of gamma-aminobutyric acid-coupled chloride channel in the rat cerebral cortex. J Neuroch. 1990;55:2135–2138. doi: 10.1111/j.1471-4159.1990.tb05807.x. [DOI] [PubMed] [Google Scholar]
- Davis M, Gendelman DS, Tischler MD, Gendelman PM. A primary acoustic startle circuit: lesion and stimulation studies. J Neurosci. 1982;2:791–805. doi: 10.1523/JNEUROSCI.02-06-00791.1982. [DOI] [PMC free article] [PubMed] [Google Scholar]
- Dewald JP, Pope PS, Given JD, Buchanan TS, Rymer WZ. Abnormal muscle coactivation patterns during isometric torque generation at the elbow and shoulder in hemiparetic subjects. Brain. 1995;118:495–510. doi: 10.1093/brain/118.2.495. [DOI] [PubMed] [Google Scholar]
- Di Lazzaro V, Oliviero A, Profice P, Insola A, Mazzone P, Tonali P, Rothwell JC. Effects of voluntary contraction on descending volleys evoked by transcranial electrical stimulation over the motor cortex hand area in conscious humans. Exp Brain Res. 1999;124:525–528. doi: 10.1007/s002210050649. [DOI] [PubMed] [Google Scholar]
- Di Lazzaro V, Oliviero A, Profice P, Saturno E, Pilato F, Insola A, Mazzone P, Tonali P, Rothwell JC. Comparison of descending volleys evoked by transcranial magnetic and electric stimulation in conscious humans. Electroencephalogr Clin Neurophysiol. 1998;109:397–401. doi: 10.1016/s0924-980x(98)00038-1. [DOI] [PubMed] [Google Scholar]
- Di Lazzaro V, Pilato F, Oliviero A, Dileone M, Saturno E, Mazzone P, Insola A, Profice P, Ranieri F, Capone F, Tonali PA, Rothwell JC. Origin of facilitation of motor-evoked potentials after paired magnetic stimulation: direct recording of epidural activity in conscious humans. J Neurophysiol. 2006;96:1765–1771. doi: 10.1152/jn.00360.2006. [DOI] [PubMed] [Google Scholar]
- Didier A, Cazals Y. Acoustic responses recorded from the saccular bundle on the eighth nerve of the guinea pig. Hear Res. 1989;37:123–127. doi: 10.1016/0378-5955(89)90034-8. [DOI] [PubMed] [Google Scholar]
- Drew T, Dubuc R, Rossignol S. Discharge patterns of reticulospinal and other reticular neurons in chronic, unrestrained cats walking on a treadmill. J Neurophysiol. 1986;55:375–401. doi: 10.1152/jn.1986.55.2.375. [DOI] [PubMed] [Google Scholar]
- Dum RP, Strick PL. Frontal lobe inputs to the digit representations of the motor areas on the lateral surface of the hemisphere. J Neurosci. 2005;25:1375–1386. doi: 10.1523/JNEUROSCI.3902-04.2005. [DOI] [PMC free article] [PubMed] [Google Scholar]
- Edgley SA, Eyre JA, Lemon RN, Miller S. Excitation of the corticospinal tract by electromagnetic and electrical stimulation of the scalp in the macaque monkey. J Physiol. 1990;425:301–320. doi: 10.1113/jphysiol.1990.sp018104. [DOI] [PMC free article] [PubMed] [Google Scholar]
- Edgley SA, Eyre JA, Lemon RN, Miller S. Comparison of activation of corticospinal neurons and spinal motor neurons by magnetic and electrical transcranial stimulation in the lumbosacral cord of the anaesthetized monkey. Brain. 1997;120:839–853. doi: 10.1093/brain/120.5.839. [DOI] [PubMed] [Google Scholar]
- Edgley SA, Jankowska E, Hammar I. Ipsilateral actions of feline corticospinal tract neurons on limb motoneurons. J Neurosci. 2004;24:7804–7813. doi: 10.1523/JNEUROSCI.1941-04.2004. [DOI] [PMC free article] [PubMed] [Google Scholar]
- Evarts EV. Relation of discharge frequency to conduction velocity in pyramidal tract neurons. J Neurophysiol. 1965;28:216–228. doi: 10.1152/jn.1965.28.2.216. [DOI] [PubMed] [Google Scholar]
- Ferbert A, Priori A, Rothwell JC, Day BL, Colebatch JG, Marsden CD. Interhemispheric inhibition of the human motor cortex. J Physiology. 1992;453:525–546. doi: 10.1113/jphysiol.1992.sp019243. [DOI] [PMC free article] [PubMed] [Google Scholar]
- Humphrey DR, Corrie WS. Properties of pyramidal tract neuron system within a functionally defined subregion of primate motor cortex. J Neurophysiol. 1978;41:216–243. doi: 10.1152/jn.1978.41.1.216. [DOI] [PubMed] [Google Scholar]
- Ilmoniemi RJ, Virtanen J, Ruohonen J, Karhu J, Aronen HJ, Naatanen R, Katila T. Neuronal responses to magnetic stimulation reveal cortical reactivity and connectivity. Neuroreport. 1997;8:3537–3540. doi: 10.1097/00001756-199711100-00024. [DOI] [PubMed] [Google Scholar]
- Irvine DR, Jackson GD. Auditory input to neurons in mesencephalic and rostral pontine reticular formation: an electrophysiological and horseradish peroxidase study in the cat. J Neurophysiol. 1983;49:1319–1333. doi: 10.1152/jn.1983.49.6.1319. [DOI] [PubMed] [Google Scholar]
- Kably B, Drew T. Corticoreticular pathways in the cat. I. Projection patterns and collaterization. J Neurophysiol. 1998;80:389–405. doi: 10.1152/jn.1998.80.1.389. [DOI] [PubMed] [Google Scholar]
- Keizer K, Kuypers HG. Distribution of corticospinal neurons with collaterals to lower brain stem reticular formation in cat. Exp Brain Res. 1984;54:107–120. doi: 10.1007/BF00235823. [DOI] [PubMed] [Google Scholar]
- Keizer K, Kuypers HGJM. Distribution of corticospinal neurons with collaterals to the lower brain stem reticular formation in monkey (Macaca fascicularis. Exp Brain Res. 1989;74:311–318. doi: 10.1007/BF00248864. [DOI] [PubMed] [Google Scholar]
- Kujirai T, Caramia MD, Rothwell JC, Day BL, Thompson PD, Ferbert A, Wroe S, Asselman P, Marsden CD. Corticocortical inhibition in human motor cortex. J Physiol. 1993;471:501–519. doi: 10.1113/jphysiol.1993.sp019912. [DOI] [PMC free article] [PubMed] [Google Scholar]
- Kuypers HG. An anatomical analysis of cortico-bulbar connexions to the pons and lower brain stem in the cat. J Anat. 1958;92:198–218. [PMC free article] [PubMed] [Google Scholar]
- Kuypers HG, Lawrence DG. Cortical projections to the red nucleus and the brain stem in the rhesus monkey. Brain Res. 1967;4:151–188. doi: 10.1016/0006-8993(67)90004-2. [DOI] [PubMed] [Google Scholar]
- Leiras R, Velo P, Martin-Cora F, Canedo A. Processing afferent proprioceptive information at the main cuneate nucleus of anesthetized cats. J Neurosci. 2010;30:15383–15399. doi: 10.1523/JNEUROSCI.2193-10.2010. [DOI] [PMC free article] [PubMed] [Google Scholar]
- Lundberg A. Descending control of forelimb movements in the cat. Brain Res Bull. 1999;50:323–324. doi: 10.1016/s0361-9230(99)00151-3. [DOI] [PubMed] [Google Scholar]
- MacKinnon CD, Quartarone A, Rothwell JC. Inter-hemispheric asymmetry of ipsilateral corticofugal projections to proximal muscles in humans. Exp Brain Res. 2004;157:225–233. doi: 10.1007/s00221-004-1836-y. [DOI] [PubMed] [Google Scholar]
- Martin RF, Bowden DM. A stereotaxic template atlas of the macaque brain for digital imaging and quantitative neuroanatomy. Neuroimage. 1996;4:119–150. doi: 10.1006/nimg.1996.0036. [DOI] [PubMed] [Google Scholar]
- Matsumura M, Nambu A, Yamaji Y, Watanabe K, Imai H, Inase M, Tokuno H, Takada M. Organization of somatic motor inputs from the frontal lobe to the pedunculopontine tegmental nucleus in the macaque monkey. Neuroscience. 2000;98:97–110. doi: 10.1016/s0306-4522(00)00099-3. [DOI] [PubMed] [Google Scholar]
- Matsuyama K, Drew T. Organization of the projections from the pericruciate cortex to the pontomedullary brainstem of the cat: a study using the anterograde tracer Phaseolus vulgaris-leucoagglutinin. J Comp Neurol. 1997;389:617–641. doi: 10.1002/(sici)1096-9861(19971229)389:4<617::aid-cne6>3.0.co;2-3. [DOI] [PubMed] [Google Scholar]
- Mazevet D, Meunier S, Pradat-Diehl P, Marchand-Pauvert V, Pierrot-Deseilligny E. Changes in propriospinally mediated excitation of upper limb motoneurons in stroke patients. Brain. 2003;126:988–1000. doi: 10.1093/brain/awg088. [DOI] [PubMed] [Google Scholar]
- McCue MP, Guinan JJ., Jr Acoustically responsive fibers in the vestibular nerve of the cat. J Neurosci. 1994;14:6058–6070. doi: 10.1523/JNEUROSCI.14-10-06058.1994. [DOI] [PMC free article] [PubMed] [Google Scholar]
- Murofushi T, Curthoys IS, Topple AN, Colebatch JG, Halmagyi GM. Responses of guinea pig primary vestibular neurons to clicks. Exp Brain Res. 1995;103:174–178. doi: 10.1007/BF00241975. [DOI] [PubMed] [Google Scholar]
- Olivier E, Baker SN, Nakajima K, Brochier T, Lemon RN. Investigation into non-monosynaptic corticospinal excitation of macaque upper limb single motor units. J Neurophysiol. 2001;86:1573–1586. doi: 10.1152/jn.2001.86.4.1573. [DOI] [PubMed] [Google Scholar]
- Peterson BW, Abzug C. Properties of projections from vestibular nuclei to medial reticular formation in the cat. J Neurophysiol. 1975;38:1421–1435. doi: 10.1152/jn.1975.38.6.1421. [DOI] [PubMed] [Google Scholar]
- Phillips CG, Porter R. Corticospinal neurones: their role in movement. Monogr Physiol Soc. 1977;34:1–450. [PubMed] [Google Scholar]
- Pilyavsky AI, Gokin AP. Investigation of cortico-reticulo-spinal connections in cats. Neuroscience. 1978;3:99–103. [Google Scholar]
- Rehberg B, Duch DS. Suppression of central nervous system sodium channels by propofol. Anesthesiology. 1999;91:512–520. doi: 10.1097/00000542-199908000-00026. [DOI] [PubMed] [Google Scholar]
- Rho MJ, Cabana T, Drew T. Organization of the projections from the pericruciate cortex to the pontomedullary reticular formation of the cat: a quantitative retrograde tracing study. J Comp Neurol. 1997;388:228–249. doi: 10.1002/(sici)1096-9861(19971117)388:2<228::aid-cne4>3.0.co;2-3. [DOI] [PubMed] [Google Scholar]
- Riddle CN, Baker SN. Convergence of pyramidal and medial brain stem descending pathways onto macaque cervical spinal interneurons. J Neurophysiol. 2010;103:2821–2832. doi: 10.1152/jn.00491.2009. [DOI] [PMC free article] [PubMed] [Google Scholar]
- Riddle CN, Edgley SA, Baker SN. Direct and indirect connections with upper limb motoneurons from the primate reticulospinal tract. J Neurosci. 2009;29:4993–4999. doi: 10.1523/JNEUROSCI.3720-08.2009. [DOI] [PMC free article] [PubMed] [Google Scholar]
- Rolland AS, Karachi C, Muriel MP, Hirsch EC, Francois C. Internal pallidum and substantia nigra control different parts of the mesopontine reticular formation in primate. Mov Disord. 2011;26:1648–1656. doi: 10.1002/mds.23705. [DOI] [PubMed] [Google Scholar]
- Rosengren SM, Welgampola MS, Colebatch JG. Vestibular evoked myogenic potentials: past, present and future. Clin Neurophysiol. 2010;121:636–651. doi: 10.1016/j.clinph.2009.10.016. [DOI] [PubMed] [Google Scholar]
- Rouiller EM, Babalian A, Kazennikov O, Moret V, Yu XH, Wiesendanger M. Transcallosal connections of the distal forelimb representations of the primary and supplementary motor cortical areas in macaque monkeys. Exp Brain Res. 1994;102:227–243. doi: 10.1007/BF00227511. [DOI] [PubMed] [Google Scholar]
- Sakai ST, Davidson AG, Buford JA. Reticulospinal neurons in the pontomedullary reticular formation of the monkey (Macaca fascicularis. Neuroscience. 2009;163:1158–1170. doi: 10.1016/j.neuroscience.2009.07.036. [DOI] [PMC free article] [PubMed] [Google Scholar]
- Siebner H, Peller M, Bartenstein P, Willoch F, Rossmeier C, Schwaiger M, Conrad B. Activation of frontal premotor areas during suprathreshold transcranial magnetic stimulation of the left primary sensorimotor cortex: a glucose metabolic PET study. Hum Brain Mapp. 2001;12:157–167. doi: 10.1002/1097-0193(200103)12:3<157::AID-HBM1012>3.0.CO;2-V. [DOI] [PMC free article] [PubMed] [Google Scholar]
- Smith OA, Kastella KG, Randall DC. A stereotaxic atlas of the brainstem for Macaca mulatta in the sitting position. J Comp Neurol. 1972;145:1–23. doi: 10.1002/cne.901450102. [DOI] [PubMed] [Google Scholar]
- Soteropoulos DS, Edgley SA, Baker SN. Lack of evidence for direct corticospinal contributions to control of the ipsilateral forelimb in monkey. J Neurosci. 2011;31:11208–11219. doi: 10.1523/JNEUROSCI.0257-11.2011. [DOI] [PMC free article] [PubMed] [Google Scholar]
- Strafella AP, Paus T, Barrett J, Dagher A. Repetitive transcranial magnetic stimulation of the human prefrontal cortex induces dopamine release in the caudate nucleus. J Neurosci. 2001;21:RC157. doi: 10.1523/JNEUROSCI.21-15-j0003.2001. [DOI] [PMC free article] [PubMed] [Google Scholar]
- Swadlow HA. Efferent neurons and suspected interneurons in motor cortex of the awake rabbit: axonal properties, sensory receptive fields, and subthreshold synaptic inputs. J Neurophysiol. 1994;71:437–453. doi: 10.1152/jn.1994.71.2.437. [DOI] [PubMed] [Google Scholar]
- Takahashi K. Slow and fast groups of pyramidal tract cells and their respective membrane properties. J Neurophysiol. 1965;28:908–924. doi: 10.1152/jn.1965.28.5.908. [DOI] [PubMed] [Google Scholar]
- Thornton C. Evoked potentials in anaesthesia. Eur J Anaesthesiol. 1991;8:89–107. [PubMed] [Google Scholar]
- Wassermann EM, Pascual-Leone A, Hallett M. Cortical motor representation of the ipsilateral hand and arm. Exp Brain Res. 1994;100:121–132. doi: 10.1007/BF00227284. [DOI] [PubMed] [Google Scholar]
- Watson SR, Colebatch JG. Vestibular-evoked electromyographic responses in soleus: a comparison between click and galvanic stimulation. Exp Brain Res. 1998;119:504–510. doi: 10.1007/s002210050366. [DOI] [PubMed] [Google Scholar]
- Welgampola MS, Rosengren SM, Halmagyi GM, Colebatch JG. Vestibular activation by bone conducted sound. J Neurol Neurosurg Psychiatry. 2003;74:771–778. doi: 10.1136/jnnp.74.6.771. [DOI] [PMC free article] [PubMed] [Google Scholar]
- Xu-Wilson M, Tian J, Shadmehr R, Zee DS. TMS perturbs saccade trajectories and unmasks an internal feedback controller for saccades. J Neurosci. 2011;31:11537–11546. doi: 10.1523/JNEUROSCI.1584-11.2011. [DOI] [PMC free article] [PubMed] [Google Scholar]
- Zaaimi B, Edgley SA, Soteropoulos DS, Baker SN. Changes in descending motor pathway connectivity following recovery from corticospinal tract lesions in macaque monkeys. Brain. 2012 doi: 10.1093/brain/aws115. (in press) [DOI] [PMC free article] [PubMed] [Google Scholar]
- Zhu H, Tang X, Wei W, Mustain W, Xu Y, Zhou W. Click-evoked responses in vestibular afferents in rats. J Neurophysiol. 2011;106:754–763. doi: 10.1152/jn.00003.2011. [DOI] [PubMed] [Google Scholar]
- Ziemann U, Ishii K, Borgheresi A, Yaseen Z, Battaglia F, Hallett M, Cincotta M, Wassermann EM. Dissociation of the pathways mediating ipsilateral and contralateral motor-evoked potentials in human hand and arm muscles. J Physiol. 1999;518:895–906. doi: 10.1111/j.1469-7793.1999.0895p.x. [DOI] [PMC free article] [PubMed] [Google Scholar]