Background: Corneal dystrophies are linked to aggregation of mutants of transforming growth factor β-induced Protein (TGFBIp) leading to blindness.
Results: Depending on concentration, the fourth fasciclin-1 domain carrying the A546T substitution follows different fibrillation pathways involving different oligomeric intermediates.
Conclusion: Aggregate species forming under different conditions have different biochemical properties.
Significance: Understanding the molecular events causing aggregation is crucial for development of possible drugs.
Keywords: Aggregation, Amyloid, Cell Permeabilization, Cornea, Protein Stability, Oligomeric Intermediate
Abstract
Mutations in the transforming growth factor β-induced protein (TGFBIp) are linked to the development of corneal dystrophies in which abnormal protein deposition in the cornea leads to a loss of corneal transparency and ultimately blindness. Different mutations give rise to phenotypically distinct corneal dystrophies. Most mutations are located in the fourth fasciclin-1 domain (FAS1–4). The amino acid substitution A546T in the FAS1–4 domain is linked to the development of lattice corneal dystrophy with amyloid deposits in the superficial and deep stroma, classifying it as an amyloid disease. Here we provide a detailed description of the fibrillation of the isolated FAS1–4 domain carrying the A546T substitution. The A546T substitution leads to a significant destabilization of FAS1–4 and induces a partially folded structure with increased surface exposure of hydrophobic patches. The mutation also leads to two distinct fibril morphologies. Long straight fibrils composed of pure β-sheet structure are formed at lower concentrations, whereas short and curly fibrils containing a mixture of α-helical and β-sheet structures are formed at higher concentrations. The formation of short and curly fibrils is preceded by the formation of a small number of oligomeric species with high membrane permeabilization potential and rapid fibril formation. The long straight fibrils are formed more slowly and through progressively bigger oligomers that lose their membrane permeabilization potential as fibrillation proceeds beyond the lag phase. These different fibril classes and associated biochemical differences may lead to different clinical symptoms associated with the mutation.
Introduction
Transforming growth factor β induced protein (TGFBIp)2 is an extracellular protein of 72 kDa (1) expressed in the cornea with no post-translational modifications (2, 3). It is purified from mammalian cells as a monomer although it can form higher order structures such as dimers and trimers in vitro (4). Numerous links have been made between corneal dystrophies and TGFBIp through protein and genetic analyses (5–8). TGFBIp has an N-terminal cysteine-rich region, four consecutive fasciclin-1 (FAS1) domains, and an integrin-binding motif, RGD, near the C terminus (1). The four FAS1 domains are homologous to each other and to fasciclin-1 from Drosophila (9), whose crystal structure contains seven β-strands and five α-helices (10).
TGFBIp-associated dystrophies affect various layers of the cornea, causing visual impairment (11, 12). TGFBIp-linked dystrophies are inherited in an autosomally dominant manner and are phenotypically heterogeneous (11, 13, 14). More than 30 different mutations in TGFBIp resulting in corneal dystrophies have been identified. Prominent among these are two mutational hotspots, namely Arg-124 and Arg-555 (7, 15). Mutations in these two locations comprise ∼50% of all TGFBIp-linked corneal dystrophies despite large geographical variations in their prevalence (16–18). The remaining mutations causing TGFBIp-linked corneal dystrophy are all in the fourth FAS1 domain (FAS1–4) (7). The stability of full-length TGFBIp is mirrored by FAS1–4; destabilizing mutations in FAS1–4 destabilize the full-length protein to a comparable degree (19). Thus, FAS1–4 can be considered a good model system for full-length TGFBIp.
TGFBIp is the major part of the protein inclusions found in the cornea, and abnormal protein turnover of the protein is associated with various mutations (20, 21). However, no deposits of TGFBIp aggregates have been observed elsewhere in the human body. This has been suggested to be linked to the slow turnover of proteins in the cornea due to a lack of blood vessels (22). Furthermore, a C-terminal fragment of TGFBIp derived from FAS1–4 has been found to accumulate in amyloids of the mutant V624M, forming lattice-type deposits in the cornea (23). The molecular events leading to protein aggregation and accumulation involved in corneal dystrophy are still unclear.
The large variety of mutations in TGFBIp leading to different forms of corneal dystrophies indicates that TGFBIp may aggregate in a number of different ways. To probe this aggregate variability in more detail, we present a biophysical analysis of the aggregation of the FAS1–4 domain containing the naturally occurring disease-promoting amino acid substitution A546T. This mutation results in lattice corneal dystrophy with amyloid deposits in the superficial and deep stroma and has an age of onset of 35–40 years (24). We show that the A546T substitution, already known to destabilize FAS1–4 (19), leads to an increase in surface exposure of hydrophobic patches. The mutation also leads to the formation of two distinct fibril morphologies, namely long straight fibrils with pure β-sheet structure (formed at lower concentrations) and short and curly fibrils with a mixture of α-helical and β-sheet structures (formed at higher concentrations). Different oligomeric intermediates displaying different membrane permeabilization potential accumulate during the two distinct fibrillation pathways. We suggest the different oligomeric states found under the two different conditions give rise to the different fibril types. The complexity of the aggregation process induced by a single mutation provides a good indication that TGFBIp has access to a number of different aggregation pathways.
EXPERIMENTAL PROCEDURES
Materials
All chemicals were purchased from Sigma.
Cloning and Expression of FAS1–4 A546T
This work is part of our ongoing efforts to find optimal conditions for preparation of homogeneous fibrils for solid-state NMR elucidation of the molecular structure of these fibrils. Consequently, all fibrillation work in this study was carried out on 13C- and 15N-labeled FAS1–4 A546T. For chemical and thermal stability studies and the analysis of trypsin proteolysis, we used non-labeled FAS1–4 WT as a reference. Non-labeled FAS1–4 A546T was included as a control for the possible effect of using labeled protein instead of non-labeled protein.
A546T FAS1–4 (residues 502–657) was cloned into a pET SUMO expression vector as described previously (19). Escherichia coli BL21(DE3) cells were transformed with SUMO-FAS1–4 A546T plasmid (residue 502–657) plated on LB/kanamycin agar and left at 37 °C overnight. 2 ml of LB/kanamycin was inoculated with one colony and incubated overnight. The overnight culture was once again plated out and left at 37 °C overnight. One colony from this plate was used for protein expression in a fermenter after a pilot expression confirmed the expected size and sequence of the protein. 13C,15N-Labeled FAS1–4 A546T was expressed in a fermenter (type C 10–3, from B. Braun Biotech, Mesungen, Germany) in 8 liters of M9 medium using the same BL21(DE3) clone as described above. Protein expression was induced using 1 mm isopropyl 1-thio-β-d-galactopyranoside at which point M9 medium with d-[13C6]glucose and [15N]NH4Cl as carbon and nitrogen sources, respectively, was added. Protein expression was allowed to proceed for 10 h, after which cells were harvested by centrifugation.
Purification of FAS1–4 A546T
Frozen bacterial pellets from fermenter expression (batches of 10–20 g) were resuspended in 500 mm NaCl, 50 mm Tris-HCl, pH 7.6 (buffer A), sonicated for 6 × 30 s while on ice, and centrifuged for 10 min at 10,000 × g. The supernatant was then applied to a nickel column (5 ml HiTrap Chelating HP, GE Healthcare) pre-equilibrated with buffer A at 1–2 ml/min. The column was then washed with 3 column volumes of buffer A and attached to an Äkta Purifier (GE Healthcare), and bound protein was eluted with imidazole using a stepwise gradient of 500 mm NaCl, 200 mm imidazole, and 50 mm Tris-HCl, pH 7.6 (buffer B). Fractions containing SUMO-FAS1–4 fusion protein were pooled and dialyzed against 100 mm NaCl, 50 mm Tris-HCl, pH 7.6, before the fusion protein was cleaved by incubation for 24 h at 16 °C with 2 units/ml SUMO protease. After the cleaved protein was dialyzed against 2 × 5 liters of phosphate-buffered saline at 4 °C, the pure FAS1–4 A546T product was obtained as the flow-through from a nickel-nitrilotriacetic acid column. Finally, the purified protein was concentrated (YM CentriPrep, molecular weight cutoff 3 kDa) to a stock of 1.5 mg/ml.
Fibrillation Assay
The protein was fibrillated in 20 mm phosphate buffer, pH 7.4, 20 mm NaCl at 0.4, 0.8, and 1.2 mg/ml protein. Additional NaCl or heparin was added to different concentrations. Thioflavin T (ThT) was added to the protein solution to a final concentration of 40 μm, and the protein solution was transferred to a 96-well black Costar polystyrene microtiter plate, sealed to prevent evaporation, and placed in an Infinite M200 plate reader (Tecan Nordic AB). When fibril seeds were present, these were added immediately before the plate was sealed. Seeds of preformed fibrils were produced by sonication for 10 s at 30% amplitude with a Bandelin Sonopuls HD 2070 sonication probe (Buch & Holm). The plate was incubated at 37 °C, and the ThT fluorescence (excitation 450 nm, emission 482 nm) was measured every 5 min with 3 min of shaking between each reading.
Protein Concentration Analysis
The concentration of FAS1–4 A546T in the supernatant after fibrillation and centrifugation for 30 min at 13,000 rpm in a table top centrifuge was analyzed using a Bradford reagent kit (Sigma) with a standard curve of bovine serum albumin according to the manufacturer's recommendations.
Trypsin Digestion
0.4 mg/ml protein was incubated with 1, 0.1, 0.01, 0.001, and 0% trypsin (w/w %) for 30 min at 37 °C and then analyzed by reducing 15% SDS-PAGE. After Coomassie staining and destaining, the gel was scanned, and the intensities of the bands were determined using the software ImageJ.
1-Anilinonapthalene-8-sulfonate (ANS) Fluorescence
0.17 mg/ml FAS1–4 was mixed with 10 μm ANS, and the fluorescence emission was measured from 400 to 600 nm with excitation at 365 nm, slit widths of 10 nm, and a scan speed of 200 nm/min on an LS55 luminescence spectrophotometer (PerkinElmer Life Sciences). Three spectra were accumulated and averaged for each sample.
Far-UV Circular Dichroism (CD) Spectroscopy
Fibril samples were sonicated for 2 s at 60% amplitude with a Bandelin probe before analysis to minimize light scattering (25, 26). CD wavelength spectra from 250 to 200 nm with a step size of 0.2 nm, bandwidth of 2 nm, and scan speed of 50 nm/min were recorded at 25 °C with a J-810 CD-spectrometer (Jasco) using a 1-mm quartz cuvette (Hellma). Five spectra were averaged for each sample, and the buffer spectra were subtracted. CD thermal scans from 20 to 95 °C with a step size of 0.2 °C, bandwidth of 2 nm, and scan speed of 90 °C/h were recorded, and 3 scans were averaged for each sample. The obtained data points were fitted as described previously (27) using the software KaleidaGraph.
Fourier Transform Infrared (FTIR) Spectroscopy
FTIR spectroscopy was performed using a Tensor27 FTIR spectrometer (Bruker) equipped with attenuated total reflection accessory with a continuous flow of N2 gas. All samples were dried with N2 gas. 64 interferograms were accumulated at a spectral resolution of 2 cm−1. Peak positions were assigned where the second order derivative had local minima, and the intensity was modeled by Gaussian curve fitting using the OPUS 5.5 software.
Chemical Denaturation
0.17 mg/ml FAS1–4 A546T was mixed with various concentrations of urea and allowed to equilibrate for at least 2 h. A far-UV CD spectrum was acquired, and the data were fitted as described (27) using KaleidaGraph 4.0 (GeoMEM Consultants).
Transmission Electron Microscopy (TEM)
Aliquots of 5 μl of fibril solution were mounted on 400-mesh carbon-coated, glow-discharged nickel grids for 30 s. The grids were washed with one drop of double distilled water and stained with three drops of 1% phosphotungstic acid, pH 7.2. Samples were inspected in a JEOL 1010 transmission electron microscope at 60 keV. Images were obtained using an electron sensitive Olympus KeenView CCD camera.
Asymmetrical Flow Field-flow Fractionation (AF4)
The development of individual aggregation species during the course of FAS1–4 A546T fibrillations at 0.4 and 1.2 mg/ml was monitored using a Postnova AF2000 asymmetrical AF4 system (Postnova Analytics GmbH) consisting of two HPLC pumps, a AF2000 focus and separation unit equipped with a 10-kDa molecular weight cutoff ultrafiltration membrane, and a 350-μm spacer defining the trapezoidal shape of the separation channel, a S3240 UV-visible detector set at a wave length of 205 nm, and a PN3140 refractive index detector.
Samples were centrifuged at 13,000 × g for 5 min before analysis to remove insoluble material. 60 μg of FAS1–4 (50 μl of 1.2 mg/ml or 150 μl of 0.4 mg/ml) was injected using a glass syringe into an appropriate sample loop mounted in a Rheodyne injection port. The sample was injected and separated in 20 mm phosphate buffer, pH 7.4, 20 mm NaCl using the following flow program modified from Lorenzen et al. (28). A constant detector/outlet flow of 0.5 ml/min was maintained throughout the separation: 1) sample loading using an injection/tip flow of 0.2 ml/min, cross-flow of 2.5 ml/min, and focus flow of 2.8 ml/min; 2) a 1-min linear gradient to 3 ml/min tip-flow and 2.5 ml/min cross-flow (initiation of elution); 3) isocratic elution of low Mr species (e.g. FAS1–4 monomer, dimer, and trimer) at 3 ml/min tip-flow and 2.5 ml/min cross-flow; 4) a 25-min linear cross-flow gradient to 0.25 ml/min; 5) a 15-min linear cross-flow gradient to 0 ml/min (field release; no separation); 6) a 10-min washing/rinsing step at 0 ml/min cross-flow.
The concentration of eluting species was monitored by absorbance at 205 nm because of the low content of aromatic residues in FAS1–4 (precluding the use of absorption at 280 nm) and artifacts from the refractive index signals generated when applying the cross-flow gradients.
The correlation between the retention time and the apparent molecular weight was approximated based on a calibration curve made with ribonuclease A (13.7 kDa), carbonic anhydrase (29/58 kDa), aldolase (158 kDa), and thyroglobulin (669/1338 kDa) (all from GE Healthcare gel filtration low and high molecular weight calibration kits) by plotting the retention time against the molecular weight.
Calcein Release Assay
Calcein vesicles were prepared by dissolving 5 mg/ml lipids of either 100% 1,2-dioleoyl-sn-[phosphor-rac-(1-glycerol)] (DOPG), 100% 1,2-dioleoyl-sn-glycero-3-phospho-choline (DOPC), or 50% DOPG:50% DOPC in chloroform. Chloroform was evaporated, and the lipids were dissolved in 70 μm calcein, 20 mm NaPi, pH 7.4, and 20 mm NaCl. The lipids were flash-frozen in liquid nitrogen and thawed to produce unilamellar vesicles. The lipid vesicles were extruded through a 100-μm filter (Avanti Polar Lipids) to ensure a uniform size of the vesicles. 600 μl of calcein vesicles were eluted with 1.5 ml 20 mm NaPi, pH 7.4, and 20 mm NaCl from a PD10 desalting column equilibrated in 20 mm NaPi, pH 7.4, 20 mm NaCl.
Samples removed from fibrillating FAS1–4 A546T at 1.2 and 0.4 mg/ml 0.001% heparin were centrifuged at 13,000 × g in a tabletop centrifuge. The supernatant was removed, and the sample was diluted to 0.02 mg/ml protein by the addition of 20 mm NaPi, pH 7.4, 20 mm NaCl. Nine additional steps of 2-fold dilutions were prepared. 150 μl of each dilution was transferred to a 96-well black Costar polystyrene microtiter plate. The plate was placed in an Infinite M200 plate reader at 37 °C. The fluorescence with excitation at 485 nm and emission at 520 nm was measured with 5 s of shaking between each read. After 10 min the plate was removed, and 2 μl of 5 mg/ml lipid calcein vesicles were added. The plate was placed in the Infinite M200 plate reader at 37 °C. Fluorescence emission intensity (excitation at 485 nm and emission at 520 nm) was recorded with 5 s of shaking between each read. After ∼1 h, the plate was removed, and 2 μl of 2% Triton X-100 was added to each well to allow complete lysis of vesicles followed by emission recording as above.
RESULTS
FAS1–4 A546T Is Less Stable and More Flexible Than FAS1–4 WT
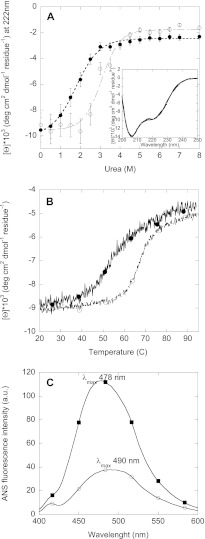
We initially compared the stability of the non-fibrillated FAS1–4 A546T relative to FAS1–4 WT by monitoring chemical and thermal unfolding by CD spectroscopy. This was done by following the changes in the intensity at 222 nm as a function of either chemical denaturant concentration or temperature. FAS1–4 A546T was less stable than FAS1–4 WT both with regard to chemical and thermal denaturation (Fig. 1, A and B). Melting temperatures (Tm) were 52.3 °C for FAS1–4 A546T versus 66.8 °C for WT, whereas the midpoints of denaturation ([urea]50%) were 1.78 and 3.07 m urea for A546T and WT, respectively (Table 1). The free energy of unfolding (ΔGD-N) of A546T are less than half that of WT, consistent with results previously obtained for unlabeled FAS1–4 mutants (19). Thus, as expected, isotopic labeling of FAS1–4 does not change protein stability. The α-helical and β-sheet contributions to the secondary structure of FAS1–4 WT and A546T were estimated by spectral deconvolution of the far-UV CD spectra (Fig. 1A, inset) using the K2d algorithm (29). The β-sheet content of both FAS1–4 WT and A546T was estimated to be 16%, whereas the α-helical contribution was estimated to be 28% for WT and 27% for A546T. This distribution correlates with what has previously been reported for Fas1–4 (10). We conclude that the labeling and the amino acid substitution do not change the structure of the monomeric protein (19).
FIGURE 1.
Chemical and thermal denaturation of FAS1–4 A546T (■) and WT (○). A, shown is urea unfolding of FAS1–4 A546T monitored by the change in the CD signal at 222 nm versus urea concentration. Inset, CD spectra of FAS1–4 A546T and WT at 0 m urea are shown. Error bars are based on duplicates. B, thermal denaturation of FAS1–4 A546T and WT monitored by the change in the CD signal at 222 nm as a function of temperature is shown. C, shown is ANS fluorescence of FAS1–4 A546T and FAS1–4 WT with the λmax indicated in the graph. a.u., arbitrary units.
TABLE 1.
Thermodynamic stability data for FAS1–4 A546T and FAS1–4 WT
All data were analyzed as in Mogensen et al. (27) using KaleidaGraph.
| Mutant | Tma | Tm with ANSa | [den]50%b | mD-Nc | ΔGD-Nd |
|---|---|---|---|---|---|
| °C | °C | m | kcal/mol | ||
| A546T | 52.26 ± 0.26 | 51.59 ± 0.84 | 1.78 ± 0.06 | 1.68 ± 0.12 | 3.99 ± 0.32 |
| WT | 66.75 ± 0.19 | 6.93 ± 0.05 | 3.07 ± 0.10 | 2.19 ± 0.41 | 8.98 ± 1.73 |
a Melting temperature determined by far-UV CD thermal scans.
b Midpoint of chemical denaturation monitored by far-UV CD spectroscopy.
c Dependence of the log of the equilibrium constant of unfolding on urea concentration.
d Free energy of unfolding.
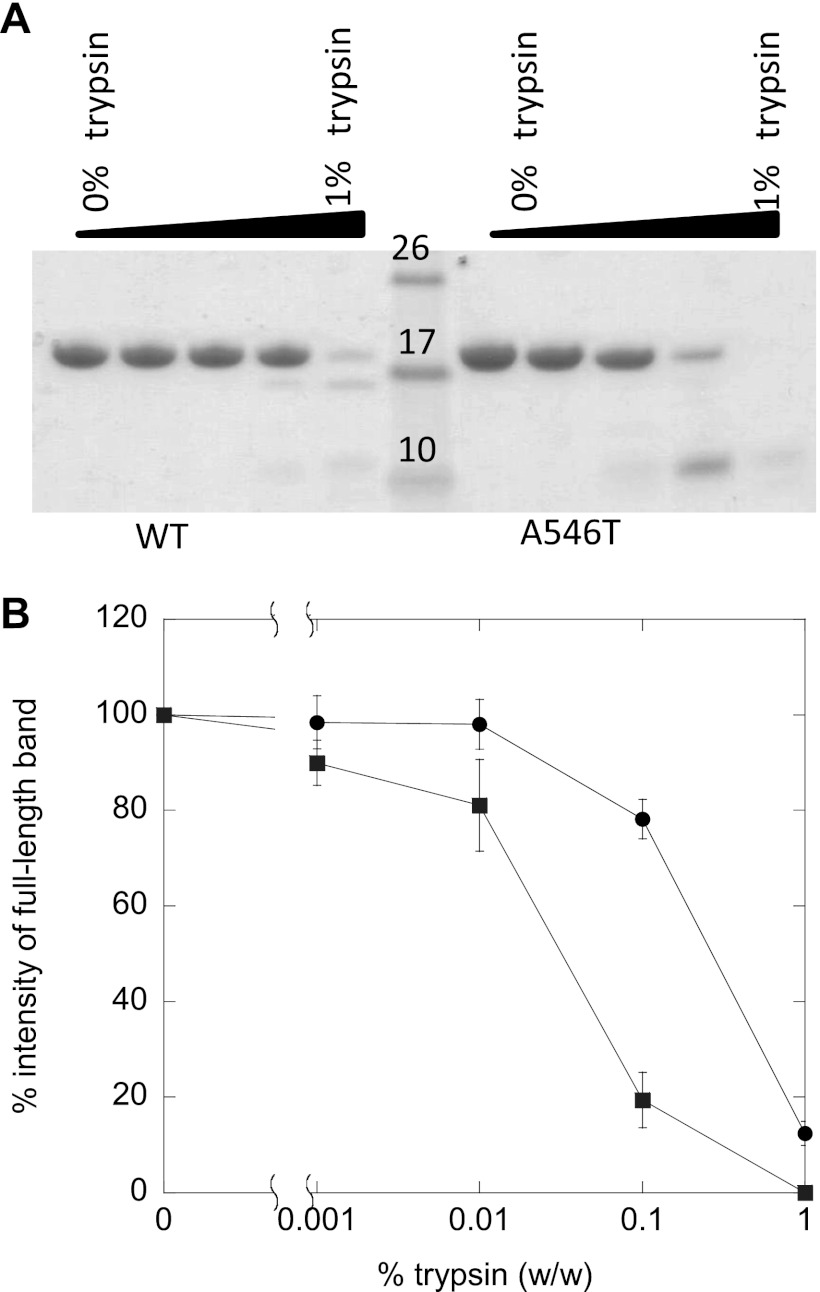
Next we used the fluorescent probe ANS to examine whether FAS1–4 A546T forms a partially unfolded state. The quantum yield and the wavelength of maximum fluorescence emission of ANS depend upon the polarity of the environment. In aqueous solutions ANS displays a low quantum yield that upon binding to assessable hydrophobic patches on protein surfaces increases dramatically accompanied by a blue-shift of the peak wavelength (λmax) (30, 31). At identical protein concentrations, the fluorescence intensity of ANS in the presence of FAS1–4 A546T was considerably higher than with WT. Furthermore, the λmax of ANS in the presence of FAS1–4 A546T was blue-shifted to 478 nm as compared with 490 nm for FAS1–4 WT. This indicates that ANS binds to hydrophobic patches on FAS1–4 A546T not present on FAS1–4 WT under the same conditions (Fig. 1C), suggesting that FAS1–4 A546T may be partially unfolded. The increased flexibility of A546T compared with WT is confirmed by limited trypsin digestion. A546T is digested to a greater extent than WT at all concentrations of trypsin (w/w) (Fig. 2).
FIGURE 2.
Trypsin digestion of FAS1–4 WT and FAS1–4 A546T. A, shown is a SDS-PAGE gel of FAS1–4 WT and FAS1–4 A546T incubated with 1, 0.1, 0.01, 0.001, and 0% of trypsin (w/w). B, shown are the relative intensities of the band on SDS-PAGE after trypsin digestion of FAS1–4 A546T (■) and FAS1–4 WT (○). The intensities of the band on the SDS-PAGE gel were determined using the software ImageJ (National Institutes of Health).
FAS1–4 Fibrillation Is Promoted by the Presence of Heparin
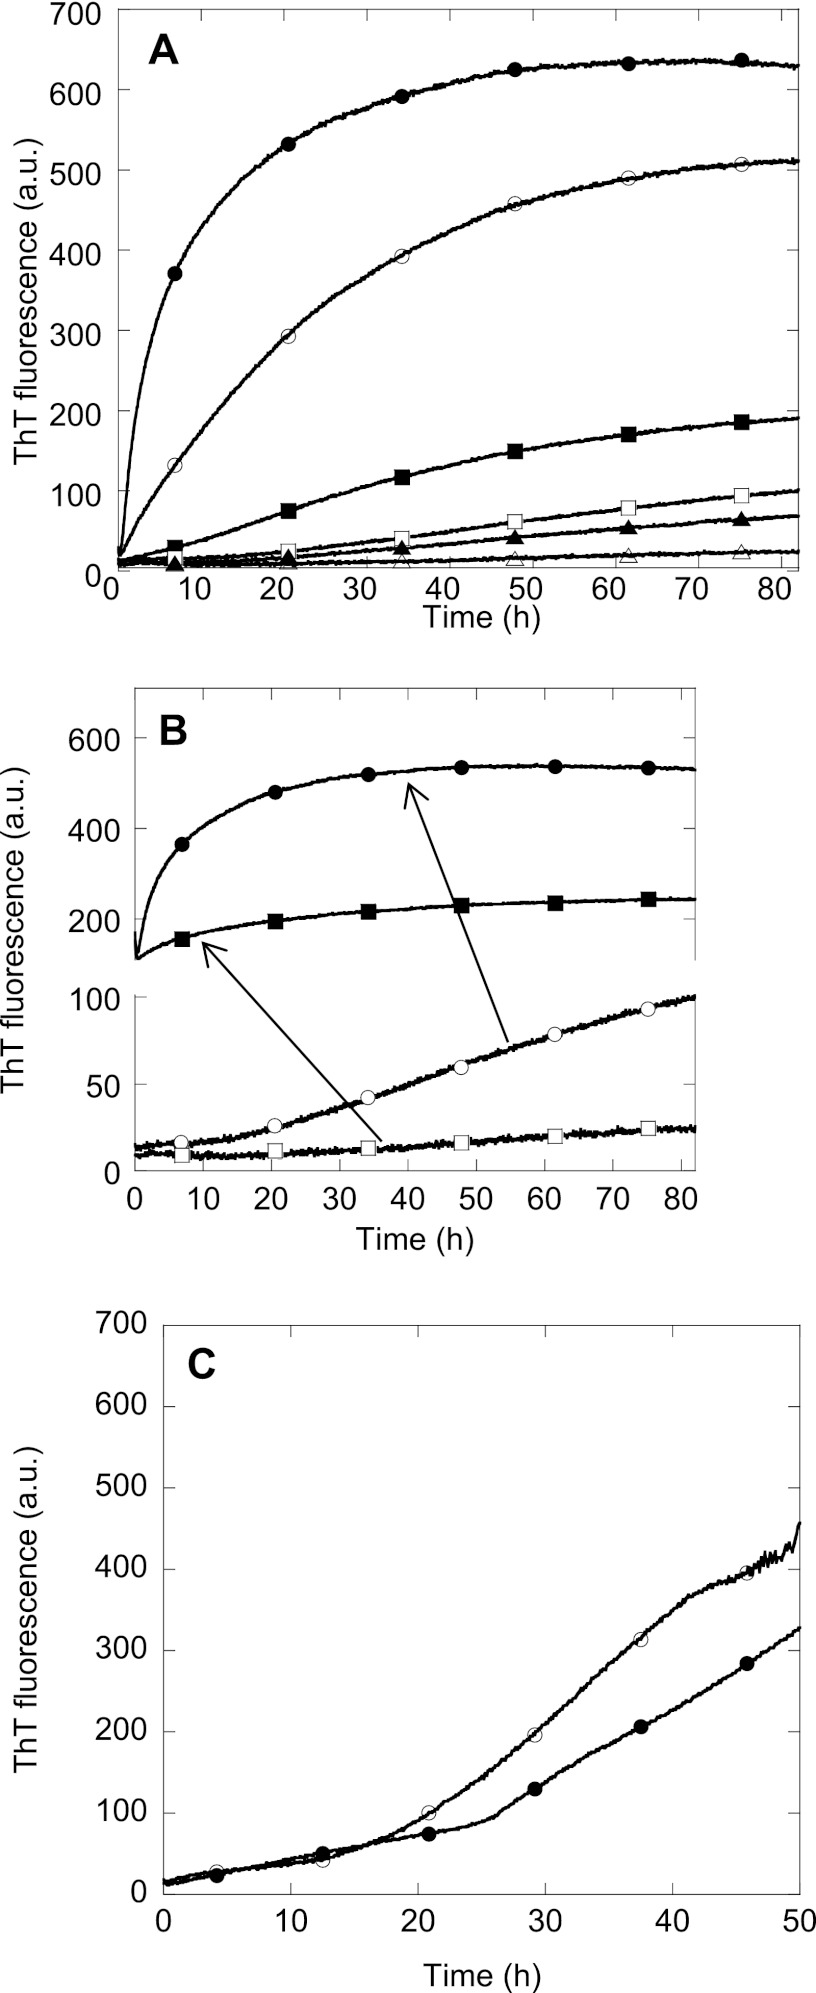
Heparan sulfate is present in the extracellular matrix and may play a role in the aggregation of TGFBIp. We, therefore, investigated the effect of the heparan sulfate mimic heparin on the fibrillation properties of 0.4–1.2 mg/ml FAS1–4 A546T using the amyloid binding dye ThT (Fig. 3A). The fluorescence increase of ThT is due to binding of ThT in grooves on the surface of amyloid fibrils perpendicular to the individual β-strands leading to rotational immobilization of ThT molecule (32, 33). Although ThT binds to fibrils made from proteins with a wide variety of primary, secondary, and tertiary structure, differences in fluorescence intensity among different amyloid fibrils have been observed (33, 34). Between 0.4 and 1.2 mg/ml FAS1–4 A546T, lag times ranged from 23 to 0.5 h in the absence of heparin. In all cases heparin promoted A546T fibrillation, leading to an increased end-ThT fluorescence levels and a shortening of the lag time before the growth phase. As expected, the end-point ThT fluorescence level increased with increasing protein concentration (Fig. 3A), and seeding completely abolished the lag time (Fig. 3B). The fibrillation of FAS1–4 A546T was not significantly affected by 13C and 15N labeling, as fibrillation is also observed for the non-labeled FAS1–4 A546T (Fig. 3C and Ref. 19).
FIGURE 3.
Fibrillation of FAS1–4 A546T at various conditions. A, fibrillation of FAS1–4 A546T was monitored by ThT fluorescence over time in a plate reader for 0.4 (triangles), 0.8 (squares), and 1.2 mg/ml (circles) FAS1–4A546T with 20 mm NaCl (open symbols) or 0.001% heparin (closed symbols). B, shown is ThT fluorescence of 0.4 (squares) and 0.8 mg/ml (circles) FAS1–4 with (closed symbols) and without (open symbols) 10% fibril seeds of preformed fibrils of 1.2 mg/ml FAS1–4 0.001% heparin. C, ThT fluorescence of uniformly 13C,15N-labeled FAS1–4 A546T (●) compared with non-labeled FAS1–4 A546T (○) during fibrillation. The variation in lag times between these two samples is within the level of variation for identical samples. a.u., arbitrary units.
Fibrillation of FAS1–4 A546T Is Sensitive to Electrostatic Screening of Charges Induced by Salt
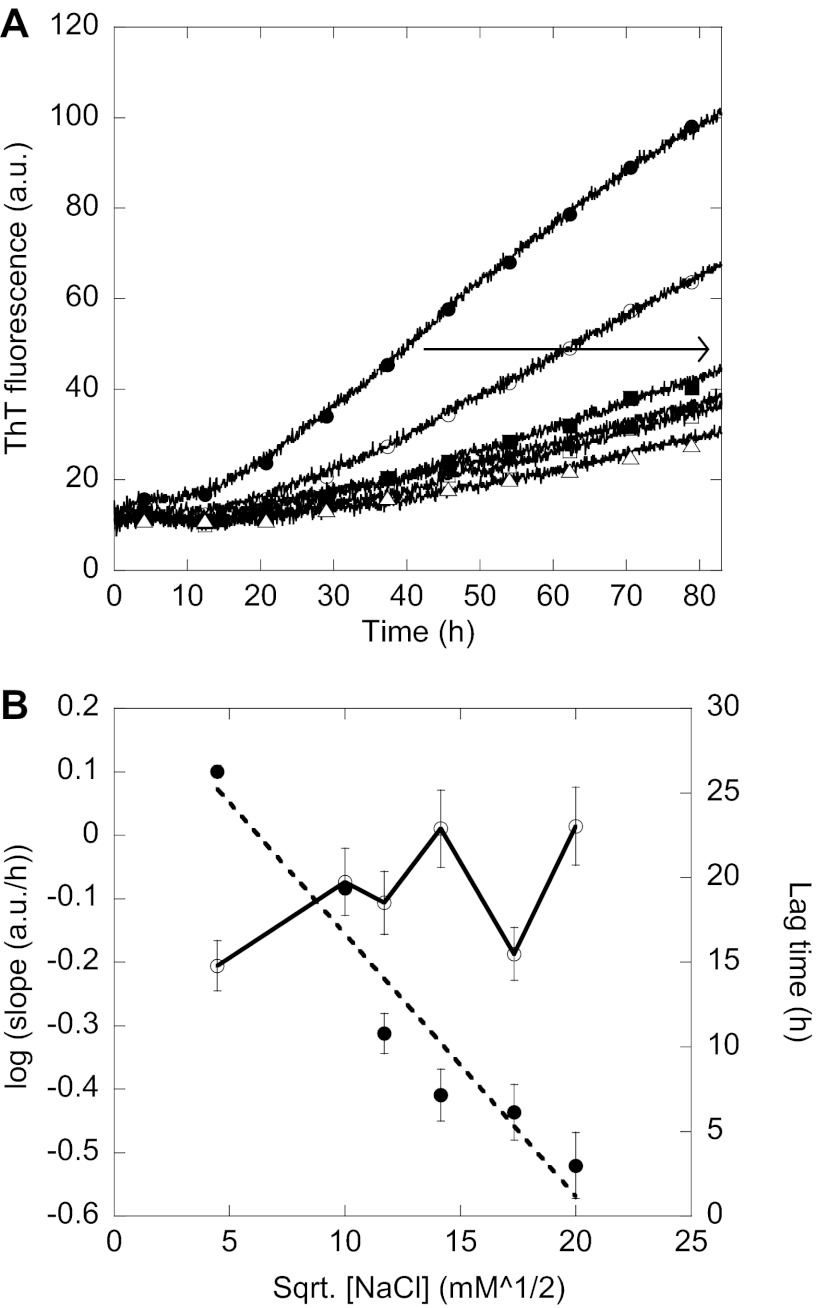
Increasing the salt concentration during fibrillation decreased the slope of the elongation phase (Fig. 4A) while causing a slight increase in the lag time (Fig. 4B). The logarithm of this slope correlated linearly with the square root of the salt concentration (Fig. 4B). This indicates that the elongation of existing fibrils is sensitive to the electrostatic screening of charges, whereas the formation of nuclei leading to fibrils is only slightly affected by electrostatic screening of charges. This effect is indeed an electrostatic screening effect as the ThT fluorescence of preformed fibrils does not change with the addition of salt (data not shown).
FIGURE 4.
Electrostatic screening of fibrillation. A, ThT fluorescence of 0.8 mg/ml FAS1–4 A546T with 20 mm (●), 100 mm (○), 137 mm (■), 200 mm (□), 300 mm (▴), and 400 mm (△) NaCl. The arrow indicates increasing NaCl concentration. B, left y axis, the logarithm of the slope of the elongation phase of the ThT curve seen during fibrillation is plotted against the square root of the NaCl concentration in mm for 0.8 mg/ml FAS1–4 A546T and gives a straight line (●). Right y axis, shown is the lag time of the fibrillation curves in A plotted against the square root of the NaCl concentration (○). The lag time is determined as the intersection between the two straight lines formed during the lag phase and the elongation phase respectively. a.u., arbitrary units.
Fibrils Formed under Different Conditions Have Similar Secondary Structure as Seen by FTIR
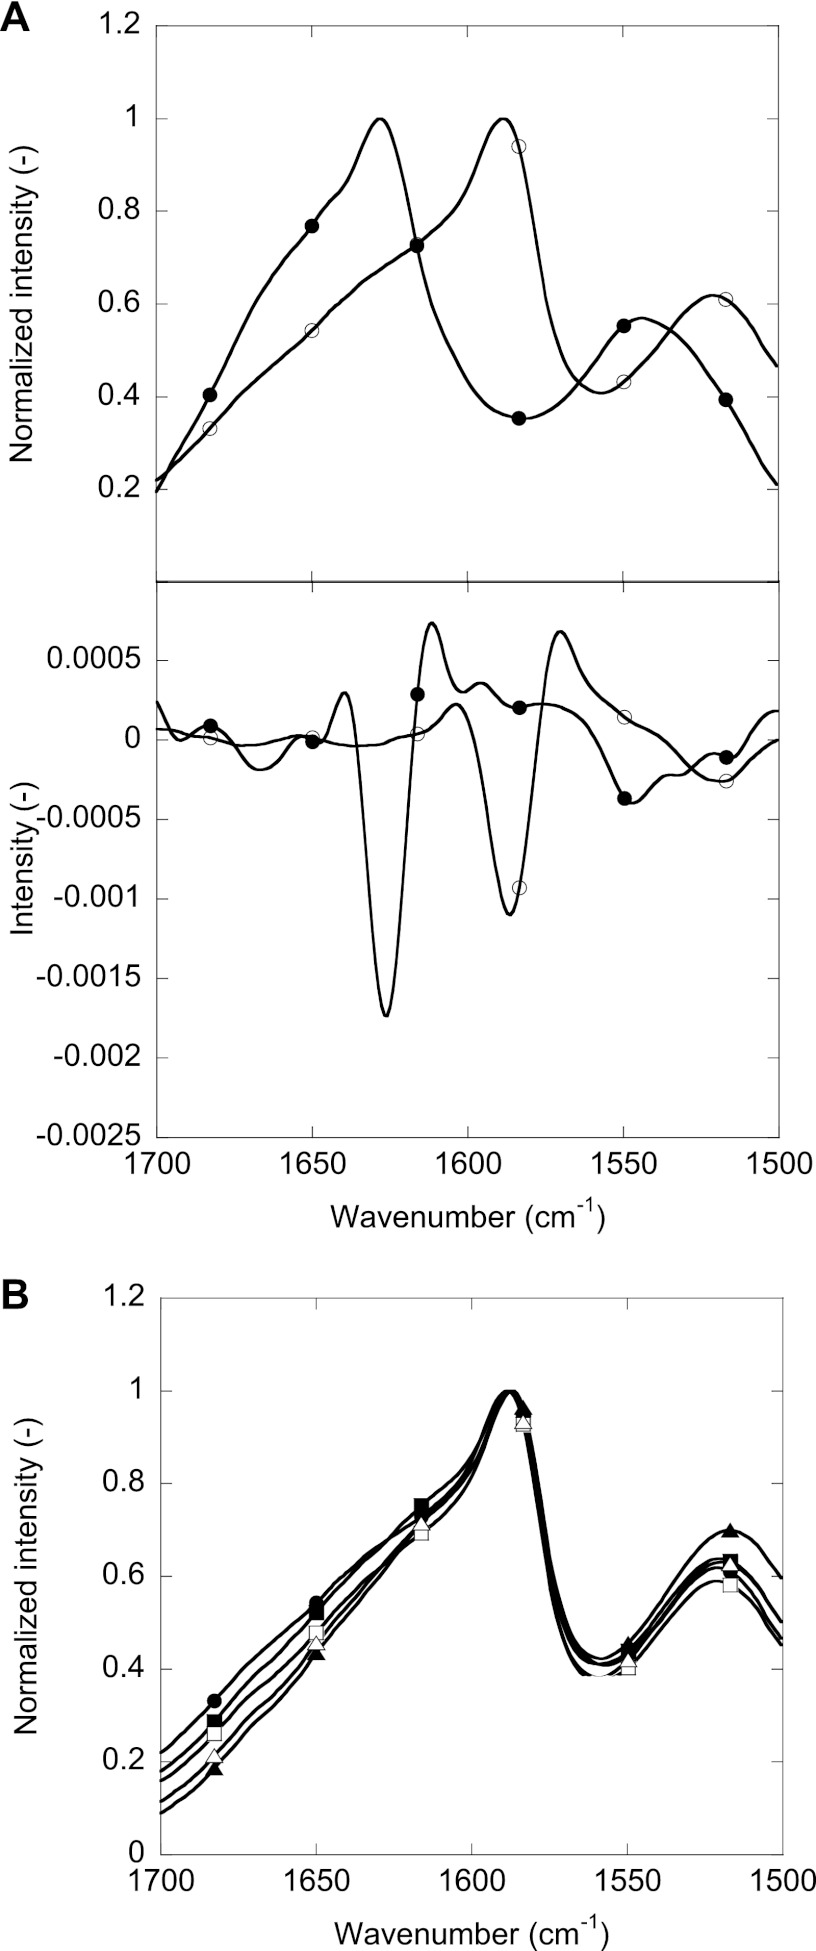
The FTIR spectra of isotope-labeled FAS1–4 A546T did not have a significant peak maximum within the amide I band (1700–1600 cm−1) (Fig. 5). The most prominent peak was observed at ∼1586 cm−1, between the amide I and amide II band (1480 to 1575 cm−1). This was due to a shift toward lower wave numbers induced by heavier isotope 13C labeling compared with non-labeled protein (35). 13C labeling can lead to shifts of up to 45 cm−1 for peaks in the amide I region (36). Comparison of the FTIR spectra of fibrils of non-labeled and uniformly 13C,15N-labeled FAS1–4 A546T produced in 0.001% heparin (Fig. 5A) showed the same two broad peaks in both cases; however, the non-labeled peak at 1628 cm−1 was shifted by 40 to 1588 cm−1 by isotope labeling, whereas the smaller peak was shifted from 1543 to 1521 cm−1 (i.e. 22 cm−1). The similarity in shape and level of peak-shifting is confirmed by the second derivative of the two spectra (Fig. 5B). The non-labeled sample very prominent 1628 cm−1 peak is indicative of amyloid β-sheet structure (37), corresponding to the isotope-labeled sample peak at 1588 cm−1. The FTIR spectra of different fibrillar samples of FAS1–4 A546T showed the same overall features, although there were subtle differences in the 1700–1600 cm−1 region (Fig. 5C). In conclusion, FTIR revealed no major changes in secondary structure between labeled and unlabeled A546T fibrils and between fibrils made under different conditions.
FIGURE 5.
FTIR analysis of the secondary structure of FAS1–4 A546T. A, shown is a comparison of FTIR spectra and the second derivative of the spectra of uniformly 13C,15N-labeled FAS1–4 A546T (○) and non-labeled FAS1–4 A546T (●). B, comparison of FTIR spectra of fibrils of FAS1–4 A546T obtained at 0.4 (circles), 0.8 (squares), and 1.2 mg/ml (triangles) with 20 mm NaCl (open symbols) or 0.001% heparin (closed symbols).
The Morphology of FAS1–4 A546T Fibrils Is Affected by the Protein Concentration
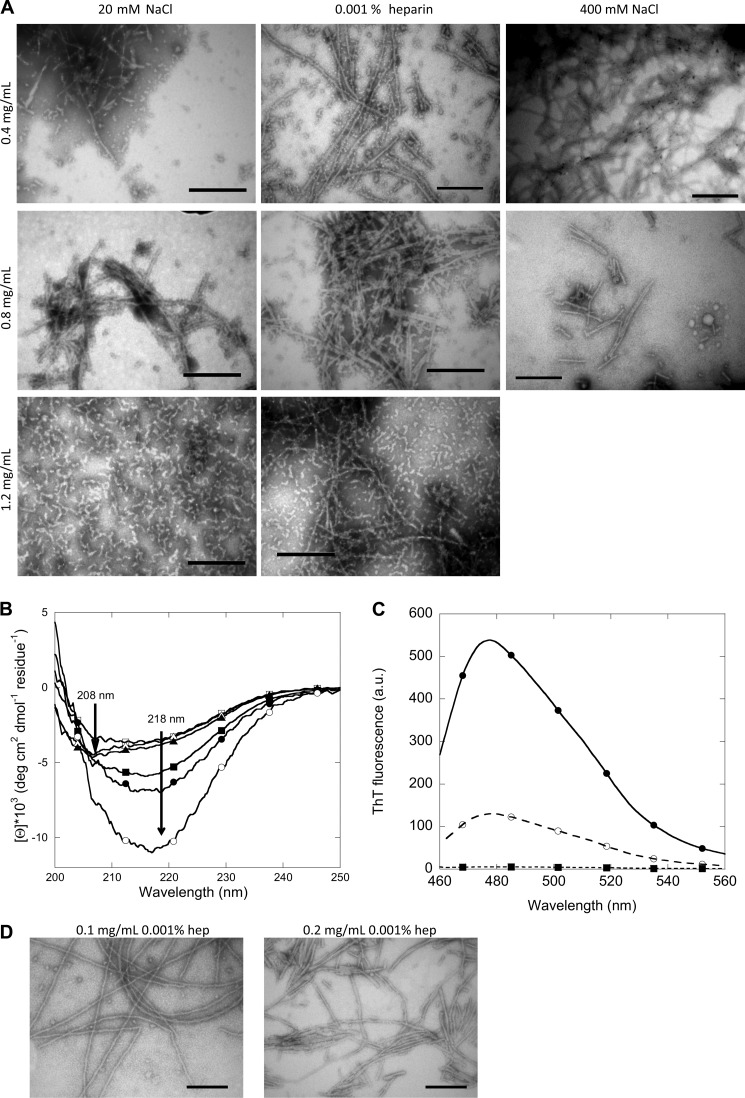
Despite the similar FTIR spectra, the fibrils differed in morphology. TEM imaging reveals two morphologies, namely short and curly fibrils and long and straight fibrils (Fig. 6A). The occurrence of one or the other type is governed by the initial protein concentration before fibrillation. Lower concentrations (0.4 and 0.8 mg/ml) led to long and straight fibrils, whereas higher concentrations (1.2 mg/ml) give rise to short and curly fibrils. The long straight fibril formed at low protein concentrations is not affected by the presence of salt, as the morphology of the fibrils does not change even in the presence of 400 mm NaCl. Hence, salt does not induce fibril polymorphism in FAS1–4 fibrils. The two types of fibrils also display different CD spectra (Fig. 6B). Samples containing long and straight fibrils display a classical β-sheet CD spectrum with a single negative peak at ∼218 nm. In contrast, samples containing short and curly fibrils display a different CD spectrum with two negative peaks at ∼208 and 218 nm, indicating a mixture of α-helix and β-sheet structure. The CD spectrum obtained for short and curly fibrils is somewhat similar to the CD spectrum for monomeric FAS1–4 A546T before fibrillation (Fig. 1A, inset), which also displayed two negative peaks at ∼208 and 218 nm. The differences in CD spectra may correspond to the differences in the FTIR spectra in the 1700–1600 cm−1 region. Our CD spectra indicate that the structural rearrangements during fibrillation are more pronounced at lower than at higher protein concentrations. Furthermore, the two types of fibrils bind ThT to a different extent (Fig. 6C). At the same protein concentration, the long straight fibrils display a higher ThT fluorescence as compared with the short and curly fibrils. This could be due to more binding sites for ThT being present on the long and straight fibrils, possibly due to the more classical β-sheet structure displayed by these fibrils.
FIGURE 6.
Structural analysis of fibrils formed at different concentrations with 20 mm NaCl, 400 mm NaCl, or 0.001% heparin. A, shown is TEM analysis of the morphology of fibrils of FAS1–4 A546T at 0.4, 0.8, and 1.2 mg/ml with 20 mm NaCl, 400 mm NaCl, or 0.001% heparin. B, shown are CD spectra of the secondary structure of fibrils of FAS1–4 A546T at 0.4 (circles), 0.8 (squares), and 1.2 mg/ml (triangles) with 20 mm NaCl (open symbols) or 0.001% heparin (closed symbols). C, shown are ThT fluorescence spectra of the two types of fibrils normalized to protein concentration, long and straight fibrils at 0.4 mg/ml 0.001% heparin (●) and short and curly fibrils at 1.2 m/ml 20 mm NaCl (○), and ThT in buffer (■). D, TEM analysis of the morphology of fibrils of FAS1–4 A546T at 0.1 and 0.2 mg/ml with 0.001% heparin is shown. a.u., arbitrary units.
The long and straight fibrils are also formed at protein concentrations lower than 0.4 mg/ml (Fig. 6D). Even at 0.1 and 0.2 mg/ml FAS1–4, the long straight fibril morphology is seen. This indicates that short and curly fibrils only form above a threshold concentration; below this threshold the long straight fibril morphology dominates.
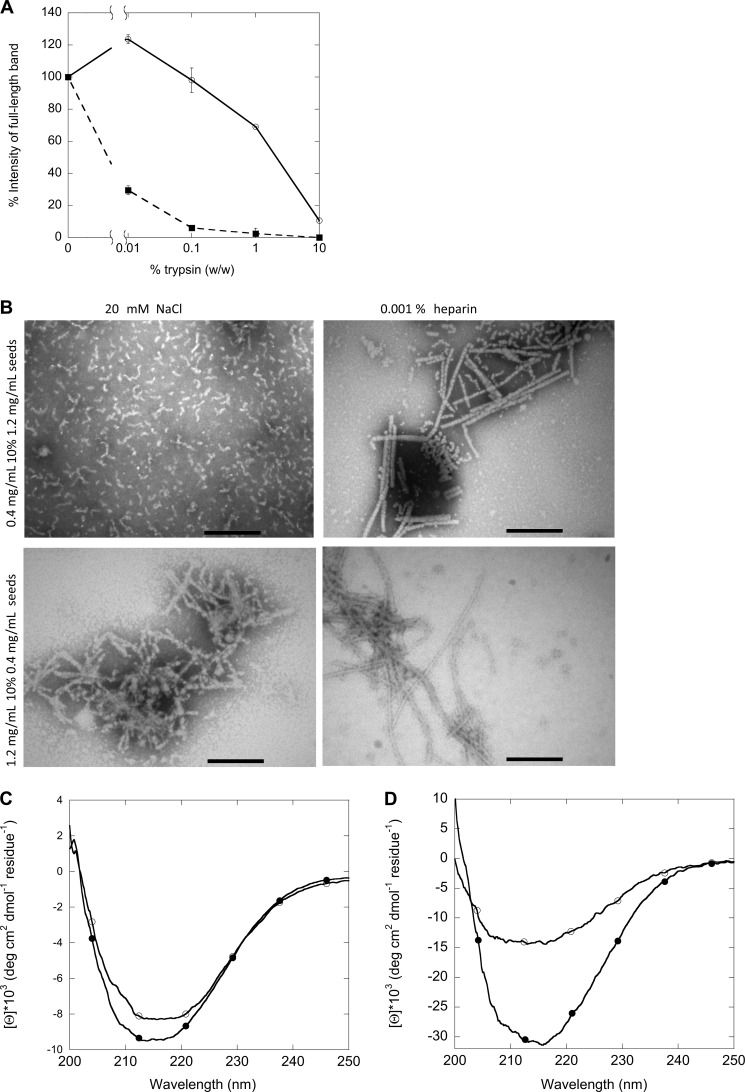
The long and straight fibrils formed at low protein concentrations are significantly more stable than the short and curly fibrils toward limited trypsin digestion of the two types of fibrils (Fig. 7A). This could be due to the retention of monomer-like secondary structure by fibrils formed at 1.2 mg/ml.
FIGURE 7.
Structural analysis of first and second generation fibrils formed at different concentrations with 20 mm NaCl or 0.001% heparin. A, shown is limited trypsin digestion of the two types of fibrils of FAS1–4 A546T, long and straight fibrils at 0.4 mg/ml 0.001% heparin (○) and short and curly fibrils at 1.2 mg/ml 20 mm NaCl (■). B, TEM analysis of the morphology is shown. C, shown are CD spectra of the secondary structure of fibrils of FAS1–4 A546T at 0.4 mg/ml seeded with 1.2 mg/ml 0.001% heparin fibrils with 20 mm NaCl (○) and 0.001% heparin (●). D, shown are CD spectra of the secondary structure of fibrils of FAS1–4 A546T at 1.2 mg/ml seeded with 0.4 mg/ml 0.001% heparin fibrils with 20 mm NaCl (○) and 0.001% heparin (●).
Seeding Can Imprint the Morphology of Parent Fibrils onto Daughter Fibrils
When using seeds of one type of fibrils to seed fibrillation at conditions normally resulting in the other type of fibrils, the structure of the first generation fibrils may be transferred to (imprinted on) the second generation fibrils. Both TEM images and CD spectra showed this to be the case both when using FAS1–4 A546T fibril seeds made at high concentrations (short and curly fibrils) to seed fibrillation at low concentrations and vice versa (Fig. 7B). When seeded with fibrils of 0.4 mg/ml, samples containing 1.2 mg/ml displayed long straight fibrils with a single negative peak in the CD spectra at ∼218 nm. Similarly, when seeded with 1.2 mg/ml fibrils seeds, 0.4 mg/ml samples display short curly fibrils and CD spectra with two negative peaks at ∼208 and 218 nm. However, under some conditions the imprint is incomplete, leading to a mixed morphology. This is seen for fibrils made at 0.4 mg/ml FAS1–4, 0.001% heparin seeded with 1.2 mg/ml 0.001% heparin fibrils as well as 1.2 mg/ml FAS1–4, 20 mm NaCl seeded with 0.4 mg/ml 0.001% heparin fibrils where a mixture of short, curly, and long, straight fibrils occurs (Fig. 7B). This is also seen in the CD spectrum for fibrils of 0.4 mg/ml 0.001% heparin seeded with 1.2 mg/ml 0.001% heparin fibrils, leading to fibrils that display a single minimum at 218 nm (similar to fibrils formed from 0.4 mg/ml A546T).
Low Concentration Fibrils Follow a Different Fibrillation Mechanism Than High Concentration Fibrils
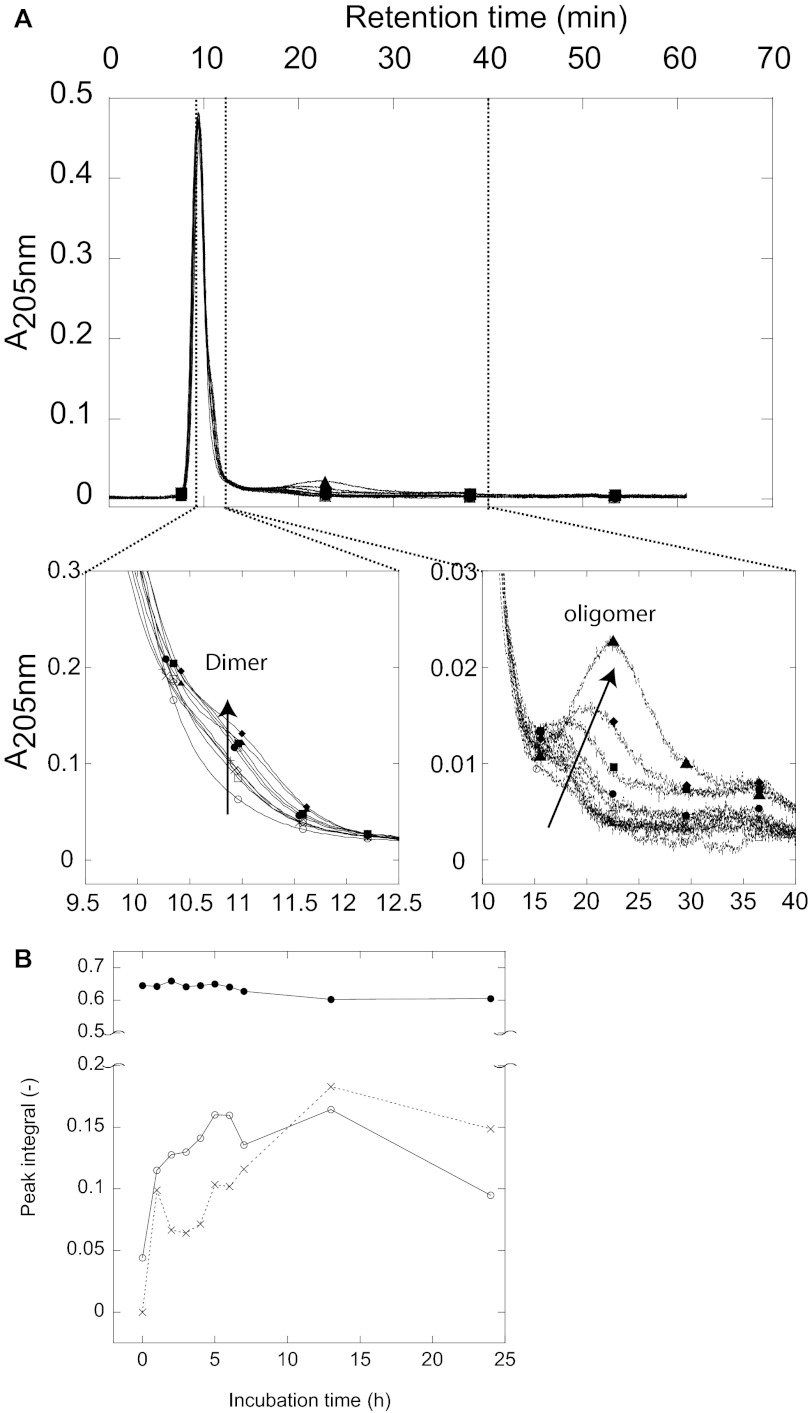
We decided to examine whether differences in fibril morphology reflect different fibrillation mechanisms, e.g. accumulation of different aggregate species during the fibrillation process. We used AF4, which has previously proven useful to study protein aggregation patterns including e.g. Aβ (38), glucagon (39), S6 (28), prion protein (41), and β-lactoglobulin (42, 43) to separate FAS1–4 samples and probe the presence of intermediate species in samples removed at different time points during fibrillation. The theory and separation principles in AF4 has been reviewed elsewhere (44, 45). During the first 24 h of fibrillation of FAS1–4 A546T at 1.2 mg/ml, the only species seen are the monomer (retention time 9.5 min or ∼ 20 kDa), a dimer (retention time 10.8 min ∼ 40 kDa), and larger oligomers (retention time 15.4–22.3 min ∼ 230–750 kDa) (Fig. 8). The monomer peak at 9.5 min retained the same intensity in all samples tested (Fig. 8B). At 0 h very little if any dimer was present, but already at 1 h the dimer “shoulder” seen on the monomer peak became apparent. The intensity of the dimer peak increased to a maximum at 13 h followed by a slight decrease at 24 h as seen by the peak integral found by gaussian curve-fitting using OriginPro8 (OriginLab, Northampton, UK) (Fig. 8B). A small amount of larger oligomer species was present in the 0 h sample around 17 min. The intensity of the peak increased up to 13 h, whereas the retention time of the peak was shifted toward higher retention times. This indicates that the oligomer species increased in size and that they are present in larger amounts at the later time points (Fig. 8A, arrow in the zoomed area, and B). No higher order structures larger than the oligomers were observed; cf. the flat line beyond 30 min (Fig. 8A).
FIGURE 8.
AF4 analysis of samples removed at different time point from a fibrillating sample with 1.2 mg/ml FAS1–4 A546T. A, shown is an elution profile of time point-samples taken during fibrillation of 1.2 mg/ml FAS1–4 A546T, with zoomed areas showing the dimer peak and the oligomer peak. Samples were removed at time point 0 h (○), 1 h (□), 2 h (♢), 3 h (×), 4 h (|), 5 h (△), 6 h (●), 7 h (■), 13 h (♦), and 24h (▴). B, peak integral of the monomer (●), dimer (○), and oligomer species (×) made using Gaussian curve fitting using the OriginPro 8 software.
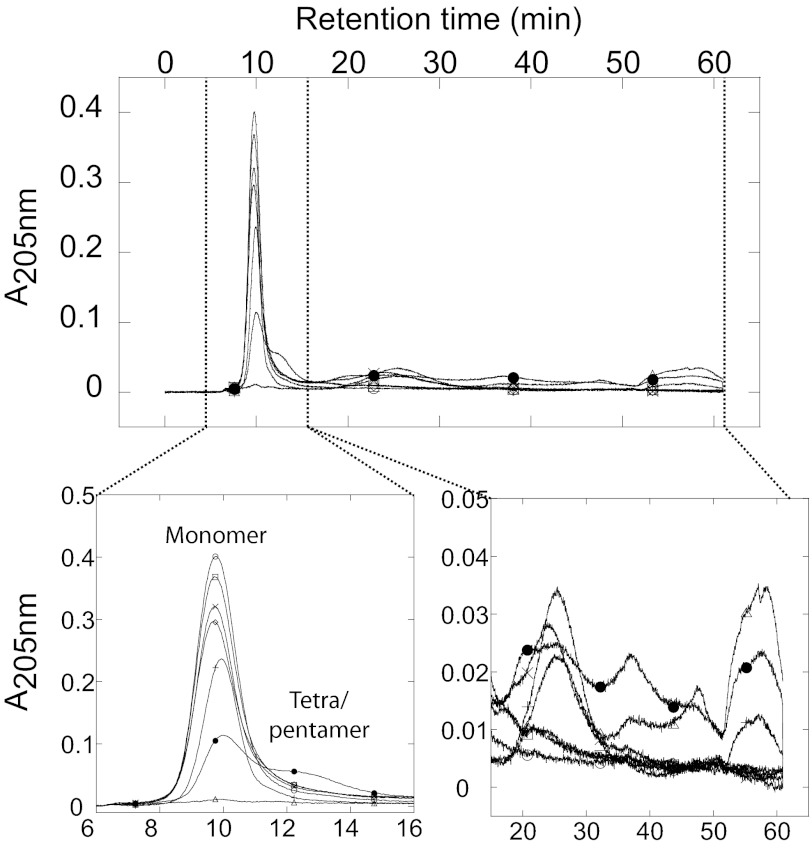
The population of species during fibrillation of 0.4 mg/ml FAS1–4 A546T was more complex (Fig. 9). The monomer peak (9.5 min) decreased in intensity during fibrillation (Fig. 9B), and there was no significant dimer shoulder. An oligomer (retention time 12.5 min ∼ 100 kDa, corresponding to a tetra-pentamer) was seen for the later time points and especially in the 24-h overnight sample. Furthermore, a larger species (retention time of 25 min ∼ 1.2 MDa) was seen at >3 h (Fig. 9). In the 7.5–24 h samples, high molecular weight species were detected in at least 3 different peaks between 35 and 60 min, well above 1 MDa in size but still soluble. The largest species eluting around 55–60 min eluted at zero cross-flow, i.e. where no further separation occurs. These species were observed for the 7.5-, 11-, and 24-h samples. The larger oligomeric species were not quantified as light-scattering contributions to absorbance measurements become increasingly large as oligomeric size increases.
FIGURE 9.
AF4 analysis of samples removed at different time points from a fibrillating sample with 0.4 mg/ml FAS1–4 A546T, 0.001% heparin. Shown is an elution profile of time-point samples taken during fibrillation of 0.4 mg/ml FAS1–4 A546T, 0.001% heparin with zoomed areas showing the monomer peak and the higher order oligomer peaks. Samples are removed at time point 0 h (○), 1 h (□), 3 h (♢), 5 h (×), 7.5 h (|), 11 h (△), and 24 h (●). Different oligomeric species can be seen.
The Oligomeric Species Present during Fibrillation Cause Different Levels of Calcein Release from Phospholipid Vesicles
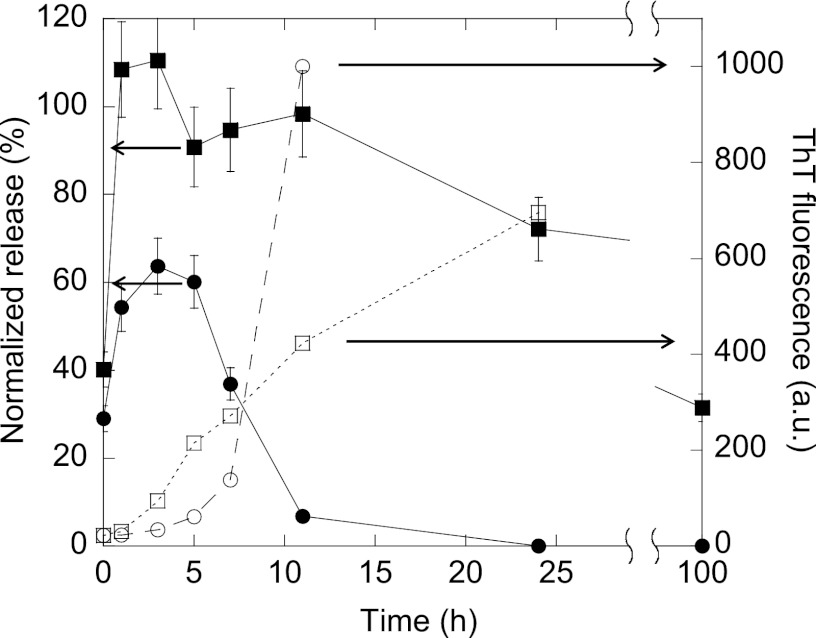
Taken together, these results suggest that FAS1–4 fibrillates through the presence of different oligomers when fibrillated at 0.4 and 1.2 mg/ml, respectively. Oligomers have previously been linked with the ability to perturb and permeabilize membranes (46, 47). To further investigate this, calcein release was used to examine the membrane interaction of the species present during fibrillation at 0.4 and at 1.2 mg/ml FAS1–4 A546T. Calcein release relies on the ability of the added species to either lyse the vesicles or form pores of sufficient size to allow calcein to diffuse through. The species present in the 0.4 mg/ml fibrillating sample caused release from 100% DOPG vesicles (Fig. 10). Release from vesicles of 1:1 DOPG:DOPC was observed to the same extent as for 100% DOPG (data not shown). The calcein release peaks at the sample at 3 h for 0.4 mg/ml (Fig. 10A) (within the lag phase of the fibrillation) and disappears after 7–10 h, by which time fibrillation is well under way. A different scenario was observed for samples removed during fibrillation of 1.2 mg/ml FAS1–4. After an initial increase in release that peaks at 3 h, the calcein release declines slightly, but unlike the 0.4 mg/ml samples it remains at a high level. No calcein release is seen from vesicles of 100% DOPC for either concentration (data not shown). The calcein release rises to high levels well before the onset of fibrillation. Even though the fibrillation as seen by ThT fluorescence was faster in the beginning for 1.2 mg/ml as compared with 0.4 mg/ml, the opposite was seen at later time-points (Fig 10). The loss of membrane permeabilization potential at the later time points in the 0.4 mg/ml samples likely represents a loss of the oligomeric species responsible for the membrane permeation in the soluble fraction of the samples, i.e. a conversion of soluble oligomeric species into insoluble fibrillar species.
FIGURE 10.
Calcein release from DOPG vesicles by samples removed at different time points during fibrillation of 0.4 mg/ml FAS1–4 A546T, 0.001% heparin (●) and 1.2 mg/ml FAS1–4 A546T 20 mm NaCl (■). Calcein release using 0.6 μm protein at different time points during fibrillation and ThT fluorescence for the same time points of 0.4 mg/ml FAS1–4 0.001% heparin (○) and 1.2 mg/ml FAS1–4 20 mm NaCl (□) is shown. Error bars based on duplicates. The calcein release is plotted against the primary y axis, and the ThT fluorescence is plotted against the secondary y axis.
DISCUSSION
Corneal dystrophies related to amino acid substitutions in TGFBIp represent a diverse system for the investigation of protein deposition mechanisms. In a recent study we demonstrated that the thermodynamic stability of TGFBIp is linked to the type of aggregate formed by TGFBIp and that the fourth FAS1 domain drives this behavior (19). Together with the observation that C-terminal parts of TGFBIp (including the FAS1–4 domain) appear to be intact in normal human corneas during protein turnover (23), this renders the FAS1–4 domain highly relevant for modeling TGFBIp aggregation in vitro.
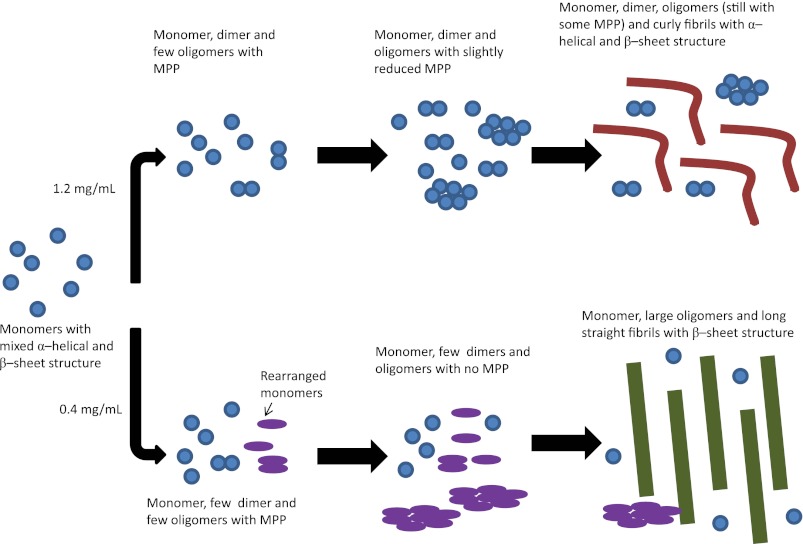
Combining the ThT fluorescence data obtained during fibrillation, TEM images of fibril morphology, CD spectra of the secondary structure of fibrils, calcein release data, and data from the AF44 analysis, we propose a model for the formation of the two different types of fibrils seen at different concentrations (Fig. 11). The starting point for the fibrillation is the same for fibrillation at 0.4 and 1.2 mg/ml, namely monomers as seen from the AF44 elution profiles at 0 h. When A546T fibrillation is carried out at high concentrations (1.2 mg/ml), dimers and oligomers accumulate and rapidly form curly fibrils, as seen by the rapid rise in ThT fluorescence. The monomer was incorporated into fibrils very rapidly, and presumably some native structure is retained in the process (leading to a CD spectrum indicative of a mixed α-helical and β-sheet structure), probably by domains not integrated into the fibril structure. Dimers and oligomers remain populated at high levels throughout the fibrillation process, and we ascribe the observed extended membrane permeabilization activity to these species.
FIGURE 11.
Proposed model for the formation of the two different types of fibrils. Initially the monomer with a structure of mixed α-helical and β-sheet structure is present. At high concentrations the monomer forms dimers and bigger oligomers and curly fibrils. The formation of fibrils occurs so rapidly that the monomer retains some of its native structure in the fibrils, leading to curly fibrils with a mixed α-helical and β-sheet structure. At 0.4 mg/ml the formation of fibrils occurs more slowly and through the formation of many different types of oligomers. This leads to the formation of long straight fibrils with β-sheet structure as the monomer has sufficient time to rearrange. At the final stage, the size of monomers and dimers is not scaled to match the size of the fibrils (these will be much bigger than the ones shown in the figure). MPP, membrane permeabilization potential.
On the other hand, when fibrillation was carried out at low concentrations (0.4 mg/ml), no dimers were seen, small oligomers formed more slowly, and the ThT fluorescence increased more slowly. The rise in calcein release followed by its disappearance in 0.4 mg/ml samples could be due to the presence of smaller oligomeric species in the first few hours of fibrillation as seen in the AF4 analysis. After this, the smaller oligomers are predominantly replaced by higher order oligomeric species, which in contrast to 1.2 mg/ml fibrillations, progressively grow into higher order oligomer species and ultimately into insoluble fibril species. The continued presence of small oligomeric species thus likely explains the sustained calcein release after 7 h in 1.2 mg/ml but not 0.4 mg/ml fibrillation.
We propose that at 0.4 mg/ml the formation of smaller oligomers and their conversion to larger oligomers and finally fibrils gives the monomer sufficient time to rearrange. This eliminates the α-helical component observed in the native structure, resulting in fibrils containing long and straight β-sheet structures when analyzed by TEM.
Oligomeric prefibrillar aggregates of proteins have previously been shown to permeabilize vesicles and release calcein. This release was eliminated by prolonged incubation leading to fibrillar structures (48). As transient species, oligomers typically only accumulate to low levels, corresponding to a few percent of the total protein population (46, 47). Nevertheless, this does not imply that they are not essential components on the fibrillation pathway, merely that once formed they may quickly transform to larger species. We have not rigorously proved that the oligomers are compulsory precursors for the fibrillar end-stage, but their transient existence is consistent with such a scenario. The link between membrane permeabilization and prefibrillar oligomers has been strengthened by the observation of a pore-like structure capable of membrane permeabilization, formed by different amyloidogenic proteins (46, 49–51). Such pore-like oligomeric structures of Aβ have even been identified in vivo (53). These observations point to the prefibrillar oligomer as the structure responsible for the pathogenesis of amyloid diseases. This could be relevant for the pathogenesis of FAS1–4-linked corneal dystrophies, as membrane permeabilization was observed in the lag-phase of fibrillation and, hence, is linked to the formation of prefibrillar oligomers of FAS1–4 A546T. The presence of prefibrillar oligomers with membrane permeabilization properties could also be involved in corneal erosions reported for several TGFBIp-linked corneal dystrophies (7). These oligomers may interact with the membrane of the cells of the corneal epithelium, eventually leading to the painful recurrent epithelial erosions or edemas of the cornea also observed for the A546T substitution (24, 54).
We decided to set up fibrillation conditions mimicking the physiological environment as closely as possible as no deposition of TGFBIp is seen in normal corneas. All in vivo amyloid samples contain components in addition to the major disease-associated protein (55, 56). These include proteoglycans of the heparan sulfate type that promote fibril formation in numerous amyloidogenic proteins and peptides (e.g. Aβ, α-synuclein, human islet amyloid polypeptide (hIAPP), prion protein, and p25α (57)) as well as proteins that do not fibrillate under physiological conditions (58). Heparan sulfate has also been suggested to play a pathogenic role in the fibrillation process (57, 59–61), although it and the closely related heparin (which both contain a large proportion of highly sulfated disaccharides) also promote fibrillation of a series of peptide and protein hormones (62), which may serve a useful storage function. In line with these observations, we find heparin to stimulate FAS1–4 fibrillation, although the effect is not dramatic and does not seem to play a critical role in the process. It is unclear what the mechanism of stimulation is, although it may involve specific stabilization of aggregation-prone states. FAS1–4 has a pI of around 5.43 and is, therefore, overall negatively charged under physiological conditions; however, contacts with heparin are most likely mediated by contacts with positively charged side chains (Arg and Lys), which do not titrate in this pH range.
Polymorphism in fibrils has been observed previously and has been linked to factors such as mechanical stress, salts, concentration, and temperature (63–66). For FAS1–4 A546T, polymorphism is induced by differences in protein concentration. Fibrillation of the peptide hormone glucagon at different peptide concentrations also induces fibril polymorphism (67). This polymorphism arises from a concentration-dependent equilibrium between the monomeric form and a trimer. FAS1–4 does not form higher order structures like dimers or trimers at the onset of the fibrillation reaction (Fig. 9); these only form gradually over time and are evidently favored at higher concentrations.
Seeding has also been reported to pass on the structure of first generation fibrils to the daughter fibrils (52, 68). This phenomenon is seen for FAS1–4 A546T fibrils under some, but not all conditions. A similar ability to overrule initial seed structure has been seen for point-mutations of the amyloidogenic decapeptide H-SNNFGAILSS-NH2, which comprises the fibrillating core of the protein human islet amyloid polypeptide involved in type II diabetes mellitus (40). When introducing an Ile → Val or an Ala → Gly mutation in this peptide, the fibril morphology changes from twisted ribbons to flat ribbons. This flat ribbon morphology is retained in fibrils seeded with fibrils of the WT peptide that display a twisted ribbon morphology (40).
FAS1–4 A546T was found to be destabilized compared with WT both in terms of equilibrium denaturation, thermal denaturation, and trypsinolysis. This is consistent with what has previously been reported for unlabeled FAS1–4 A546T and WT (19). This destabilization and the exposure of hydrophobic patches on the surface of the protein are likely to influence the intermolecular interactions formed by the protein. The increased “stickiness” of the A546T mutant thus drives oligomerization, leading to fibrillation nuclei and eventually visible protein deposits.
This work was supported by the Danish National Research Foundation.
- TGFBIp
- transforming growth factor β-induced protein
- FAS1–4
- fourth fasciclin 1 domain of TGFBIp
- ThT
- Thioflavin T
- ANS
- 1-anilinonapthalene-8-sulfonate
- AF4
- asymmetrical flow field-flow fractionation
- DOPC
- 1,2-dioleoyl-sn-glycero-3-phosphocholine
- DOPG
- 1,2-dioleoyl-sn-[phosphor-rac-(1-glycerol)]
- TEM
- transmission electron microscopy.
REFERENCES
- 1. Skonier J., Neubauer M., Madisen L., Bennett K., Plowman G. D., Purchio A. F. (1992) cDNA cloning and sequence analysis of β ig-h3, a novel gene induced in a human adenocarcinoma cell line after treatment with transforming growth factor-β. DNA Cell Biol. 11, 511–522 [DOI] [PubMed] [Google Scholar]
- 2. Escribano J., Hernando N., Ghosh S., Crabb J., Coca-Prados M. (1994) cDNA from human ocular ciliary epithelium homologous to β ig-h3 is preferentially expressed as an extracellular protein in the corneal epithelium. J. Cell. Physiol. 160, 511–521 [DOI] [PubMed] [Google Scholar]
- 3. Andersen R. B., Karring H., Møller-Pedersen T., Valnickova Z., Thøgersen I. B., Hedegaard C. J., Kristensen T., Klintworth G. K., Enghild J. J. (2004) Purification and structural characterization of transforming growth factor β induced protein (TGFBIp) from porcine and human corneas. Biochemistry 43, 16374–16384 [DOI] [PubMed] [Google Scholar]
- 4. Basaiawmoit R. V., Oliveira C. L., Runager K., Sørensen C. S., Behrens M. A., Jonsson B. H., Kristensen T., Klintworth G. K., Enghild J. J., Pedersen J. S., Otzen D. E. (2011) SAXS models of TGFBIp reveal a trimeric structure and show that the overall shape is not affected by the R124H mutation. J. Mol. Biol. 408, 503–513 [DOI] [PubMed] [Google Scholar]
- 5. Klintworth G. K., Valnickova Z., Enghild J. J. (1998) Accumulation of β ig-h3 gene product in corneas with granular dystrophy. Am. J. Pathol. 152, 743–748 [PMC free article] [PubMed] [Google Scholar]
- 6. Munier F. L., Korvatska E., Djemaï A., Le Paslier D., Zografos L., Pescia G., Schorderet D. F. (1997) Kerato-epithelin mutations in four 5q31-linked corneal dystrophies. Nat. Genet. 15, 247–251 [DOI] [PubMed] [Google Scholar]
- 7. Kannabiran C., Klintworth G. K. (2006) TGFBI gene mutations in corneal dystrophies. Hum. Mutat. 27, 615–625 [DOI] [PubMed] [Google Scholar]
- 8. Klintworth G. K. (2003) The molecular genetics of the corneal dystrophies. Current status. Front. Biosci. 8, d687–d713 [DOI] [PubMed] [Google Scholar]
- 9. Zinn K., McAllister L., Goodman C. S. (1988) Sequence analysis and neuronal expression of fasciclin I in grasshopper and Drosophila. Cell 53, 577–587 [DOI] [PubMed] [Google Scholar]
- 10. Clout N. J., Tisi D., Hohenester E. (2003) Novel fold revealed by the structure of a FAS1 domain pair from the insect cell adhesion molecule fasciclin I. Structure 11, 197–203 [DOI] [PubMed] [Google Scholar]
- 11. Weiss J. S., Møller H. U., Lisch W., Kinoshita S., Aldave A. J., Belin M. W., Kivelä T., Busin M., Munier F. L., Seitz B., Sutphin J., Bredrup C., Mannis M. J., Rapuano C. J., Van Rij G., Kim E. K., Klintworth G. K. (2008) The IC3D classification of the corneal dystrophies. Cornea 27, S1–S83 [DOI] [PMC free article] [PubMed] [Google Scholar]
- 12. Conrad T. J., Chandler D. B., Corless J. M., Klintworth G. K. (1994) In vivo measurement of corneal angiogenesis with video data acquisition and computerized image analysis. Lab. Invest. 70, 426–434 [PubMed] [Google Scholar]
- 13. Mashima Y., Imamura Y., Konishi M., Nagasawa A., Yamada M., Oguchi Y., Kudoh J., Shimizu N. (1997) Homogeneity of kerato-epithelin codon 124 mutations in Japanese patients with either of two types of corneal stromal dystrophy. Am. J. Hum. Genet. 61, 1448–1450 [DOI] [PMC free article] [PubMed] [Google Scholar]
- 14. Okada M., Yamamoto S., Watanabe H., Inoue Y., Tsujikawa M., Maeda N., Shimomura Y., Nishida K., Kinoshita S., Tano Y. (1998) Granular corneal dystrophy with homozygous mutations in the kerato-epithelin gene. Am. J. Ophthalmol. 126, 169–176 [DOI] [PubMed] [Google Scholar]
- 15. Korvatska E., Munier F. L., Djemaï A., Wang M. X., Frueh B., Chiou A. G., Uffer S., Ballestrazzi E., Braunstein R. E., Forster R. K., Culbertson W. W., Boman H., Zografos L., Schorderet D. F. (1998) Mutation hot spots in 5q31-linked corneal dystrophies. Am. J. Hum. Genet. 62, 320–324 [DOI] [PMC free article] [PubMed] [Google Scholar]
- 16. Munier F. L., Frueh B. E., Othenin-Girard P., Uffer S., Cousin P., Wang M. X., Héon E., Black G. C., Blasi M. A., Balestrazzi E., Lorenz B., Escoto R., Barraquer R., Hoeltzenbein M., Gloor B., Fossarello M., Singh A. D., Arsenijevic Y., Zografos L., Schorderet D. F. (2002) BIGH3 mutation spectrum in corneal dystrophies. Invest. Ophthalmol. Vis. Sci. 43, 949–954 [PubMed] [Google Scholar]
- 17. Fujiki K., Nakayasu K., Kanai A. (2001) Corneal dystrophies in Japan. J. Hum. Genet. 46, 431–435 [DOI] [PubMed] [Google Scholar]
- 18. Chakravarthi S. V., Kannabiran C., Sridhar M. S., Vemuganti G. K. (2005) TGFBI gene mutations causing lattice and granular corneal dystrophies in Indian patients. Invest Ophthalmol. Vis. Sci. 46, 121–125 [DOI] [PubMed] [Google Scholar]
- 19. Runager K., Basaiawmoit R. V., Deva T., Andreasen M., Valnickova Z., Sørensen C. S., Karring H., Thøgersen I. B., Christiansen G., Underhaug J., Kristensen T., Nielsen N. C., Klintworth G. K., Otzen D. E., Enghild J. J. (2011) Human phenotypically distinct TGFBI corneal dystrophies are linked to the stability of the fourth FAS1 domain of TGFBIp. J. Biol. Chem. 286, 4951–4958 [DOI] [PMC free article] [PubMed] [Google Scholar]
- 20. Streeten B. W., Qi Y., Klintworth G. K., Eagle R. C., Jr., Strauss J. A., Bennett K. (1999) Immunolocalization of β ig-h3 protein in 5q31-linked corneal dystrophies and normal corneas. Arch. Ophthalmol. 117, 67–75 [DOI] [PubMed] [Google Scholar]
- 21. Korvatska E., Henry H., Mashima Y., Yamada M., Bachmann C., Munier F. L., Schorderet D. F. (2000) Amyloid and non-amyloid forms of 5q31-linked corneal dystrophy resulting from kerato-epithelin mutations at Arg-124 are associated with abnormal turnover of the protein. J. Biol. Chem. 275, 11465–11469 [DOI] [PubMed] [Google Scholar]
- 22. Beebe D. C. (2008) Maintaining transparency. A review of the developmental physiology and pathophysiology of two avascular tissues. Semin. Cell Dev. Biol. 19, 125–133 [DOI] [PMC free article] [PubMed] [Google Scholar]
- 23. Karring H., Runager K., Thøgersen I. B., Klintworth G. K., Højrup P., Enghild J. J. (2012) Composition and proteolytic processing of corneal deposits associated with mutations in the TGFBI gene. Exp. Eye Res. 96, 163–170 [DOI] [PMC free article] [PubMed] [Google Scholar]
- 24. Dighiero P., Drunat S., Ellies P., D'Hermies F., Savoldelli M., Legeais J. M., Renard G., Delpech M., Grateau G., Valleix S. (2000) A new mutation (A546T) of the β ig-h3 gene responsible for a French lattice corneal dystrophy type IIIA. Am. J. Ophthalmol. 129, 248–251 [DOI] [PubMed] [Google Scholar]
- 25. Ghodke S., Nielsen S. B., Christiansen G., Hjuler H. A., Flink J., Otzen D. (2012) Mapping out the multistage fibrillation of glucagon. FEBS J. 279, 752–765 [DOI] [PubMed] [Google Scholar]
- 26. Rakhit R., Cunningham P., Furtos-Matei A., Dahan S., Qi X. F., Crow J. P., Cashman N. R., Kondejewski L. H., Chakrabartty A. (2002) Oxidation-induced misfolding and aggregation of superoxide dismutase and its implications for amyotrophic lateral sclerosis. J. Biol. Chem. 277, 47551–47556 [DOI] [PubMed] [Google Scholar]
- 27. Mogensen J. E., Ipsen H., Holm J., Otzen D. E. (2004) Elimination of a misfolded folding intermediate by a single point mutation. Biochemistry 43, 3357–3367 [DOI] [PubMed] [Google Scholar]
- 28. Lorenzen N., Cohen S. I., Nielsen S. B., Herling T. W., Christiansen G., Dobson C. M., Knowles T. P., Otzen D. (2012) Role of elongation and secondary pathways in s6 amyloid fibril growth. Biophys. J. 102, 2167–2175 [DOI] [PMC free article] [PubMed] [Google Scholar]
- 29. Andrade M. A., Chacón P., Merelo J. J., Morán F. (1993) Evaluation of secondary structure of proteins from UV circular dichroism spectra using an unsupervised learning neural network. Protein Eng. 6, 383–390 [DOI] [PubMed] [Google Scholar]
- 30. Goto Y., Fink A. L. (1989) Conformational states of β-lactamase. Molten-globule states at acidic and alkaline pH with high salt. Biochemistry 28, 945–952 [DOI] [PubMed] [Google Scholar]
- 31. Alizadeh-Pasdar N., Li-Chan E. C. (2000) Comparison of protein surface hydrophobicity measured at various pH values using three different fluorescent probes. J. Agric. Food Chem. 48, 328–334 [DOI] [PubMed] [Google Scholar]
- 32. Biancalana M., Koide S. (2010) Molecular mechanism of thioflavin-T binding to amyloid fibrils. Biochim. Biophys. Acta 1804, 1405–1412 [DOI] [PMC free article] [PubMed] [Google Scholar]
- 33. Groenning M. (2010) Binding mode of thioflavin T and other molecular probes in the context of amyloid fibrils. Current status. J. Chem. Biol. 3, 1–18 [DOI] [PMC free article] [PubMed] [Google Scholar]
- 34. LeVine H. (1995) Thioflavine T interaction with amyloid β-sheet structures Amyloid 2, 1–6 [Google Scholar]
- 35. Haris P. I., Robillard G. T., van Dijk A. A., Chapman D. (1992) Potential of 13C and 15N labeling for studying protein-protein interactions using Fourier transform infrared spectroscopy. Biochemistry 31, 6279–6284 [DOI] [PubMed] [Google Scholar]
- 36. Haris P. I. (2010) Can infrared spectroscopy provide information on protein-protein interactions? Biochem. Soc. Trans. 38, 940–946 [DOI] [PubMed] [Google Scholar]
- 37. Zandomeneghi G., Krebs M. R., McCammon M. G., Fändrich M. (2004) FTIR reveals structural differences between native β-sheet proteins and amyloid fibrils. Protein Sci. 13, 3314–3321 [DOI] [PMC free article] [PubMed] [Google Scholar]
- 38. Rambaldi D. C., Zattoni A., Reschiglian P., Colombo R., De Lorenzi E. (2009) In vitro amyloid Aβ(1–42) peptide aggregation monitoring by asymmetrical flow field-flow fractionation with multi-angle light scattering detection. Anal. Bioanal. Chem. 394, 2145–2149 [DOI] [PubMed] [Google Scholar]
- 39. Hoppe C. C., Nguyen L. T., Kirsch L. E., Wiencek J. M. (2008) Characterization of seed nuclei in glucagon aggregation using light scattering methods and field-flow fractionation. J. Biol. Eng. 2, 1–11 [DOI] [PMC free article] [PubMed] [Google Scholar]
- 40. Andreasen M., Nielsen S. B., Mittag T., Bjerring M., Nielsen J. T., Zhang S., Nielsen E. H., Jeppesen M., Christiansen G., Besenbacher F., Dong M., Nielsen N. C., Skrydstrup T., Otzen D. E. (2012) Modulation of fibrillation of hIAPP core fragments by chemical modification of the peptide backbone. Biochim. Biophys. Acta 1824, 274–285 [DOI] [PubMed] [Google Scholar]
- 41. Silveira J. R., Hughson A. G., Caughey B. (2006) Fractionation of prion protein aggregates by asymmetrical flow field-flow fractionation. Methods Enzymol. 412, 21–33 [DOI] [PubMed] [Google Scholar]
- 42. Schokker E., Singh H., Pinder D., Creamer L. (2000) Heat-induced aggregation of β-lactoglobulin AB at pH 2.5 as influenced by ionic strangth and protein concentration. Int. Dairy J. 10, 233–240 [Google Scholar]
- 43. Schokker E., Singh H., Pinder D., Norris G., Creamer L. (1999) Characterization of intermediates formed during heat-induced aggregation of β-lactoglobulin AB at neutral pH. Int. Dairy J. 9, 791–800 [Google Scholar]
- 44. Fraunhofer W., Winter G. (2004) The use of asymmetrical flow field-flow fractionation in pharmaceutics and biopharmaceutics. Eur. J. Pharm. Biopharm. 58, 369–383 [DOI] [PubMed] [Google Scholar]
- 45. Wahlund K. G., Giddings J. C. (1987) Properties of an asymmetrical flow field-flow fractionation channel having one permeable wall. Anal. Chem. 59, 1332–1339 [DOI] [PubMed] [Google Scholar]
- 46. Volles M. J., Lansbury P. T. (2002) Vesicle permeabilization by protofibrillar α-synuclein is sensitive to Parkinson disease-linked mutations and occurs by a pore-like mechanism. Biochemistry 41, 4595–4602 [DOI] [PubMed] [Google Scholar]
- 47. Sokolov Y., Kozak J. A., Kayed R., Chanturiya A., Glabe C., Hall J. E. (2006) Soluble amyloid oligomers increase bilayer conductance by altering dielectric structure. J. Gen. Physiol. 128, 637–647 [DOI] [PMC free article] [PubMed] [Google Scholar]
- 48. Nesgaard L., Vad B., Christiansen G., Otzen D. (2009) Kinetic partitioning between aggregation and vesicle permeabilization by modified ADan. Biochim. Biophys. Acta 1794, 84–93 [DOI] [PubMed] [Google Scholar]
- 49. Arispe N., Rojas E., Pollard H. B. (1993) Alzheimer disease amyloid β protein forms calcium channels in bilayer membranes. blockade by tromethamine and aluminum. Proc. Natl. Acad. Sci. U.S.A. 90, 567–571 [DOI] [PMC free article] [PubMed] [Google Scholar]
- 50. Mirzabekov T. A., Lin M. C., Kagan B. L. (1996) Pore formation by the cytotoxic islet amyloid peptide amylin. J. Biol. Chem. 271, 1988–1992 [DOI] [PubMed] [Google Scholar]
- 51. Quist A., Doudevski I., Lin H., Azimova R., Ng D., Frangione B., Kagan B., Ghiso J., Lal R. (2005) Amyloid ion channels. A common structural link for protein-misfolding disease. Proc. Natl. Acad. Sci. U.S.A. 102, 10427–10432 [DOI] [PMC free article] [PubMed] [Google Scholar]
- 52. Yamaguchi K., Takahashi S., Kawai T., Naiki H., Goto Y. (2005) Seeding-dependent propagation and maturation of amyloid fibril conformation. J. Mol. Biol. 352, 952–960 [DOI] [PubMed] [Google Scholar]
- 53. Lasagna-Reeves C. A., Glabe C. G., Kayed R. (2011) Amyloid-β annular protofibrils evade fibrillar fate in Alzheimer disease brain. J. Biol. Chem. 286, 22122–22130 [DOI] [PMC free article] [PubMed] [Google Scholar]
- 54. Rosenberg M. E., Tervo T. M., Petroll W. M., Vesaluoma M. H. (2000) In vivo confocal microscopy of patients with corneal recurrent erosion syndrome or epithelial basement membrane dystrophy. Ophthalmology 107, 565–573 [DOI] [PubMed] [Google Scholar]
- 55. Kahn S. E., Andrikopoulos S., Verchere C. B. (1999) Islet amyloid. A long-recognized but underappreciated pathological feature of type 2 diabetes. Diabetes 48, 241–253 [DOI] [PubMed] [Google Scholar]
- 56. Kisilevsky R., Fraser P. E. (1997) A β amyloidogenesis. Unique, or variation on a systemic theme? Crit. Rev. Biochem. Mol. Biol. 32, 361–404 [DOI] [PubMed] [Google Scholar]
- 57. Nielsen S. B., Yde P., Giehm L., Sundbye S., Christiansen G., Mathiesen J., Jensen M. H., Jensen P. H., Otzen D. E. (2012) Multiple roles of heparin in the aggregation of p25α. J. Mol. Biol. 421, 601–615 [DOI] [PubMed] [Google Scholar]
- 58. Motamedi-Shad N., Garfagnini T., Penco A., Relini A., Fogolari F., Corazza A., Esposito G., Bemporad F., Chiti F. (2012) Rapid oligomer formation of human muscle acylphosphatase induced by heparan sulfate. Nat. Struct. Mol. Biol 19, 547–554 [DOI] [PubMed] [Google Scholar]
- 59. Kisilevsky R. (2000) Review. Amyloidogenesis-unquestioned answers and unanswered questions. J. Struct. Biol. 130, 99–108 [DOI] [PubMed] [Google Scholar]
- 60. Ancsin J. B. (2003) Amyloidogenesis. Historical and modern observations point to heparan sulfate proteoglycans as a major culprit. Amyloid 10, 67–79 [DOI] [PubMed] [Google Scholar]
- 61. McLaurin J., Yang D., Yip C. M., Fraser P. E. (2000) Review. Modulating factors in amyloid-β fibril formation. J. Struct. Biol. 130, 259–270 [DOI] [PubMed] [Google Scholar]
- 62. Maji S. K., Perrin M. H., Sawaya M. R., Jessberger S., Vadodaria K., Rissman R. A., Singru P. S., Nilsson K. P., Simon R., Schubert D., Eisenberg D., Rivier J., Sawchenko P., Vale W., Riek R. (2009) Functional amyloids as natural storage of peptide hormones in pituitary secretory granules. Science 325, 328–332 [DOI] [PMC free article] [PubMed] [Google Scholar]
- 63. Macchi F., Hoffmann S. V., Carlsen M., Vad B., Imparato A., Rischel C., Otzen D. E. (2102) Mechanical stress affects glucagon fibrillation kinetics and fibril structure. Langmuir 27, 12539–12549 [DOI] [PubMed] [Google Scholar]
- 64. Pedersen J. S., Flink J. M., Dikov D., Otzen D. E. (2006) Sulfates dramatically stabilize a salt-dependent type of glucagon fibrils. Biophys. J. 90, 4181–4194 [DOI] [PMC free article] [PubMed] [Google Scholar]
- 65. Pedersen J. S., Dikov D., Flink J. L., Hjuler H. A., Christiansen G., Otzen D. E. (2006) The changing face of glucagon fibrillation. Structural polymorphism and conformational imprinting. J. Mol. Biol. 355, 501–523 [DOI] [PubMed] [Google Scholar]
- 66. Makarava N., Baskakov I. V. (2008) The same primary structure of the prion protein yields two distinct self-propagating states. J. Biol. Chem. 283, 15988–15996 [DOI] [PMC free article] [PubMed] [Google Scholar]
- 67. Andersen C. B., Otzen D., Christiansen G., Rischel C. (2007) Glucagon amyloid-like fibril morphology is selected via morphology-dependent growth inhibition. Biochemistry 46, 7314–7324 [DOI] [PubMed] [Google Scholar]
- 68. Petkova A. T., Leapman R. D., Guo Z., Yau W. M., Mattson M. P., Tycko R. (2005) Self-propagating, molecular-level polymorphism in Alzheimer β-amyloid fibrils. Science 307, 262–265 [DOI] [PubMed] [Google Scholar]


