

Abstract
Objectives. We examined whether public schools in states with specific and stringent physical education (PE) laws, as assessed by the Physical Education–Related State Policy Classification System (PERSPCS), available on the Classification of Laws Associated with School Students (C.L.A.S.S.) Web site, reported more weekly PE time in the most recent School Health Policies and Programs Survey (SHPPS).
Methods. Schools (n = 410) were grouped by their state’s PERSPCS time requirement scores (none, nonspecific requirement, or specific requirement). Average weekly school-level PE was calculated using the SHPPS-reported PE minutes. Weighted analyses determined if PE minutes/week differed by PERSPCS group.
Results. Schools in states with specific requirement laws averaged over 27 and 60 more PE minutes/week at the elementary and middle school levels, respectively, compared with schools within states with nonspecific laws and over 40 and 60 more PE minutes per week, respectively, compared with elementary and middle schools in states with no laws. High school results were nonsignificant.
Conclusions. Public health guidelines recommend at least 60 minutes of daily physical activity for children, and PE may further this goal. Strong codified law with specific time requirements for PE may be an important tool contributing toward adequate PE time and daily physical activity recommendations.
It is estimated that over a third of school-aged children are overweight or obese, and rates of childhood obesity do not appear to be declining.1 Children who are overweight are much more likely to become obese as adults, whereas only 9% of children who maintain a normal weight during childhood become obese as adults.2 In addition, overweight and obesity in childhood confers increased risk for the leading causes of morbidity and premature death later in life,3 and increased health care costs attributable to obesity appear as early as adolescence and multiply in adulthood.4 Maintaining an adequate level of physical activity has been associated with healthy weight, weight loss maintenance,5 and greater likelihood of physical activity in adulthood.6 For these reasons, the national Physical Activity Guidelines for Americans recommend that children receive a minimum of 60 minutes of daily physical activity.7 Recognizing that children spend most of their day in school, physical education (PE) provides a natural opportunity for children to obtain a significant portion of the recommended physical activity, and, therefore, PE has been identified as a prime target to improve public health.8,9
However, not all PE programs are alike. Quality PE programs that meet school health guidelines and the National Association for Sport and Physical Education (NASPE) standards for PE participation, which provide standards for time allotment, curriculum, and staffing, are important because some evidence indicates that meeting these standards has been associated with increased overall physical activity, particularly when at least half of a PE class is spent being physically active.8,10,11 Yet, although school health guidelines support recommendations for school-based physical activity8,12 and national standards specifying amount of time for school PE exist,11 there is great variation in PE practices across schools because states and school districts vary in their policies and schools vary in their degree of implementation of these policies, which may affect both quantity and quality of PE.13–17 When considering PE time, both quantity and quality are necessary to advance public health goals. Quantity is reflected in minutes allotted to PE, and quality is indicated by the amount of physical activity that actually occurs in PE classes that may result from policies across multiple areas (e.g., teacher qualification or curriculum standards).
At the state level, the 2 primary official public policy levers, hereafter referred to as “codified law,” utilized for developing school-based PE policy are: (1) statutory laws (laws enacted by the given state legislature) and (2) administrative laws (rule and regulations developed by state executive branch agencies, such as the Department of Education).18
On the surface, a “plain-letter” review of the codified law in 2 states may indicate that the provisions of the laws governing PE requirements are fairly comparable. However, differences in interpretation and implementation may vary greatly both from state to state as well as across schools within a given state. For example, a state may have no PE-related codified law or have law that recommends rather than requires schools to meet the NASPE guidelines.11 In addition, a number of states have codified law with nonspecific requirements (e.g., requires PE but does not specify frequency or duration requirements), which may result in further variation in PE practices in individual schools within the same state.15
Policy implementation research is only beginning to investigate the association between state laws with school-level PE-related practices.19–21 Few studies to date have focused on the impact of an individual state’s law on changes in physical activity and PE-related practices in schools within the given state. These studies have found that state physical activity and PE-related mandates have led to increased physical activity awareness and participation20 and increased physical activity and PE duration and frequency, although the impact of the laws varies within states by demographic and other characteristics.19,21 However, to our knowledge no study has examined the relationship between codified PE-related laws and school-level practices across grade levels and states.
Related research at a national level using data from the Centers for Disease Control and Prevention (CDC) School Health Policies and Programs Survey (SHPPS) indicated that the majority of states (76%, or 38 states) report requiring or encouraging districts and schools to implement a standardized set of PE guidelines (i.e., the NASPE standards).14 However, despite the appearance of consistency in the SHPPS results regarding PE policy across states, there was great variability in practices at the school level with a relatively small percentage of schools (i.e., 3.8%, 7.9%, and 2.1% of elementary, middle, and high schools, respectively) fully meeting recommended standards for PE (e.g., NASPE standards).14 Also, analyses did not specifically assess the relationship between state-level policy and school practices to determine if relatively stronger policy was associated with more time allotment for PE. The method of policy assessment (i.e., questionnaire) is one possible reason for the variability in PE practices observed in SHPPS schools, despite the appearance of similar state policy incorporating NASPE standards. The SHPPS relies on self-report of state-level policies rather than independent document review and does not differentiate policies that have been codified into law from informal policy or noncodified state-level practices that may result in different practices at the school level.22
Because obesity has been consistently associated with many cancers and policy tracking of health relevant practices has been an important activity for cancer control, the National Cancer Institute’s Physical Education–Related State Policy Classification System (PERSPCS) was created to evaluate the extent and stringency of the codified PE laws for each of the 50 states and the District of Columbia in relation to NASPE standards.15 The PERSPCS uses independent document review to empirically score codified law in relation to NASPE standards and can be used to assess the association between state-level codified law and school practices across states.
The purpose of our study was to determine if schools within states with specific and relatively more stringent PE time-related codified law report more PE time allocation compared to schools within states with nonspecific and relatively weaker codified law. We hypothesized that at each school level, schools would report allocating more PE time if the state in which they resided had specific and more stringent PE time-related laws (i.e., high PERSPCS score) compared with schools in states with either no PE time-related codified law or nonspecific and relatively weaker codified laws (i.e. low PERSPCS score).
METHODS
Data on state PE laws were obtained from the PERSPCS, which is available on the C.L.A.S.S. Web site (http://class.cancer.gov).15 The PERSPCS includes 4 categories related to PE that assess time requirements, staffing requirements, curriculum standards, and assessment of student health-related fitness. Only scores for PE time were used for the present analysis (see the PERSPCS time requirement variable outlined in the “Measures” section). The Westlaw legal database, a commercial legal research database, was the primary electronic database employed to locate codified laws used in the PERSPCS.18 The procedures for extracting and for rating the codified laws have been extensively described elsewhere.15 The 2005 PERSPCS data (i.e., laws effective as of December 31, 2005) were used in this analysis to allow sufficient lag-time between the effective date of the codified laws and reported PE implementation practices as captured by the 2006 SHPPS data collection.
School-Level Physical Education Time Practices in 2006
Data on school-level PE time-related practices were obtained from the SHPPS. The CDC regularly conducts the SHPPS which queries state administrators, district and school officials, and classroom teachers regarding policies and practices related to nutrition and PE and other topics related to school health, with 2006 being the most recent year of data collection.23 The methodology for the SHPPS survey has been previously reported.23 SHPPS school-level data include a nationally representative sample of public and private schools (n = 998).
Inclusion and Exclusion Criteria
Only public schools that reported information regarding minutes of PE were included for analysis, leaving a final sample of 410 schools (145 elementary schools, 131 middle schools, and 134 high schools) included in the analyses (Table 1). Schools excluded from analyses due to nonresponse were more likely to be from high poverty areas (67.4% versus 57.5%; P < .05), but were not significantly different with respect to size, urbanicity, region, and school level.
TABLE 1—
Sample Characteristics of Schools, by Grade Level: School Health Policies and Programs Survey, 2006
| Total (n = 410), No. (%) | Elementary School (n = 145), No. (%) | Middle School (n = 131), No. (%) | High School (n = 134), No. (%) | |
| Urbanicity (urban) | 281 (68.7) | 107 (73.8) | 88 (67.2) | 86 (64.7) |
| Poverty (high) | 235 (57.5) | 78 (53.8) | 78 (59.5) | 79 (59.4) |
| School size (large) | 277 (67.7) | 85 (58.6) | 96 (73.3) | 96 (72.2) |
| PERSPCS group | ||||
| No requirement | 17 (11.7) | 13 (9.9) | 114 (85.0)a | |
| Nonspecific requirement | 89 (61.4) | 89 (67.9) | ||
| Specific requirement | 39 (26.9) | 29 (22.1) | 20 (15.0) |
Note. PERSPCS = Physical Education–Related State Policy Classification System.
No requirement was combined with nonspecific requirement because of the small sample (n = 2) for no requirement and nonspecific recommendation at the high school level only. Note, among schools with specific requirements for physical education, 11 elementary schools, 14 middle schools, and 10 high schools met the National Association for Sport and Physical Education guideline (150min/wk of physical education for elementary schools and 220min/wk for middle schools and high schools). A map of US states by their PERSPCS physical education time category can be found at http://class.cancer.gov/map_pe.aspx.
Although sample weights for each school were provided by the CDC (http://www.cdc.gov/healthyyouth/shpps/2006/data), these weights were based on a full sample of public and private schools and do not account for potential response bias among schools that did not provide information on minutes of PE. Thus, we reweighted to account for school type (i.e., private schools excluded) and nonresponse (e.g., poverty level) at each school level so that analyses with sampled schools would be appropriately weighted and nationally representative.
Measures
Independent variable: PERSPCS PE time requirement group.
This variable measured state codified law related to PE time allotment at each school level (i.e., elementary, middle, and high school) and was created by recoding the original PERSPCS score. PERSPCS scores in 2005 were used to classify the states where schools resided into 1 of 3 groups (0 = no requirement; 1 = nonspecific requirement; 2 = specific requirement) on the basis of their codified law for PE time allotment as follows. The no requirement group (PERSPCS score = 0 or 1) included states without codified law requiring PE time allotment. The nonspecific requirement group (PERSPCS score = 2) included states with codified law requiring PE but not specifying a minimum time allotment. The specific requirement group (PERSPCS scores = 3, 4, and 5) included states with codified law requiring a specific minimum PE time allotment. Relatively higher ratings reflect more stringent laws (i.e., the state codified law requires rather than recommends PE, and the codified law identifies a minimum weekly allotment of PE with the highest rating coinciding with the NASPE standard for PE time allotment [e.g., 150 minutes/week of PE for elementary schools and 225 minutes/week for middle schools and high schools]).11 The recoding used to form PERSPCS grouping was consistent with recent studies differentiating PE policy strength demarcations (i.e., no policy, weak policy, and strong policy, respectively).16,24
Dependent Variable: SHPPS PE minutes per week.
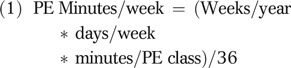
For each grade, the SHHPS school survey assessed: “How many weeks during the school year are ___graders scheduled to take PE? On average how many days per week are ___graders scheduled to take PE? On average, how many minutes is each session of PE scheduled to last?” Time for PE in each grade was calculated according to the following formula, which standardized PE time for each grade according to a 36-week school year. PE minutes per week for each grade were averaged by school level (elementary, middle, or high school) to yield the school’s average PE minutes per week.
 |
Covariates.
School level covariates were obtained from the SHPPS data file and included dummy coding for school size (small or large), school poverty rate (low or high), and school urbanicity (rural or urban; Table 1). The methodology to derive the SHPPS covariates has been previously reported.23
Data Analyses
To test the hypothesis that at each school level, higher PERSPCS group scores would be positively associated with schools’ reported time allotment for PE, the SAS 9.2 (SAS Institute, Cary, NC) PROC GENMOD procedure, which incorporated both state clustering of data and the adjusted SHPPS sampling weights, was used to model schools’ PE minutes per week as a function of their state’s PERSPCS score grouping (no requirement, nonspecific requirement, specific requirement) and demographic covariates. Significance tests of GENMOD regression coefficients were based on standard errors computed using a jackknife procedure. Separate analyses were conducted by school level, data were transformed as necessary to account for departures from normality, and multiple comparison posthoc testing determined differences between PERSPCS grouping. Data transformations (Log10) on PE minutes per week were required for elementary and high school GENMOD analyses to account for severe skewness, and data were back transformed into their original scale for ease of interpretation. Additionally, because there were too few schools (1.5%) without any PE requirement at the high school level, the high school PERSPCS grouping score was collapsed from 3 to 2 levels (no PE requirement or requirement nonspecific versus requirement specific).
RESULTS
After we controlled for demographic covariates and state clustering, elementary schools in states with specific requirement laws (mean = 104.8; SE = 11.4) had significantly more PE minutes per week than did schools in states with no requirement laws (mean = 64.5; SE = 9.2) and schools in states that only had nonspecific requirement laws (mean = 78.1, SE = 5.4; Tables 2 and 3). Moreover, schools in states with nonspecific requirement laws were not significantly different from schools within states whose law had no requirement for PE time allotment.
TABLE 2—
Parameter Estimates From Linear Regressions of Physical Education Minutes/Week among Schools, by State’s PERSPCS Grouping and Demographic Covariates: School Health Policies and Programs Survey (SHPPS), 2006
| Elementary School |
Middle School |
High School |
||||
| Model Parameters | B (SE) | F | B (SE) | F | B (SE) | F |
| Intercept | 86.5 (12.9) | 191.2 (17.7) | 190.9 (50.1) | |||
| Urbanicity (nonurban) | 25.3 (11.4) | 2.21* | 11.9 (19.8) | 0.36 | −1.9 (20.3) | 0.01 |
| Poverty (high) | 2.7 (9.3) | 0.09 | 35.5 (12.7) | 7.78** | 12.2 (17.4) | 0.49 |
| School size (large) | 8.5 (8.5) | 1.09 | −12.3 (17.2) | 0.51 | 9.3 (18.4) | 0.26 |
| PERSPCS group | 8.19** | 20.67** | 0.84 | |||
| No requirement | −40.2 (14.0) | −59.2 (29.2) | ||||
| Nonspecific requirement | −26.7 (12.9) | −60.6 (13.9) | −40.0 (43.6) | |||
| Specific requirement (ref) | ||||||
Note. PERSPCS = Physical Education–Related State Policy Classification System. Parameters estimates, in minutes per week, are adjusted for other factors in the model and account for clustering by state. The no requirement group was combined with the nonspecific requirement group because of the small sample (n = 2) for no requirement at the high school level only. A map of US states by PERSPCS physical education time category can be found at http://class.cancer.gov/map_pe.aspx.
*P < .05; **P < .01.
TABLE 3—
Average Physical Education Minutes/Week in Schools, by State’s PERSPCS Grouping: School Health Policies and Programs Survey (SHPPS), 2006
| Elementary School, Mean (SE) | Middle School, Mean (SE) | High School, Mean (SE) | |
| PERSPCS group | |||
| No requirement | 64.58x (9.23) | 149.49x (29.26) | |
| Nonspecific requirement | 78.06x (5.41) | 148.15x (8.39) | 160.59 (7.64) |
| Specific requirement | 104.76y (11.37) | 208.74y (10.80) | 200.74 (44.48) |
Note. PERSPCS = Physical Education–Related State Policy Classification System. Analyses are adjusted for demographic covariates and clustering of schools within state. The no requirement group was combined with nonspecific requirement group because of the small sample (n = 2) for the no requirement group at the high school level only.
Means with different superscripts within a school level are significantly different from each other at P < .05 (e.g., elementary schools in the specific requirement states report significantly more physical education than do elementary schools in states with either no requirement or nonspecific requirement laws for physical education).
After we controlled for demographic covariates and state clustering, middle schools in states with specific requirement laws (mean = 208.7; SE = 10.8) had significantly more PE minutes per week than did schools in states with no requirement laws (mean = 149.5, SE = 29.3) and schools in states that only had nonspecific requirement laws (mean = 148.2, SE = 8.4; Tables 2 and 3). Moreover, schools in states with nonspecific requirement laws were not significantly different from schools within states whose law had no requirement for PE time allotment (Tables 2 and 3).
As can be seen in Tables 2 and 3, no factors were significantly associated with weekly PE time at the high school level.
DISCUSSION
Our study assessed the relationship between codified PE-related state laws and time allotment for PE in a nationally representative sample of schools across the United States. We found partial support for the hypothesis that more stringent PE laws would be associated with more PE allotment in schools. At both the elementary and middle school levels, schools within states with codified law requiring a specific minimum amount of PE (i.e., strong law) reported more time allotment for PE than did schools within states whose law either required a nonspecific amount of PE (i.e., weak law) or contained no requirement for PE. Thus, a nonspecific requirement for PE in codified law (i.e., weak law) appeared to be no more effective than having no law related to PE time allotment or law only recommending PE. At the high school level, stringency of PE law was not significantly associated with reported PE time allotment.
Schools in states with strong PE time laws averaged over 60 minutes more of reported PE per week at the middle school level and approximately 27 minutes more reported PE at the elementary school level as compared with schools within states with weak PE time laws that require PE but are silent with respect to time allotment.
Our nationally representative data extend and compare well with findings from analyses of individual state laws that indicate that setting daily minimum standards for PE increases frequency of PE.19–21 However, data have yet to reveal an association between states’ codified law and effects on school PE policy at the high school level. This may be because of lack of variability at the high school level where 85% of high schools in our sample had similar PE time allotment laws requiring, but not specifying, the amount of PE (i.e., weak law). Because a nonspecific requirement on PE time allows for block scheduling, it has been observed that block scheduling, which occurs frequently at the high school level, may give the appearance of large PE time allocations when PE is actually absent during off blocks.16 The lack of variability of codified law for PE time allotment at the high school level may also be attributed to the long standing history of PE as a public school graduation requirement without a specific time requirement.
The association between stringency of codified law with actual time allotment in elementary and middle schools is particularly important because national data show that children at these school ages experience an onset decline in overall physical activity and fitness along with an increase in sedentary behavior.25–27 Decline in physical activity is most pronounced as children transition from elementary and middle school to high school and is observed whether physical activity is measured by self-report or by objective assessment.26 Similarly, there is an increase in sedentary behavior as children transition from primary to secondary school.25 Though only available for middle school– and high school–aged children, cardiorespiratory fitness data show that only 55.3% of middle school aged children and approximately 70% of high school aged children meet national fitness standards.10,27 Data also indicate that high school students in states with strong PE law spend more time in PE and that PE contributes toward overall physical activity.28 Although there are few studies assessing the contribution of PE to overall physical activity, findings suggest that children do not compensate for less PE in school by adding physical activity outside of school, and thus, school-based PE may be an important contributor to overall physical activity.10,28
However, even among schools within states with specific PE time requirement laws, average PE time was below school health guidelines and the NASPE recommended standard (i.e., 150 min/week and 225 min/week for elementary schools and middle and high schools, respectively), with few (8.5%) schools fully meeting NASPE guidelines for PE time.
Limitations
Our results should be viewed within the context of the following limitations. As with all cross-sectional studies, we only examined the relationship between state laws and school policies and cannot determine causation. Second, the SHPPS data are based on self-reported surveys, and, as such, are subject to respondent knowledge, question interpretation, and social desirability. Third, school-level SHPPS data did not allow us to differentiate time spent being physically active from overall PE time. This is an important distinction because time spent being physically active in PE may be considerably less than time allocated, and quality PE programs require that students be physically active at least 50% of a class period.29,30 We were unable to assess this aspect of PE and other features affecting quality of PE in the present analyses that have been shown to significantly improve actual physical activity levels.31 Thus, a major limitation revealed by our study is that the data systems (i.e., PERSPCS and SHPPS) do not fully reflect issues concerning quality PE. Improvements to the state policy coding schemes (e.g., PERSPCS) and refinements to surveillance systems to capture important elements related to quality in PE may be needed to further public health goals. Last, this study only examined the relationship between state laws and school practices but did not account for the potential mediating impact of district policies on school practices. However, state codified law establishes minimum PE time allotments that districts must implement in schools. Another consideration is that noncodified state policies (guidelines, recommendations, procedures) are not captured by PERSPCS. As such, states may have other policies that influence school PE, but because these policies were not formally codified into law, they were not accounted for in this analysis. However, these noncodified policies would not carry the force of law and allow considerable discretion with respect to implementation.
While future studies should examine the multilevel relationship among state, district, and school practices, examination of direct effects of state law on districts and schools is paramount because state law establishes the minimum PE time allotment in schools. Our data demonstrate that a specific minimum requirement in state codified law (i.e, strong law) was particularly important at the elementary and middle school levels where PE time was only significantly greater among schools within states with strong codified law as compared with schools within states with weak codified law.
Conclusions
Our analyses indicate that strong codified state law requiring specific minimum PE time allotment is associated with approximately 27 and 60 min/week more PE time allotment among US elementary and middle schools, respectively, as compared with weak law which requires PE, but does not specify a minimum requirement. These data suggest that codified state PE laws should both require and specify a minimum amount of PE.
Acknowledgments
This work was partially supported by the National Cancer Institute by a contract to the University of Illinois at Chicago Institute for Health Research and Policy (HHSN261201000350P) and to the MayaTech Corporation (HHSP23320095645WC)
Human participant protection
The study involved secondary data analyses of publically available data sources and is exempted research under the policies of the National Institutes of Health Office of Human Subjects Protection.
References
- 1.Ogden CL, Carroll MD, Curtin LR, Lamb MM, Flegal KM. Prevalence of high body mass index in US children and adolescents, 2007–2008. JAMA. 2010;303(3):242–249. [DOI] [PubMed] [Google Scholar]
- 2.Freedman DS, Khan LK, Serdula MK, Dietz WH, Srinivasan SR, Berenson GS. Racial differences in the tracking of childhood BMI to adulthood. Obes Res. 2005;13(5):928–935. [DOI] [PubMed] [Google Scholar]
- 3.Reilly JJ, Kelly J. Long-term impact of overweight and obesity in childhood and adolescence on morbidity and premature mortality in adulthood: systematic review. Int J Obes (Lond) 2011;35(7):891–898. [DOI] [PubMed] [Google Scholar]
- 4.Finkelstein EA, Trogdon JG. Public health interventions for addressing childhood overweight: analysis of the business case. Am J Public Health. 2008;98(3):411–415. [DOI] [PMC free article] [PubMed] [Google Scholar]
- 5.Jakicic JM. The effect of physical activity on body weight. Obesity (Silver Spring). 2009;17(Suppl 3):S34–S38. [DOI] [PubMed] [Google Scholar]
- 6.Telama R. Tracking of physical activity from childhood to adulthood: a review. Obes Facts. 2009;2(3):187–195. [DOI] [PMC free article] [PubMed] [Google Scholar]
- 7.US Department of Health and Human Services. 2008 Physical Activity Guidelines for Americans. Washington, DC: US Department of Health and Human Services; 2008. [Google Scholar]
- 8.Kahn EB, Ramsey LT, Brownson RCet al. The effectiveness of interventions to increase physical activity. A systematic review. Am J Prev Med. 2002;22(4, Suppl):73–107. [DOI] [PubMed] [Google Scholar]
- 9.Brownson RC, Chriqui JF, Burgeson CR, Fisher MC, Ness RB. Translating epidemiology into policy to prevent childhood obesity: the case for promoting physical activity in school settings. Ann Epidemiol. 2010;20(6):436–444. [DOI] [PMC free article] [PubMed] [Google Scholar]
- 10.Pate RR, Ward DS, O’Neill JR, Dowda M. Enrollment in physical education is associated with overall physical activity in adolescent girls. Res Q Exerc Sport. 2007;78(4):265–270. [DOI] [PubMed] [Google Scholar]
- 11.National Association for Sport and Physical Education. Moving Into the Future: National Standards for Physical Education. 2nd ed. Reston, VA: McGraw-Hill; 2004. [Google Scholar]
- 12.Centers for Disease Control and Prevention. School health guidelines to promote healthy eating and physical activity. MMWR Recomm Rep. 2011;60(RR-5):1–76. [PubMed] [Google Scholar]
- 13.Chriqui JF, Tynan M, Agurs-Collins T, Masse LC. Will web-based research suffice when collecting US school district policies? The case of physical education and school-based nutrition policies. Int J Behav Nutr Phys Act. 2008;5:64. [DOI] [PMC free article] [PubMed] [Google Scholar]
- 14.Lee SM, Burgeson CR, Fulton JE, Spain CG. Physical education and physical activity: results from the School Health Policies and Programs Study 2006. J Sch Health. 2007;77(8):435–463. [DOI] [PubMed] [Google Scholar]
- 15.Masse LC, Chriqui JF, Igoe JFet al. Development of a Physical Education-Related State Policy Classification System (PERSPCS). Am J Prev Med. 2007;33(4, Suppl):S264–S276. [DOI] [PubMed] [Google Scholar]
- 16.Chriqui JF, Schneider L, Chaloupka FJet al. School District Wellness Policies: Evaluating Progress and Potential for Improving Children’s Health Three Years After the Federal Mandate. School Years 2006–07, 2007–08 and 2008–09. Vol. 2. Chicago, IL: Bridging the Gap Program, Health Policy Center, Institute for Health Research and Policy, University of Illinois at Chicago; 2010. [Google Scholar]
- 17.Turner L, Chaloupka FJ, Chriqui JF, Sandoval A. School Policies and Practices to Improve Health and Prevent Obesity: National Elementary School Survey Results: School Years 2006–07 and 2007–08. Chicago, IL: Bridging the Gap, Health Policy Center, University of Illinois at Chicago; 2010. [Google Scholar]
- 18.Mersky RM. Fundementals of Legal Research. 8th ed. New York: Foundation Press; 2002. [Google Scholar]
- 19.Barroso CS, Kelder SH, Springer AEet al. Senate Bill 42: implementation and impact on physical activity in middle schools. J Adolesc Health. 2009;45(3, Suppl):S82–S90. [DOI] [PMC free article] [PubMed] [Google Scholar]
- 20.Evenson KR, Ballard K, Lee G, Ammerman A. Implementation of a school-based state policy to increase physical activity. J Sch Health. 2009;79(5):231–238, quiz 244–246. [DOI] [PubMed] [Google Scholar]
- 21.Kelder SH, Springer AS, Barroso CSet al. Implementation of Texas Senate Bill 19 to increase physical activity in elementary schools. J Public Health Policy. 2009;30(Suppl 1):S221–S247. [DOI] [PMC free article] [PubMed] [Google Scholar]
- 22.Brownson RC, Chriqui JF, Stamatakis KA. Understanding evidence-based public health policy. Am J Public Health. 2009;99(9):1576–1583. [DOI] [PMC free article] [PubMed] [Google Scholar]
- 23.Kyle TM, Brener ND, Kann Let al. Methods: School Health Policies and Programs Study 2006. J Sch Health. 2007;77(8):398–407. [DOI] [PubMed] [Google Scholar]
- 24.Schwartz MB, Lund AE, Grow HMet al. A comprehensive coding system to measure the quality of school wellness policies. J Am Diet Assoc. 2009;109(7):1256–1262. [DOI] [PubMed] [Google Scholar]
- 25.Matthews CE, Chen KY, Freedson PSet al. Amount of time spent in sedentary behaviors in the United States, 2003-2004. Am J Epidemiol. 2008;167(7):875–881. [DOI] [PMC free article] [PubMed] [Google Scholar]
- 26.McMurray RG, Harrell JS, Bangdiwala SI, Hu J. Tracking of physical activity and aerobic power from childhood through adolescence. Med Sci Sports Exerc. 2003;35(11):1914–1922. [DOI] [PubMed] [Google Scholar]
- 27.Pate RR, Wang CY, Dowda M, Farrell SW, O’Neill JR. Cardiorespiratory fitness levels among US youth 12 to 19 years of age: findings from the 1999–2002 National Health and Nutrition Examination Survey. Arch Pediatr Adolesc Med. 2006;160(10):1005–1012. [DOI] [PubMed] [Google Scholar]
- 28.Cawley J, Meyerhoefer C, Newhouse D. The impact of state physical education requirements on youth physical activity and overweight. Health Econ. 2007;16(12):1287–1301. [DOI] [PubMed] [Google Scholar]
- 29.Fairclough S, Stratton G. Physical activity levels in middle and high school physical education: A review. Pediatr Exerc Sci. 2005;17(3):217–236. [Google Scholar]
- 30.Fairclough SJ, Stratton G. A review of physical activity levels during elementary school physical education. J Teach Phys Educ. 2006;25(2):239–257. [Google Scholar]
- 31.Slingerland M, Borghouts L. Direct and Indirect Influence of Physical Education-Based Interventions on Physical Activity: A Review. J Phys Act Health. 2011;8(6):866–878. [DOI] [PubMed] [Google Scholar]