

Abstract
Background
Circadian rhythm pathways influence the expression patterns of as much as 31% of the Arabidopsis genome through complicated interaction pathways, and have been found to be significantly disrupted by biotic and abiotic stress treatments, complicating treatment-response gene discovery methods due to clock pattern mismatches in the fold change-based statistics. The PRIISM (Pattern Recomposition for the Isolation of Independent Signals in Microarray data) algorithm outlined in this paper is designed to separate pattern changes induced by different forces, including treatment-response pathways and circadian clock rhythm disruptions.
Results
Using the Fourier transform, high-resolution time-series microarray data is projected to the frequency domain. By identifying the clock frequency range from the core circadian clock genes, we separate the frequency spectrum to different sections containing treatment-frequency (representing up- or down-regulation by an adaptive treatment response), clock-frequency (representing the circadian clock-disruption response) and noise-frequency components. Then, we project the components’ spectra back to the expression domain to reconstruct isolated, independent gene expression patterns representing the effects of the different influences.
By applying PRIISM on a high-resolution time-series Arabidopsis microarray dataset under a cold treatment, we systematically evaluated our method using maximum fold change and principal component analyses. The results of this study showed that the ranked treatment-frequency fold change results produce fewer false positives than the original methodology, and the 26-hour timepoint in our dataset was the best statistic for distinguishing the most known cold-response genes. In addition, six novel cold-response genes were discovered. PRIISM also provides gene expression data which represents only circadian clock influences, and may be useful for circadian clock studies.
Conclusion
PRIISM is a novel approach for overcoming the problem of circadian disruptions from stress treatments on plants. PRIISM can be integrated with any existing analysis approach on gene expression data to separate circadian-influenced changes in gene expression, and it can be extended to apply to any organism with regular oscillations in gene expression patterns across a large portion of the genome.
Background
Differential gene expression studies typically use the fold change statistic (the ratio of mRNA quantities between two samples) as input, and have been used to discover genes involved in adaptive stress responses which have not been previously characterized (i.e., “novel genes”) [1]. Specifically, to correct for changes in gene expression induced by non-treatment related influences, fold-change values for time-series data are usually calculated using treatment and control data at every timepoint [1]. One of the major factors causing gene oscillations under control conditions is the molecular circadian clock, which influences physiology and metabolism in preparation for predictable changes in light and temperature [2]. However, a wide range of biotic and abiotic stress treatments have been shown to disrupt rhythmic clock patterns through amplitude changes or phase shifts [3-8], resulting in significant fold changes for genes which are clock-influenced but are not involved in direct stress response. Figure1 demonstrates that genes can be differentially regulated due to direct stress responses (I), indirectly differentially regulated through disruption of clock pathways induced by the stress (II) or a combination of both (III). Additional complications in regulation patterns arise from the complexity of transcription factor pathways, in which targets may be regulated by clock components directly or through interactions with their transcription factors (Figure1). For this reason, novel treatment-response gene discovery methods are complicated by the disruption of synchronization of the circadian rhythm pathways, but this complexity is not reflected in existing methods including fold change studies, clustering analysis approaches, and more complex time-serial-based algorithms [1,2,5,6,9-17].
Figure 1.

Biotic and abiotic stresses both directly and indirectly influence target gene expression patterns. Genes found to be differentially expressed may be influenced by (I) only direct treatment influences, (II) only indirect circadian-clock disruption influences, or (III) both direct treatment response and indirect clock influences.
In this paper, we present the PRIISM (Pattern Recomposition for the Isolation of Independent Signals in Microarray data) algorithm to perform novel stress-response gene discovery analyses which correct for differential gene expression patterns induced by the circadian clock. As described previously [6], although core circadian clock gene patterns undergo significant changes in phase and amplitude as a result of stress, they maintain oscillating frequencies which remain similar to each other, and still remain close to the circadian pattern of one cycle per day. It has also been shown that stress results in significantly increased average expression levels for stress-response genes [6], which are reflected in the low-frequency signals (where one oscillation cycle occurs over the course of several days) for these genes. We assume that although circadian clock influences and adaptive stress-response influences can interact with each other (Figure1), they still cycle at very different rates from each other (and therefore maintain separate dominant frequency ranges) under stress conditions. Based on these observations, we have developed PRIISM to project gene expression data to the frequency domain using the Fourier Transform, isolate independent signals, and then project them back to the expression domain to reconstruct independent gene expression patterns representing the effects of different genetic influences. PRIISM is capable of separating one gene expression pattern into three distinct gene expression patterns: (1) The treatment-frequency gene expression pattern, which has much of the complicating circadian influences removed, and consequently can be used to more accurately identify differentially regulated genes which are involved in direct treatment response, (2) the clock-frequency gene expression pattern, representing rhythmic patterns with a period of approximately one cycle per day, and (3) the noise-frequency gene expression pattern (Figure2). By applying PRIISM on a cold-treatment dataset, we demonstrate that it can identify known treatment-response genes with a much lower false-positive rate than the existing methods, and can also identify important regulatory timepoints which are not obvious in the unprocessed data. In addition to improving performance when conducting novel treatment-response gene discovery, PRIISM also provides gene expression data which represent only circadian clock influences, and may be useful for circadian clock analysis studies.
Figure 2.

PRIISM separates gene expression data into three independent gene expression datasets. PRIISM separates (A) the original gene expression patterns under control and treatment conditions (used to calculate the fold change pattern) into (B) treatment-frequency, clock-frequency and noise-frequency gene expression patterns. The cold-induced gene COR15A (AT2G42540) is shown as an example.
Biological approaches such as the use of constant light and clock component genetic knockout mutants are applied in order to attempt to remove the influences of the circadian clock on target gene expression. However, constant light is an unnatural condition which reduces the applicability of the results, because natural biotic and abiotic genetic stress-response patterns depend on the time-of-day (the point in the light/dark cycle) at which the treatment is applied [6,18,19]. Likewise, the use of genetic knockout mutants of circadian clock genes can reduce disruptions due to circadian input; However, since stress response genes may be regulated by clock components, the results of such a study are also difficult to interpret [7,19,20].
Most existing computational approaches for studying differential gene expression in microarray datasets involve clustering algorithms designed to group genes with similar expression profiles, with the goal of identifying potential annotations for unknown genes [10-17]. However, the gene distance measures used by all of these clustering methods are unable to distinguish adaptive-response gene expression patterns from circadian clock disruption gene expression patterns, and so may cluster genes with similar clock influences but very different treatment-response influences. Bar-Joseph et al’s (2003) continuous representation model for finding differentially expressed genes in time series micro array datasets (which has been used to find more cell-cycle response genes in yeast than conventional clustering methods) is also unable to filter clock influences from treatment response influences on gene expression patterns [21].
Several studies have shown that between 6% and 31% of the Arabidopsis genome is influenced by circadian clock genetic components [5,22,23]; while another study suggests that there are significant baseline circadian oscillations for nearly 100% of the genome [24]. A number of approaches have been developed for analyzing the circadian rhythms of genes in time-series datasets [5,25-28]. Fourier analysis (which can be used to identify dominant frequencies in time-series data) has been applied to successfully identify periodic genes by treating time-series microarray datasets as time-domain signals [28-32]. However, these Fourier analysis methods have not been widely used in differential gene expression study methods, because 1) in existing Fourier analysis applications [28-32], a fixed frequency range was used as a priori knowledge to discover genes with similar oscillations, but novel genes may have totally different frequency patterns under different treatment conditions and; 2) to accurately capture oscillating rhythms, high resolution time course gene expression data is essential according to Nyquist sampling theorem[25,33], but such data have not been available until recently.
As the price of running microarrays and RNA-seq chips continues to fall, high-resolution time-series gene expression datasets that contain enough information to identify and characterize circadian-frequency rhythms for every gene are becoming available [34-36]. Recently, Espinoza et al. (2010) produced one such microarray dataset, which measured 16 timepoints covering a 58-hour time period with a cold treatment in Arabidopsis[7]. Cold-stress genetic responses in Arabidopsis are particularly well-characterized, and have been shown to significantly dampen and phase-shift the oscillations of the core clock genes CCA1 and LHY, which have regulatory influences over some cold-responsive transcription factors, including CBF1CBF2 and CBF3[20]. Disruption of the expression patterns of other circadian output marker genes due to cold treatment has also been reported, including constant over expression of CAB2 and CCR2, and constant underexpression of CAT3[6,9]. For these reasons, this is an ideal dataset to test whether the PRIISM algorithm is able to separate the strong circadian-clock influences on cold-response genes from treatment-response influences.
Methods
A wide range of biotic and abiotic stress treatments have been shown to significantly disrupt the cyclic patterns of core circadian clock genes and their downstream target genes [3-8]. When a stress treatment is constantly applied, adaptive stress-response genes are expected to be differentially regulated, while influences from the circadian clock will cause oscillations in target gene expression patterns. In PRIISM, by projecting the gene expression data to the frequency domain using the Fourier transform [37], the resulting amplitude spectra peak at different frequencies, caused by these different influences. The Fourier transform is a mainstream signal processing technique that simplifies period gram analysis by identifying the dominant frequencies in the amplitude spectrum. By distinguishing the clock frequency range from the core circadian clock genes in the frequency domain, we can separate the spectrum to different sections containing treatment-related, clock-related and noise-related influences. Then, we project the amplitude spectra back to the expression domain to reconstruct isolated, independent gene expression patterns representing the effects of different frequency components. This method can be applied to any dataset which has sufficiently high resolution and length to measure frequencies of at least one cycle per day, and which uses a treatment which is applied at a frequency significantly different than the clock frequency.
PRIISM has four steps (Figure3). In the first step, gene expression data are pre-processed to fit the requirements of the Fourier transform, after which the Fourier transform is performed to produce an amplitude spectrum for every gene (Figure3A, 3B). In the second step, a clock vector that defines the frequency range and the amplitudes of the core circadian clock genes is identified based on the spectra of core circadian clock genes (Figure3C). In the third step, the clock vector is used to decompose every gene’s spectrum into three components (treatment, clock and noise; Figure3D). In the final step, the inverse Fourier transform is applied to project each spectrum component back to the expression domain, resulting in three independent expression patterns (Figure3E, 3F).
Figure 3.

Workflow of the PRIISM algorithm. The 0 to 26 hour time-frame in the cold for AtgolS3 (AT1G09350) is used as an example.
Pre-processing and Fourier analysis
Time series gene expression data are often unevenly sampled, and the disruption of clock patterns caused by the treatment varies over time. To be able to apply the Fourier transform (which requires steady and evenly sampled input), pre-processing is required. First, the whole time course is divided into overlapped frames. The size of these frames can be changed depending on the experiment; If they are too long, then it may be difficult to capture changes over time, and if they are too short, then it is more difficult to capture the treatment-frequency patterns (particularly for low-resolution data). For this experiment, the first time frame is 26 hours long due to the two-hour light period at the start of the time period, and all the other time frames are 24 hours long, starting and ending at each light/dark transition ( Additional file 1: Figure S1A). Second, within each time frame, the gene expression data is interpolated (making the time points evenly sampled), and the mean of the gene expression data for each gene is shifted to zero (refer to explanation of Eq. 2). The Fourier transform is then applied on each overlapping time frame individually, and the final expression values for each timepoint are calculated using a weighted average for each time frame, where higher weights are used for expression values near the center of each time frame ( Additional file 1: Figure S1B).
Fourier analysis is a signal processing technique [37] for the study of two processes: The Fourier transform (the process of decomposing a signal into a sum of components with different frequencies) and the inverse Fourier transform (the operation of reconstructing the signal from these components). Specifically, the discrete Fourier transform (DFT) and its inverse have been used to transform gene expression signals and to reconstruct the discrete signal, respectively [38]. The Fourier coefficient of DFT (Gn) measures the contribution of the corresponding frequency component to the original signal and is given in Eq. 1 [37]:
| (1) |
where, g(kT) is the sampled signal of K samples with the sampling interval T; i is the imaginary unit. The frequency of the corresponding component n is denoted as fn (i.e.,), where N is the number of frequency components. The DFT maps a time course signal into the frequency domain by producing a spectrum. An amplitude spectrum (plotted as the amplitude versus frequency) is a common frequency domain representation of the original signal. Fast Fourier transform (FFT) is an efficient algorithm to compute the DFT and its inverse [37]. Because of its popularity, it has been built into most modern analysis tools including MATLAB and R [39,40].
The Fourier coefficient of the zero-frequency component (G0), derived from Eq. (1) where fn = 0, is shown in Eq. 2 as given in [37]:
| (2) |
Note that there is a dominant peak at zero frequency in the spectrum of the expression value, which may bias the identification of the true dominant peak to frequency zero. To avoid such bias, we shift the mean of the time course gene expression values for each gene to zero (and consequently G0 = 0), leading to the removal of the peak at zero frequency. For example, the mean expression value for the gene shown in Figure3A is reduced from 10.6 to 0, and will be added back proportionally to the reconstructed gene expression values during signal recomposition.
Identification of the circadian clock frequency range
The Arabidopsis circadian clock is composed of multiple feedback loops. Three genes, Circadian ClockAssociated 1 (CCA1), Late ElongatedHypocotyl (LHY) and Timing of CAB Expression 1 (TOC1) compose the first and most important feedback loop controlling the circadian clock, while Pseudo Response Regulators 7 and 9 (PRR7 and PRR9) form a secondary feedback loop with CCA1 and LHY, and a third feedback loop involving TOC1 is regulated by unknown components [41,42]. It has been found that through these feedback loops, eight core circadian clock genes (CCA1LHYPRR7PRR9ELF4GILUX and TOC1) and their downstream gene targets regulate a wide range of downstream pathways, including germination, leaf development, organelle morphology, photosynthesis, and cell wall development [2,18,43-46].
The Fourier transform is performed on these eight core circadian genes (Figure3Ci). The frequency components with relative amplitudes greater than 0.7 (corresponding to half of the maximum value in the spectra) are chosen as dominant frequencies [47]. We define the union of these eight sets of dominant frequencies as Circadian Clock Frequency Range (CCFR), noted as fc_minfc_max, where fc_min is the lowest frequency, and fc_max is the highest frequency (Figure3Ci). Note that in this example, the dominant clock frequency is significantly lower than one cycle per day, due to the stress-induced disruption of clock patterns. The weight of each frequency component in the CCFR is derived as:
| (3) |
where |Gmn | is the magnitude of the Fourier coefficient of the nth frequency component for the mth core circadian gene, is the set of the summed power of eight core clock genes present at each frequency component within the Circadian Clock Frequency Range (CCFR), and wn is the weight for the frequency component at frequency fn. The vector {wc_minwc_min+1,…, wc_max} defines the gain-frequency response of a tapering bandpass filter within the CCFR.
Signal decomposition and recomposition
We apply Fourier analysis on each gene, producing the relative amplitude spectrum from which we identify three distinct sections: Treatment-frequency, clock-frequency and noise-frequency components (Figure3Di). For the treatment-frequency decomposition, given a relatively narrow frequency band, we used a low pass filter with a steep cut-off frequency to gain the optimal balance between removing ringing artifact and approximating desired frequency response [48]. This issue is addressed in detail in the “Justification for choosing a steep cut-off frequency for the low-pass filter” section of the ( Additional file 1: Figure S3Figure S4 and Figure S5) [49].
The clock component is derived by bandpass filtering. Fourier coefficients of the clock components of each gene are modulated by the weight of the corresponding frequency components, as given by Eq. 4:
| (4) |
The tapering filtering results in clock-frequency expression patterns that are noise reduced and with less artifacts caused by a discontinuity in the filter function. The reconstructed high frequency expression pattern is considered to be noise, and it is not studied in this paper. Therefore, we simply applied an ideal high pass filter. The reweighted spectra used for the signal reconstruction of the three frequency components sections are shown in Figure3Dii.
The inverse discrete Fourier transform (IDFT) is calculated according to Eq. 5 [37]:
| (5) |
The inverse Fourier transform is performed on the full spectrum, including the filtered spectra for each gene. Similar to using the clock vector as a tapering band-pass filter to remove noise, we added a coarse graining process to make sure there is no overlapping between any of the two frequency bands, which may increase the robustness of component selection. The mean of the original gene expression values (which was removed in the pre-processing step), is added back proportionally to each gene expression curve based on the amplitude distribution of each component in the spectra before shifting the mean (Figure3F), according to Eq. 6:
| (6) |
where is the treatment expression level at timepoint kT for a given gene, is a result of inverse discrete Fourier transform (Eq. 5) on treatment frequency at timepoint kT, Gn0 is the Fourier coefficient of original gene expression values and GL0 is the Fourier coefficient of original gene expression values in the treatment-frequency band [0,fc_min-1]. Similarly, we compute and i.e., the clock expression level and noise level.
Note that because the entire warm and cold gene expression datasets are mean-shifted based on their relative amplitudes in each component, the reconstructed time-zero fold change values may not necessarily be equal to zero (Figure2B).
Results and discussion
This study analyzes an Arabidopsis Affymetrix ATH1 microarray dataset (containing 22,810 probes) generated by Espinoza et al. (2010), which consists of 16 timepoints collected over the course of 58 hours in both warm (20 °C) and cold (4 °C) conditions under a 16-hour light/8-hour dark cycle starting at ZT14 (14 hours after dawn) [7]. This dataset was chosen for the analysis because it has separate control and treatment arrays, it has sufficiently high resolution (sampled at 2 hours and every 4 hours after that), and cold is a well-studied treatment in Arabidopsis[6,7,9,20,50,51].
Gene expression data was RMA normalized using the “affylmgui” program available as part of the Bioconductor software package and annotated using annotation data available from TAIR (version 10, available ftp://ftp.arabidopsis.org/Genes/TAIR10_genome_release/). The gene expression data were interpolated to every 2 hours using B-spline regression, and were segmented into four overlapping gene expression time frames (from both the warm and cold treatments), which were combined using a weighted average ( Additional file 1: Figure S1) [52,53]. PRIISM was applied on this “original” dataset, resulting in three independent and isolated gene expression datasets (treatment-frequency, clock-frequency and noise-frequency).
Treatment-response gene discovery
In order to show the advantage of PRIISM, we identified known cold-response genes using maximum fold changes and principal component analysis in the treatment-frequency dataset compared to the original dataset. Fold change values were calculated by subtracting the logged gene expression value in the warm from the logged gene expression value in the cold at every timepoint. Lists of Arabidopsis genes upregulated by cold treatment when grown on agar plates or grown in soil were collected from a previous study by Vogel et al [54]. The 302 cold-upregulated genes found in the intersection of these lists were used to define the set of “cold standard” (COS) upregulated genes. Receiver-Operator-Characteristic (ROC) curves (which have been shown to be an effective method for evaluating gene expression data [55]) were generated for these COS-upregulated genes [54] by distinguishing each ranked gene as either a true positive or a false positive (Figure4). A larger area under an ROC curve indicates that more COS-upregulated genes are identified. The line at which the number of true positives is equal to the number of false positives is indicated in Figure4, and only the data above this line are considered biologically relevant. By ranking genes by their maximum fold change values in the treatment-frequency dataset, 52.6% (159/302) of known COS upregulated genes can be identified, compared to only 21.2% (64/302) in the original dataset (Table1) [54]. This difference may be explained by the disruptions contributed by the clock-frequency influences and the noise-frequency influences, which are present in the original dataset. This shows that more COS-upregulated genes can be identified by ranking by the maximum fold change in the treatment-frequency dataset compared to the original dataset.
Figure 4.

ROC curves for COS-upregulated genes. ROC Curves for the 26-hour treatment-frequency fold change (dashed black line), the treatment-frequency maximum fold change (solid black line), the original maximum fold change (solid grey line), and original PCA plot distance data (dashed grey line) are shown. The point at which the number of false positives is equal to the number of true positives (dotted grey line) and random gene selection (dotted black line) are also shown.
Table 1.
Summary of ROC analysis for genes upregulated by cold treatment
| Statistic |
Original Data |
Treatment-Frequency Data |
|||
|---|---|---|---|---|---|
| Maximum Fold Change | PCA Distance | Maximum Fold Change | PCA Distance | Fold Change at 26 Hours | |
| Recall when true positives = false positives |
21.2% |
13.9% |
52.6% |
46.0% |
64.2% |
| Number of true positives identified when true positives = false positives (Out of 302 true positives) | 64 | 42 | 159 | 139 | 194 |
Principal component analysis (PCA) is a linear component composition method that has been applied to summarize different gene expression influences under different conditions, and consequently has been used for differential gene expression studies in microarray datasets [56]. PCA was performed on the original dataset ( Additional file 1: Figure S2A), and the Euclidean distance from the bottom-left of the PCA plot of the first and second component was used to rank the genes, allowing for the construction of an ROC curve based on this data (Figure4). These data show that only 13.9% (42/302) of the cold upregulated genes can be identified in the original PCA plot. The first PCA components of the treatment-frequency data and the clock-frequency data were also plotted ( Additional file 1: Figure S2B) and ranking based on Euclidean distance from the bottom-right was able to identify 46.0% (139/302) of the COS-upregulated genes.
These results showed that, in both maximum fold change and PCA analyses, the ranked treatment-frequency fold change analyses produce fewer false positives than the original methodology by distinguishing more COS-upregulated genes (Table1).
The identification of important gene regulation timepoints using PRIISM
In the previous section, it was shown that gene discovery in the treatment-frequency data produced by PRIISM constantly outperforms the same analyses on the original data. Although these approaches are useful for poorly studied treatment responses, a knowledge-based approach may be used to identify more treatment-response genes with a lower false positive rate.
Cold treatments have been shown to induce the expression of the transcription factors C-repeat/DRE Binding Factor genes CBF1, CBF2 and CBF3[57], which are induced in parallel with the cold transcription factors RAV1 and ZAT12[50]. Some of the important targets of CBF transcription factors include Cold-Responsive (COR) genes COR15A, COR15BCOR47, and COR78[20,50,58,59]. All of the cold transcription factors and targets included in these lists have also been shown to be gated by the circadian clock, making them ideal for evaluating PRIISM’s ability to remove clock-frequency influences [6,20,23].
In the treatment-frequency data, a peak in the fold change patterns can be observed in the well-studied cold response transcription factors and cold regulated (COR) response genes at the start of the first night (at approximately 26 hours) (Figure5C, 5D). The peaks of the transcription factors can be seen to occur before the peaks of their target genes, as is expected for a TF-target relationship. By contrast, these peaks are not apparent in the original fold change data (Figure5A, 5B). For this reason, an ROC curve was computed using the fold change value at 26 hours in the treatment-frequency fold change data (Figure4, Table1). Table1 shows that 194/302 (64.2%) of the true-positive COS-upregulated genes can be identified with a 50% false positive rate in the treatment-frequency 26-hour fold change data, compared to only 64/302 (21.2%) for the maximum fold change in original data and 42/302 (13.9%) for the PCA plot of the original data .
Figure 5.

Fold change patterns of cold transcription factors and target genes before and after PRIISM processing. The original fold change patterns for important cold transcription factors (A) and some of their important target (COR) genes (B) are shown, along with their the treatment-frequency fold change patterns for the same genes (C & D). Thin, dashed vertical lines are used to indicate the 26 hour position on each graph.
This data shows that the fold change value at 26 hours in the treatment-frequency data is the best predictor of whether a gene is involved in adaptive cold response. The top 25 ranked genes based on fold changes at 26 hours in the treatment-frequency dataset are shown in Table2. Included in this table is the “Cold Upregulation Category” for each gene, which indicates whether a gene was upregulated in the cold when plants were grown in soil (“Soil”), on agar plates (“Plate”), on both growth mediums (“COS”), or on neither (“Novel”) in Vogel et al’s study [54]. In this table, 22/25 of the genes belonged to the COS group, 2 belonged to the “Plate” group, and 1 belonged to the “Soil” group, suggesting that the PRIISM method has successfully identified known cold-regulation genes [54]. Table3 shows the top 25 ranked genes which were not part of the COS-upregulated gene list in Vogel et al (2005) [54]. 10/25 of the genes in this list belonged to the “Soil” group, 9 belonged to the “Plate” group, and 6 were novel genes not identified in Vogel et al’s study [54]. All of the novel genes (and all but one of the 25 genes in this list) have been previously identified as being involved in cold response in other studies, suggesting that PRIISM has identified a list of very important cold-response genes (See “Comments” column in Table 8).
Table 2.
Genes ranked based on their treatment-frequency fold change values at 26 hours
| Rank | Annotation | P-Value (Treatment-Frequency Fold Change, 26 Hours) | Cold Upregulation Category*[54] |
|---|---|---|---|
| 1 |
AT1G09350: Arabidopsis thaliana Galactinol Synthase 3 (AtGolS3) |
3.97E-31 |
COS |
| 2 |
AT4G14690: Early Light-Inducible Protein 2 (ELIP2) |
3.18E-28 |
COS |
| 3 |
AT4G12470: Azelaic Acid Induced 1 (AZI1) |
1.23E-25 |
COS |
| 4 |
AT3G50970: Low Temperature-Induced 30 (LTI30) |
3.62E-22 |
COS |
| 5 |
AT1G16850: Unknown protein |
7.38E-22 |
COS |
| 6 |
AT3G22840: Early Light-Inducible Protein 1 (ELIP1) |
8.66E-21 |
COS |
| 7 |
AT1G51090: Heavy-metal-associated domain-containing |
1.41E-16 |
COS |
| 8 |
AT3G55580: Regulator of chromosome condensation (RCC1) family protein |
3.62E-16 |
COS |
| 9 |
AT5G25110: CIPK25 (CBL-Interacting Protein Kinase 25) |
1.13E-13 |
COS |
| 10 |
AT5G52310: COR78 (Cold Regulated 78) |
3.25E-13 |
COS |
| 11 |
AT1G02820: late embryogenesis abundant 3 family protein/LEA3 family protein |
3.29E-13 |
Soil |
| 12 |
AT4G30830: similar to unknown protein (AT2G24140.1) |
5.57E-13 |
COS |
| 13 |
AT2G23910: Cinnamoyl-CoA reductase-related |
9.97E-13 |
Plate |
| 14 |
AT1G48100: Glycoside hydrolase family 28 protein/polygalacturonase (pectinase) family protein |
1.93E-12 |
COS |
| 15 |
AT5G17030: UDP-Glucosyl Transferase 78D3 (UGT78D3) |
3.07E-12 |
COS |
| 16 |
AT4G33070: Pyruvate decarboxylase, putative |
3.43E-12 |
COS |
| 17 |
AT3G17130: Invertase/pectin methylesterase inhibitor family protein |
4.21E-11 |
COS |
| 18 |
AT1G11210: Similar to unknown protein (TAIR:AT1G11220.1) |
1.06E-10 |
COS |
| 19 |
AT1G62570: Flavin-monooxygenase Glucosinolates-Oxygenase 4 (FMO GS-OX4) |
3.24E-10 |
COS |
| 20 |
AT2G16890: UDP-glucoronosyl/UDP-glucosyl transferase family protein |
5.52E-10 |
COS |
| 21 |
AT4G25480: Dehydration response element B1A (DREB1A); C-Repeat Binding Factor 3 (CBF3) |
6.1E-10 |
COS |
| 22 |
AT1G20440: Cold-Regulated 47 (COR47); (RD17) |
1.08E-09 |
COS |
| 23 |
AT1G61800: Glucose-6-Phosphate/Phosphate Translocator 2 (GPT2) |
1.37E-09 |
Plate |
| 24 |
AT4G17550: Transporter-related |
1.52E-09 |
COS |
| 25 | AT1G62710: Beta Vacuolar Processing Enzyme (BETA-VPE) | 5.78E-09 | COS |
*“ Cold Upregulation Category” indicates whether a gene was upregulated in the cold when plants were grown in soil (“Soil”), on agar plates (“Plate”), on both growth mediums (“COS”), or on neither (“Novel”) in Vogel et al’s study [54].
Table 3.
The top 25 ranked non-COS genes based on treatment-frequency fold change values at 26 hours
| Rank | Annotation | Comments | P Value (Treatment-Frequency Fold Change, 26 Hours) | Cold Upregulation Category*[54] |
|---|---|---|---|---|
| 11 |
AT1G02820: Late embryogenesis abundant 3 family protein/LEA3 family protein |
LEA family proteins are associated with dehydration stress (and therefore cold) and general environmental stress in plants, and desiccation tolerance in other organisms including bacteria [60]. Cold response genes COR15ACOR15B and COR47 are classified as LEA genes. Although not to the same degree as the COR genes, expression of this gene was upregulated by cold according to quantitative RT-PCR [60] |
3.29E-13 |
Soil |
| 13 |
AT2G23910: Cinnamoyl-CoA reductase-related |
Implicated in the biosynthesis of phenylpropanoids [61,62], which contribute to many different plant responses to biotic and abiotic stress/challenge [63] |
9.97E-13 |
Plate |
| 23 |
AT1G61800: GPT2 (Glucose-6-Phosphate Translocator 2) |
A gpt2 mutant shows an impairment in photosynthetic acclimation in response to shifts to high irradiance light, which can be exacerbated under cold conditions [64] |
1.37E-09 |
Plate |
| 29 |
AT5G06760: Late embryogenesis abundant group 1 (LEA group 1) domain-containing protein |
Similar to other LEA above (AT1G02820), expression of this gene is upregulated by cold according to quantitative RT-PCR [60] |
1.86E-08 |
Soil |
| 37 |
AT3G51240: F3H; TT6 (Flavanone 3-Hydroxylase; Transparent Testa 6) |
Implicated in freezing stress response [65] |
7.07E-08 |
Plate |
| 50 |
AT1G60190: Armadillo/beta-catenin repeat family/U-box domain-containing |
|
1.92E-06 |
Soil |
| 53 |
AT5G24120: SIGE/SIG5 (RNA polymerase sigma subunit E); DNA binding/DNA-directed RNA polymerase/sigma/transcription factor |
Regulated in blue light by cryptochromes and involved in light-dependent regulation of the photosynthetic apparatus [66]. In a separate study shown to be essential for Arabidopsis[67] |
3.24E-06 |
Soil |
| 55 |
AT1G10370: ATGSTU17/ERD9/(Early-Responsive to Dehydration 9) |
Dehydration responsive [68] |
4.43E-06 |
Plate |
| 57 |
AT1G32900: Starch synthase, putative |
Identified in a study on light/cold interactions [69]. Upregulated by cold generally, but upregulated more under cold/light conditions than cold/dark |
6.47E-06 |
Novel |
| 60 |
AT4G33905: Peroxisomal membrane protein 22 kDa, putative |
Upregulated by stress, including cold treatment [70] |
7.71E-06 |
Novel |
| 61 |
AT1G01520: Myb family transcription factor |
Upregulated in mutant that has improved freezing tolerance (i.e. esk1 mutant) [71]. |
1.63E-05 |
Novel |
| 63 |
AT5G57760: Unknown |
|
1.95E-05 |
Plate |
| 70 |
AT5G14760: AO (L-aspartate oxidase) |
Involved in the synthesis of NAD [72], which is phosphorylated by cold in other plants [73] |
4.96E-05 |
Novel |
| 71 |
AT1G10585: Transcription factor |
Upregulated under conditions associated with oxidative stress/high light [74] |
5.66E-05 |
Soil |
| 72 |
AT5G07010: Sulfotransferase family |
Jasmonate responsive [68] |
5.95E-05 |
Soil |
| 75 |
AT2G22590: Glycosyltransferase family protein |
In the same gene family as UGT91A1, (a target of a TF that regulates flavonol synthesis), and is thus proposed to impact flavonol biosynthesis, which is a product associated with cold response [75,76] |
6.55E-05 |
Plate |
| 76 |
AT3G17609: HYH (HY5-Homolog); DNA binding/transcription factor |
Involved in phyB signaling [77]; Required for low temperature-induced anthocyanin accumulation [78] |
6.78E-05 |
Novel |
| 81 |
AT1G17170: ATGSTU24 (Arabidopsis thaliana Glutathione S-Transferase (TAU) 24) |
Member of the Glutathione S-transferase family (involved in flavonoid synthesis and general abiotic stress response) [79] |
0.000123 |
Soil |
| 82 |
AT5G07990: TT7 (Transparent Testa 7); flavonoid 3′-monooxygenase |
Flavonoid biosynthesis protein, which is a product associated with cold response [68,76] |
0.000125 |
Plate |
| 83 |
AT3G55940: Phosphoinositide-specific phospholipase C, putative |
Phospholipase C genes, to which this is related, have been associated with responses to stress in Arabidopsis[80] |
0.000142 |
Plate |
| 84 |
AT3G21560: UGT84A2; UDP-glycosyltransferase/sinapate 1-glucosyltransferase |
Upregulated by cold via the phospholipase D-dependent phosphatidic acid production [81] |
0.000145 |
Plate |
| 85 |
AT5G49480: ATCP1 (CA2 + −Binding Protein 1) |
A “cold regulated signaling gene” that is altered in an ice1 mutant background (ICE1 is a cold/freezing related TF) [51]. Regulation altered under drought conditions [82]. Also (like UGT84A2, above) upregulated by cold via phospholipase D-dependent phosphatidic acid production [81] |
0.000168 |
Soil |
| 86 |
AT5G44110: POP1 |
Shown to be upregulated by cold in supplemental table of [83]. Response to Red and Far-Red light via phyA [84]. Also a target of HY5[85], which is a transcription factor in light signaling/responsiveness, but also shown to be important for cold dependent anthocyanin accumulation together with HYH (above) [78] |
0.00017 |
Soil |
| 87 |
AT5G36910: THI2.2 (Thionin 2.2); toxin receptor binding |
Downregulated under high temperature stress [86], associated with jasmonic acid/salicylic acid signalling [87] and target of FAR1 and FHY3, which function in phyA signaling [88] |
0.000174 |
Novel |
| 88 | AT2G31380: STH1 (salt tolerance homologue); transcription factor/zinc ion binding, also previously denoted ZF3 | Like POP1 above, shown to be upregulated by cold in supplemental table of [83]. Circadian-controlled zinc finger gene with role in light signaling [89]. Additional evidence for role in light signaling and regulation by phytochrome [90,91], and like THI2 (above), target of FAR1 and FHY3, which function in phyA signaling [88] | 0.000176 | Soil |
*“ Cold Upregulation Category” indicates whether a gene was upregulated in the cold when plants were grown in soil (“Soil”), on agar plates (“Plate”), on both growth mediums (“COS”), or on neither (“Novel”) in Vogel et al’s study [54].
The results of a case study on ATGolS3 (AT1G09350), the gene with the largest fold change in the treatment-frequency data at 26 hours are shown in Figure6. The logged original gene expression curve under warm conditions has a minimum expression level of approximately 6, which is reflected by a flat treatment-frequency expression curve with a nearly constant value of 6 (Figure6A). The rhythmic pattern of the original data in warm conditions is captured in the clock-frequency gene expression curve, and the sharp peaks and sudden changes in slope are captured in the noise-frequency curve (Figure6A). The original gene expression data under cold conditions peaks quite strongly during the first night but retains some cyclical expression. The PRIISM-processed gene expression data shows that the treatment-frequency gene expression is constantly higher in the cold, with a peak at 26 hours, while the clock-frequency gene expression data is only marginally increased, but is increased more in the first day than in the second day (Figure6B, 6C). The fold change graph shown in Figure6C indicates that most of the increase in gene expression is due to treatment-frequency influences for this gene, but the clock-frequency influences upregulate the gene more strongly early in the cold treatment. The noise-frequency fold change pattern matches many of the sharp peaks and valleys in the original fold change pattern, suggesting that much of the noise has indeed been removed (Figure6C).
Figure 6.

A case study examining PRIISM output gene expression and fold change data. The fold change patterns (A), warm gene expression patterns (B) and cold gene expression patterns (C) for the original and PRIISM-processed data for AtgolS3 (AT1G09350), the most highly upregulated gene in response to cold at 26 hours in the treatment-frequency data.
To test the statistical significance of PRIISM’s ability to discover treatment-response genes, P-values were calculated using a Z-test for both the maximum fold change from the original dataset and the fold change values at 26 hours in the treatment-frequency dataset. Figure7 shows the number of genes that were found to be significant (P value < =0.05) in these tests, and how many belonged to the COS-upregulated gene list from Vogel et al [54]. Out of the 161 genes significant in the treatment-frequency data at 26 hours, 98 of them (60.9%) were COS upregulated genes, compared to 154 out of 379 (39.3%) for the original dataset.
Figure 7.

Venn diagram showing COS-upregulated genes in original and PRIISM-processed significant gene lists. The number of genes in the overlaps between COS-upregulated genes (A) and the significant genes (P value ≤ 0.05) in both the maximum fold change in the original dataset (B) and the fold change at 26 hours in the treatment-frequency dataset (C) are shown.
Clock-frequency data analysis
The clock vectors calculated by Equation 3 under both warm and cold conditions for each of the time frames are shown in Figure8. The difference between the length and the shape of the warm and cold vectors indicates the circadian rhythm disruption caused by the cold stress. Figure8A shows drastically different frequency profiles for the warm and cold conditions, caused by an abrupt phase shift in the expression data. The clock genes continue to have disrupted frequencies in the second time frame (Figure8B), but appear to return to normal oscillating frequencies, possibly with different phases, in time frames 3 and 4 (Figure8C, 8D).
Figure 8.
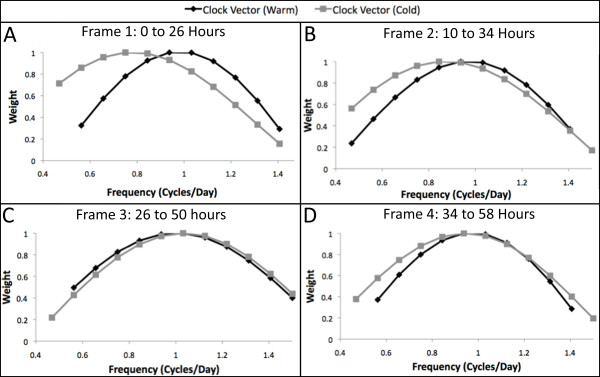
Clock vectors under warm and cold conditions.
To study whether the clock-frequency data produced by PRIISM successfully isolated cyclic clock influences from treatment-response influences, the clock-frequency gene expression patterns of eight well-studied cold response genes were matched with standard clock patterns according to the pattern-matching algorithm HAYSTACK [26]. This algorithm (the key component of The Diurnal Project) utilizes a model-based pattern matching algorithm to calculate the phase and cyclic pattern type for each gene in a dataset, and also calculates the correlation of each gene to the closest model, which can be used as an indication of how strong the clock influence is on the gene [26]. HAYSTACK provides T-test P-values indicating the probability that an input pattern matches a gene expression model, and provides several types of cyclic clock pattern models to use for comparison [26]. This analysis included the COR genes which have been shown to be under circadian clock control under warm conditions, but gated by cold transcription factors (including the CBF genes) under cold conditions [20]. The results in Table4 indicate that the P values for the clock-frequency gene expression data from PRIISM are substantially lower than the original data (under both warm and cold conditions), often by several orders of magnitude, demonstrating enrichment of clock-frequency gene expression in this data.Note that the remaining portion of the spectrum of the clock-frequency components is simply discarded in PRIISM. In our future work, it will be interesting to further test whether feeding it into the treatment-frequency component will construct more precise results.
Table 4.
A comparison of the clock patterns between PRIISM-processed and original gene expression data
| Gene Name |
AGI Number |
P-values for Warm Gene Expression Data |
P-values for Cold Gene Expression Data |
||
|---|---|---|---|---|---|
| Original | Clock-Frequency (PRIISM) | Original | Clock-Frequency (PRIISM) | ||
|
COR15A |
AT2G42540 |
5.6E-17 |
0 |
0.125 |
0.039 |
|
COR15B |
AT2G42530 |
0 |
0 |
0.038 |
4.3E-03 |
|
COR47 |
AT1G20440 |
4.7E-09 |
1.8E-13 |
0.012 |
3.8E-03 |
|
COR78 |
AT5G52310 |
0 |
0 |
0.013 |
2.3E-03 |
|
CBF1 |
AT4G25490 |
5.0E-07 |
7.2E-08 |
4.5E-04 |
3.8E-05 |
|
CBF2 |
AT4G25470 |
3.9E-06 |
1.6E-13 |
3.2E-08 |
2.2E-09 |
|
CBF3 |
AT4G25480 |
5.5E-14 |
5.6E-17 |
2.6E-07 |
5.0E-10 |
|
RAV1 |
AT1G13260 |
1.8E-06 |
3.0E-10 |
7.4E-05 |
2.8E-04 |
| ZAT12 | AT5G59820 | 3.4E-03 | 4.9E-05 | 1.4E-04 | 1.9E-05 |
P-values (calculated using the T-test HAYSTACK function) indicate the correlation of the gene expression patterns of well-studied cold-responsive genes to pre-defined cyclic clock patterns.
Conclusions
Circadian rhythm pathways influence the expression patterns of as much as 31% of the Arabidopsis genome through complicated interaction pathways, and have been found to be significantly disrupted by biotic and abiotic stress treatments, complicating treatment-response gene discovery methods due to clock pattern mismatches in the fold change statistic. The PRIISM algorithm outlined in this paper is designed to separate pattern changes induced by different forces, including treatment pathways and circadian clock rhythm disruptions. By applying PRIISM on a cold-response dataset, we systematically evaluated our method using maximum fold change and PCA analyses. The results of this study showed that the ranked treatment-frequency fold change analyses produce fewer false positives than the original methodology, and the 26 hour timepoint in the PRIISM produced dataset was the best statistic for distinguishing the most known cold-response genes. In addition, PRIISM also provides gene expression data which represent only circadian clock influences, and may be useful for circadian clock studies. In fact, any existing analysis approach on gene expression data can utilize PRIISM to separate circadian-influenced changes in gene expression. In conclusion, PRIISM is a novel approach for overcoming the problem of circadian disruptions from stress treatments on plants. PRIISM can be integrated with any existing analysis approach on gene expression data to separate circadian-influenced changes in gene expression, and it can be extended to apply to any organism with regular oscillations in gene expression patterns across a large portion of the genome. In future work, we will apply the discrete wavelet transforms (DWT) on higher resolution datasets in order to further enhance the ability of PRIISM to distinguish circadian clock disruption influences from treatment-response pathway influences.
Competing interests
The authors declare that they have no competing interest.
Authors’ Contributions
JC, YJ, BR conceived and designed the algorithm. YJ designed MATLAB code for algorithm. BR performed pre-processing and post-processing of data. BR and YJ wrote the manuscript, which was edited by JC, BM, SO and WQ. BM and SO also provided biological knowledge and research of circadian and cold response genes. All authors read and approved the final manuscript.
Supplementary Material
Figure S1: Time frames used to generate FFT results. Frame sizes and positions are shown in (A) and the contribution of each frame to the weighted average at each timepoint is shown in (B). Figure S2: Principal Component Analysis (PCA) Plots. Principal component analysis (PCA) plots for the original data (A) and the first components of the clock-frequency and treatment-frequency data (B) are shown. COS-upregulated genes are shown in black circles, COS-downregulated genes (which are not analyzed in detail here) are shown in white diamonds and all other genes are shown as grey dots. Figure S3: The original, mean-shifted, PRIISM-reconstructed and Butterworth-filter reconstructed gene expression patterns ofAtGolS3. (A) The original (black) and mean-shifted (grey) expression values of AtGolS3. (B) Comparison between the treatment-frequency-reconstructed gene expression patterns for AtGolS3 using PRIISM (Black line) and using a fifth-order Butterworth low-pass filter (grey line). Figure S4: The frequency spectra of the original, the PRIISM-reconstructed and the Butterworth-filter reconstructed gene expression patterns ofAtGolS3. (A) The Frequency Spectrum of the original gene expression pattern of AtGolS3. (B) Comparison of the frequency spectra of AtGolS3 after processing using PRIISM (white circles) and the fifth-order Butterworth low-pass filter (grey diamonds). The original treatment-frequency spectrum of AtGolS3 is also shown (red bars). Figure S5: The Bode plot of a fifth-order Butterworth low-pass filter forAtGolS3.
Contributor Information
Bruce A Rosa, Email: barosa@lakeheadu.ca.
Yuhua Jiao, Email: yuhjiao@msu.edu.
Sookyung Oh, Email: ohsookyu@msu.edu.
Beronda L Montgomery, Email: montg133@msu.edu.
Wensheng Qin, Email: wqin@lakeheadu.ca.
Jin Chen, Email: jinchen@msu.edu.
Acknowledgements
We thank Dr. Michael Thomashow and Dr. Eva Farré for their feedback and helpful advice. This project has been funded by the U.S. Department of Energy (Chemical Sciences, Geosciences and Biosciences Division, grant no. DE–FG02–91ER20021 to J.C. and B.L.M), The National Science Foundation (grant no. MCB-0919100 to B.L.M.), the Natural Sciences and Engineering Research Council of Canada (NSERC) through a Post-Graduate Scholarship to B.R. and NSERC Collaborative Research and Development grant to W.Q., and Ontario Research Chair funding to W.Q.
References
- Cui X, Churchill GA. Statistical tests for differential expression in cDNA microarray experiments. Genome Biol. 2003;4:210. doi: 10.1186/gb-2003-4-4-210. [DOI] [PMC free article] [PubMed] [Google Scholar]
- Adams S, Carre IA. Downstream of the plant circadian clock: output pathways for the control of physiology and development. Essays Biochem. 2011;49:53–69. doi: 10.1042/bse0490053. [DOI] [PubMed] [Google Scholar]
- Bilgin DD, Zavala JA, Zhu J, Clough SJ, Ort DR, DeLucia EH. Biotic stress globally downregulates photosynthesis genes. Plant Cell Environ. 2010;33:1597–1613. doi: 10.1111/j.1365-3040.2010.02167.x. [DOI] [PubMed] [Google Scholar]
- Chaves MM, Flexas J, Pinheiro C. Photosynthesis under drought and salt stress: regulation mechanisms from whole plant to cell. Ann Bot. 2009;103:551–560. doi: 10.1093/aob/mcn125. [DOI] [PMC free article] [PubMed] [Google Scholar]
- Michael TP, Mockler TC, Breton G, McEntee C, Byer A, Trout JD, Hazen SP, Shen R, Priest HD, Sullivan CM. et al. Network discovery pipeline elucidates conserved time-of-day-specific cis-regulatory modules. PLoS Genet. 2008;4:e14. doi: 10.1371/journal.pgen.0040014. [DOI] [PMC free article] [PubMed] [Google Scholar]
- Bieniawska Z, Espinoza C, Schlereth A, Sulpice R, Hincha DK, Hannah MA. Disruption of the Arabidopsis circadian clock is responsible for extensive variation in the cold-responsive transcriptome. Plant Physiol. 2008;147:263–279. doi: 10.1104/pp.108.118059. [DOI] [PMC free article] [PubMed] [Google Scholar]
- Espinoza C, Degenkolbe T, Caldana C, Zuther E, Leisse A, Willmitzer L, Hincha DK, Hannah MA. Interaction with diurnal and circadian regulation results in dynamic metabolic and transcriptional changes during cold acclimation in Arabidopsis. PLoS One. 2010;5:e14101. doi: 10.1371/journal.pone.0014101. [DOI] [PMC free article] [PubMed] [Google Scholar]
- Nakamichi N, Kusano M, Fukushima A, Kita M, Ito S, Yamashino T, Saito K, Sakakibara H, Mizuno T. Transcript profiling of an Arabidopsis PSEUDO RESPONSE REGULATOR arrhythmic triple mutant reveals a role for the circadian clock in cold stress response. Plant Cell Physiol. 2009;50:447–462. doi: 10.1093/pcp/pcp004. [DOI] [PubMed] [Google Scholar]
- Espinoza C, Bieniawska Z, Hincha DK, Hannah MA. Interactions between the circadian clock and cold-response in Arabidopsis. Plant Signal Behav. 2008;3:593–594. doi: 10.4161/psb.3.8.6340. [DOI] [PMC free article] [PubMed] [Google Scholar]
- Schliep A, Steinhoff C, Schonhuth A. Robust inference of groups in gene expression time-courses using mixtures of HMMs. Bioinformatics. 2004;20(Suppl 1):i283–i289. doi: 10.1093/bioinformatics/bth937. [DOI] [PubMed] [Google Scholar]
- Verducci JS, Melfi VF, Lin S, Wang Z, Roy S, Sen CK. Microarray analysis of gene expression: considerations in data mining and statistical treatment. Physiol Genomics. 2006;25:355–363. doi: 10.1152/physiolgenomics.00314.2004. [DOI] [PubMed] [Google Scholar]
- Dejean S, Martin PG, Baccini A, Besse P. Clustering time-series gene expression data using smoothing spline derivatives. EURASIP J Bioinform Syst Biol. 2007. p. 70561. [DOI] [PMC free article] [PubMed]
- Ernst J, Nau GJ, Bar-Joseph Z. Clustering short time series gene expression data. Bioinformatics. 2005;21(Suppl 1):i159–i168. doi: 10.1093/bioinformatics/bti1022. [DOI] [PubMed] [Google Scholar]
- Hestilow TJ, Huang Y. Clustering of gene expression data based on shape similarity. EURASIP J Bioinform Syst Biol. 2009. p. 195712. [DOI] [PMC free article] [PubMed]
- Syeda-Mahmood T. Clustering time-varying gene expression profiles using scale-space signals. Proc IEEE Comput Soc Bioinform Conf. 2003;2:48–56. [PubMed] [Google Scholar]
- Koenig L, Youn E. Hierarchical Signature Clustering for Time Series Microarray Data: Software Tools and Algorithms for Biological Systems Volume 696. Springer, New York; 2011. pp. 57–65. [DOI] [PubMed] [Google Scholar]
- Chiappetta P, Roubaud MC, Torresani B. Blind source separation and the analysis of microarray data. J Comput Biol. 2004;11:1090–1109. doi: 10.1089/cmb.2004.11.1090. [DOI] [PubMed] [Google Scholar]
- Salome PA, Xie Q, McClung CR. Circadian timekeeping during early Arabidopsis development. Plant Physiol. 2008;147:1110–1125. doi: 10.1104/pp.108.117622. [DOI] [PMC free article] [PubMed] [Google Scholar]
- Morker KH, Roberts MR. Light exerts multiple levels of influence on the Arabidopsis wound response. Plant Cell Environ. 2011;34:717–728. doi: 10.1111/j.1365-3040.2011.02276.x. [DOI] [PubMed] [Google Scholar]
- Dong MA, Farre EM, Thomashow MF. Circadian clock-associated 1 and late elongated hypocotyL regulate expression of the C-REPEAT BINDING FACTOR (CBF) pathway in Arabidopsis. Proc Natl Acad Sci U S A. 2011;108:7241–7246. doi: 10.1073/pnas.1103741108. [DOI] [PMC free article] [PubMed] [Google Scholar]
- Bar-Joseph Z, Gerber G, Simon I, Gifford DK, Jaakkola TS. Comparing the continuous representation of time-series expression profiles to identify differentially expressed genes. Proc Natl Acad Sci U S A. 2003;100:10146–10151. doi: 10.1073/pnas.1732547100. [DOI] [PMC free article] [PubMed] [Google Scholar]
- Edwards KD, Anderson PE, Hall A, Salathia NS, Locke JCW, Lynn JR, Straume M, Smith JQ, Millar AJ. Flowering locus C mediates natural variation in the high-temperature response of the Arabidopsis circadian clock. Plant Cell Online. 2006;18:639–650. doi: 10.1105/tpc.105.038315. [DOI] [PMC free article] [PubMed] [Google Scholar]
- Harmer SL, Hogenesch JB, Straume M, Chang HS, Han B, Zhu T, Wang X, Kreps JA, Kay SA. Orchestrated transcription of key pathways in Arabidopsis by the circadian clock. Science. 2000;290:2110–2113. doi: 10.1126/science.290.5499.2110. [DOI] [PubMed] [Google Scholar]
- Ptitsyn A. Comprehensive analysis of circadian periodic pattern in plant transcriptome. Bioinforma. 2008;9:S18. doi: 10.1186/1471-2105-9-S9-S18. [DOI] [PMC free article] [PubMed] [Google Scholar]
- Price TS, Baggs JE, Curtis AM, Fitzgerald GA, Hogenesch JB. WAVECLOCK: wavelet analysis of circadian oscillation. Bioinformatics. 2008;24:2794–2795. doi: 10.1093/bioinformatics/btn521. [DOI] [PMC free article] [PubMed] [Google Scholar]
- Mockler TC, Michael TP, Priest HD, Shen R, Sullivan CM, Givan SA, McEntee C, Kay SA, Chory J. The DIURNAL project: DIURNAL and circadian expression profiling, model-based pattern matching, and promoter analysis. Cold Spring Harb Symp Quant Biol. 2007;72:353–363. doi: 10.1101/sqb.2007.72.006. [DOI] [PubMed] [Google Scholar]
- Lu Y, Rosenfeld R, Bar-Joseph Z. Identifying cycling genes by combining sequence homology and expression data. Bioinformatics. 2006;22:e314–e322. doi: 10.1093/bioinformatics/btl229. [DOI] [PubMed] [Google Scholar]
- Wichert S, Fokianos K, Strimmer K. Identifying periodically expressed transcripts in microarray time series data. Bioinformatics. 2004;20:5–20. doi: 10.1093/bioinformatics/btg364. [DOI] [PubMed] [Google Scholar]
- Rustici G, Mata J, Kivinen K, Lio P, Penkett CJ, Burns G, Hayles J, Brazma A, Nurse P, Bahler J. Periodic gene expression program of the fission yeast cell cycle. Nat Genet. 2004;36:809–817. doi: 10.1038/ng1377. [DOI] [PubMed] [Google Scholar]
- Spellman PT, Sherlock G, Zhang MQ, Iyer VR, Anders K, Eisen MB, Brown PO, Botstein D, Futcher B. Comprehensive identification of cell cycle-regulated genes of the yeast Saccharomyces cerevisiae by microarray hybridization. Mol Biol Cell. 1998;9:3273–3297. doi: 10.1091/mbc.9.12.3273. [DOI] [PMC free article] [PubMed] [Google Scholar]
- Whitfield ML, Sherlock G, Saldanha AJ, Murray JI, Ball CA, Alexander KE, Matese JC, Perou CM, Hurt MM, Brown PO, Botstein D. Identification of genes periodically expressed in the human cell cycle and their expression in tumors. Mol Biol Cell. 2002;13:1977–2000. doi: 10.1091/mbc.02-02-0030.. [DOI] [PMC free article] [PubMed] [Google Scholar]
- Bozdech Z, Llinás M, Pulliam BL, Wong ED, Zhu J, DeRisi JL. The Transcriptome of the Intraerythrocytic Developmental Cycle of Plasmodium falciparum. PLoS Biol. 2003;1:e5. doi: 10.1371/journal.pbio.0000005. [DOI] [PMC free article] [PubMed] [Google Scholar]
- Marks RJ. Introduction to Shannon Sampling and Interpolation Theory. Springer, New York, USA; 1991. [Google Scholar]
- Craigon DJ, James N, Okyere J, Higgins J, Jotham J, May S. NASCArrays: a repository for microarray data generated by NASC’s transcriptomics service. Nucleic Acids Res. 2004;32:D575–D577. doi: 10.1093/nar/gkh133. [DOI] [PMC free article] [PubMed] [Google Scholar]
- Parkinson H, Kapushesky M, Kolesnikov N, Rustici G, Shojatalab M, Abeygunawardena N, Berube H, Dylag M, Emam I, Farne A. et al. ArrayExpress update—from an archive of functional genomics experiments to the atlas of gene expression. Nucleic Acids Res. 2009;37:D868–D872. doi: 10.1093/nar/gkn889. [DOI] [PMC free article] [PubMed] [Google Scholar]
- Hubble J, Demeter J, Jin H, Mao M, Nitzberg M, Reddy TB, Wymore F, Zachariah ZK, Sherlock G, Ball CA. Implementation of GenePattern within the Stanford Microarray Database. Nucleic Acids Res. 2009;37:D898–D901. doi: 10.1093/nar/gkn786. [DOI] [PMC free article] [PubMed] [Google Scholar]
- Oran Brigham E. The fast Fourier transform and its applications. Upper Saddle River. Prentice-Hall, Inc, NJ, USA; 1988. [Google Scholar]
- Tominaga D. Periodicity detection method for small-sample time series datasets. Bioinform Biol Insights. 2010;4:127–136. doi: 10.4137/BBI.S5983. [DOI] [PMC free article] [PubMed] [Google Scholar]
- Team RDC. R: A language and environment for statistical computing. R Foundation for Statistical Computing, Vienna, Austria; 2011. [Google Scholar]
- Inc. TM: MATLAB. Natick, Massachusetts; 2010. [Google Scholar]
- Harmer SL. The Circadian System in Higher Plants. , Palo Alto; 2009. pp. 357–377. Annual Review of Plant Biology. [DOI] [PubMed] [Google Scholar]
- Nakamichi N. Molecular Mechanisms Underlying the Arabidopsis Circadian Clock. Plant Cell Physiol. 2011;52:1709–1718. doi: 10.1093/pcp/pcr118. [DOI] [PMC free article] [PubMed] [Google Scholar]
- Li HM, Altschmied L, Chory J. Arabidopsis mutants define downstream branches in the phototransduction pathway. Genes Dev. 1994;8:339–349. doi: 10.1101/gad.8.3.339. [DOI] [PubMed] [Google Scholar]
- Lu SX, Tobin EM. Chromatin remodeling and the circadian clock: Jumonji C-domain containing proteins. Plant Signal Behav. 2011;6:810–814. doi: 10.4161/psb.6.6.15171. [DOI] [PMC free article] [PubMed] [Google Scholar]
- Mas P. Circadian clock function in Arabidopsis thaliana: time beyond transcription. Trends Cell Biol. 2008;18:273–281. doi: 10.1016/j.tcb.2008.03.005. [DOI] [PubMed] [Google Scholar]
- Thines B, Harmon FG. Four easy pieces: mechanisms underlying circadian regulation of growth and development. Curr Opin Plant Biol. 2011;14:31–37. doi: 10.1016/j.pbi.2010.09.009. [DOI] [PubMed] [Google Scholar]
- Sinclair I, Dunton J. Electronic and Electrical Servicing: Consumer and commercial electronics. 2. Elsevier, Burlington, MA; 2007. [Google Scholar]
- Chatterjee P, Mukherjee S, Chaudhuri S, Seetharaman G. Application Of PapoulisGerchberg Method In Image Super-Resolution and Inpainting. Comput J. 2009;52:80–89. [Google Scholar]
- Orfanidis S. Introduction to signal processing. Prentice Hall, New Jersey, USA; 1995. [Google Scholar]
- Fowler SG, Cook D, Thomashow MF. Low temperature induction of Arabidopsis CBF1, 2, and 3 is gated by the circadian clock. Plant Physiol. 2005;137:961–968. doi: 10.1104/pp.104.058354. [DOI] [PMC free article] [PubMed] [Google Scholar]
- B-h L, Henderson DA, Zhu J-K. The Arabidopsis Cold-Responsive Transcriptome and Its Regulation by ICE1. Plant Cell Online. 2005;17:3155–3175. doi: 10.1105/tpc.105.035568. [DOI] [PMC free article] [PubMed] [Google Scholar]
- Bar-Joseph Z, Gerber GK, Gifford DK, Jaakkola TS, Simon I. Continuous representations of time-series gene expression data. J Comput Biol. 2003;10:341–356. doi: 10.1089/10665270360688057. [DOI] [PubMed] [Google Scholar]
- Smith AA, Craven M. Fast multisegment alignments for temporal expression profiles. Comput Syst Bioinformatics Conf. 2008;7:315–326. [PMC free article] [PubMed] [Google Scholar]
- Vogel JT, Zarka DG, Van Buskirk HA, Fowler SG, Thomashow MF. Roles of the CBF2 and ZAT12 transcription factors in configuring the low temperature transcriptome of Arabidopsis. Plant J. 2005;41:195–211. doi: 10.1111/j.1365-313X.2004.02288.x. [DOI] [PubMed] [Google Scholar]
- Parodi S, Muselli M, Fontana V, Bonassi S. ROC curves are a suitable and flexible tool for the analysis of gene expression profiles. Cytogenet Genome Res. 2003;101:90–91. doi: 10.1159/000074404. [DOI] [PubMed] [Google Scholar]
- Raychaudhuri S, Stuart JM, Altman RB. Principal components analysis to summarize microarray experiments: application to sporulation time series. Pac Symp Biocomput. 2000;5:455–466. doi: 10.1142/9789814447331_0043. [DOI] [PMC free article] [PubMed] [Google Scholar]
- Gilmour SJ, Zarka DG, Stockinger EJ, Salazar MP, Houghton JM, Thomashow MF. Low temperature regulation of the Arabidopsis CBF family of AP2 transcriptional activators as an early step in cold-induced COR gene expression. Plant J. 1998;16:433–442. doi: 10.1046/j.1365-313x.1998.00310.x. [DOI] [PubMed] [Google Scholar]
- Maruyama K, Sakuma Y, Kasuga M, Ito Y, Seki M, Goda H, Shimada Y, Yoshida S, Shinozaki K, Yamaguchi-Shinozaki K. Identification of cold-inducible downstream genes of the Arabidopsis DREB1A/CBF3 transcriptional factor using two microarray systems. Plant J. 2004;38:982–993. doi: 10.1111/j.1365-313X.2004.02100.x. [DOI] [PubMed] [Google Scholar]
- Fowler S, Thomashow MF. Arabidopsis Transcriptome Profiling Indicates That Multiple Regulatory Pathways Are Activated during Cold Acclimation in Addition to the CBF Cold Response Pathway. The Plant Cell Online. 2002;14:1675–1690. doi: 10.1105/tpc.003483. [DOI] [PMC free article] [PubMed] [Google Scholar]
- Hundertmark M, Hincha DK. LEA (late embryogenesis abundant) proteins and their encoding genes in Arabidopsis thaliana. BMC Genomics. 2008;9:118. doi: 10.1186/1471-2164-9-118. [DOI] [PMC free article] [PubMed] [Google Scholar]
- Boerjan W, Ralph J, Baucher M. Lignin biosynthesis. Annu Rev Plant Biol. 2003. pp. 519–546. [DOI] [PubMed]
- Lacombe E, Hawkins S, Van Doorsselaere J, Piquemal J, Goffner D, Poeydomenge O, Boudet AM, Grima-Pettenati J. Cinnamoyl CoA reductase, the first committed enzyme of the lignin branch biosynthetic pathway: cloning, expression and phylogenetic relationships. Plant J. 1997;11:429–441. doi: 10.1046/j.1365-313x.1997.11030429.x. [DOI] [PubMed] [Google Scholar]
- Solecka D. Role of phenylpropanoid compounds in plant responses to different stress factors. Acta Physiologiae Plantarum. 1997;19:257–268. [Google Scholar]
- Athanasiou K, Dyson BC, Webster RE, Johnson GN. Dynamic acclimation of photosynthesis increases plant fitness in changing environments. Plant Physiol. 2010;152:366–373. doi: 10.1104/pp.109.149351. [DOI] [PMC free article] [PubMed] [Google Scholar]
- Hannah MA, Wiese D, Freund S, Fiehn O, Heyer AG, Hincha DK. Natural genetic variation of freezing tolerance in Arabidopsis. Plant Physiol. 2006;142:98–112. doi: 10.1104/pp.106.081141. [DOI] [PMC free article] [PubMed] [Google Scholar]
- Onda Y, Yagi Y, Saito Y, Takenaka N, Toyoshima Y. Light induction of Arabidopsis SIG1 and SIG5 transcripts in mature leaves: differential roles of cryptochrome 1 and cryptochrome 2 and dual function of SIG5 in the recognition of plastid promoters. Plant J. 2008;55:968–978. doi: 10.1111/j.1365-313X.2008.03567.x. [DOI] [PubMed] [Google Scholar]
- Yao J, Roy-Chowdhury S, Allison LA. AtSig5 Is an Essential Nucleus-Encoded Arabidopsis σ-Like Factor. Plant Physiol. 2003;132:739–747. doi: 10.1104/pp.102.017913. [DOI] [PMC free article] [PubMed] [Google Scholar]
- Swarbreck D, Wilks C, Lamesch P, Berardini TZ, Garcia-Hernandez M, Foerster H, Li D, Meyer T, Muller R, Ploetz L. et al. The Arabidopsis Information Resource (TAIR): gene structure and function annotation. Nucleic Acids Res. 2008;36:D1009–1014. doi: 10.1093/nar/gkm965. [DOI] [PMC free article] [PubMed] [Google Scholar]
- Soitamo A, Piippo M, Allahverdiyeva Y, Battchikova N, Aro E-M. Light has a specific role in modulating Arabidopsis gene expression at low temperature. BMC Plant Biology. 2008;8:13. doi: 10.1186/1471-2229-8-13. [DOI] [PMC free article] [PubMed] [Google Scholar]
- Ma S, Bohnert H. Integration of Arabidopsis thaliana stress-related transcript profiles, promoter structures, and cell-specific expression. Genome Biol. 2007;8:R49. doi: 10.1186/gb-2007-8-4-r49. [DOI] [PMC free article] [PubMed] [Google Scholar]
- Xin Z, Mandaokar A, Chen J, Last RL, Browse J. Arabidopsis ESK1 encodes a novel regulator of freezing tolerance. Plant J. 2007;49:786–799. doi: 10.1111/j.1365-313X.2006.02994.x. [DOI] [PubMed] [Google Scholar]
- Katoh A, Uenohara K, Akita M, Hashimoto T. Early steps in the biosynthesis of NAD in Arabidopsis start with aspartate and occur in the plastid. Plant Physiol. 2006;141:851–857. doi: 10.1104/pp.106.081091. [DOI] [PMC free article] [PubMed] [Google Scholar]
- Ruiz JM, Sanchez E, Garcia PC, Lopez-Lefebre LR, Rivero RM, Romero L. Proline metabolism and NAD kinase activity in greenbean plants subjected to cold-shock. Phytochemistry. 2002;59:473–478. doi: 10.1016/s0031-9422(01)00481-2. [DOI] [PubMed] [Google Scholar]
- Vanderauwera S, Zimmermann P, Rombauts S, Vandenabeele S, Langebartels C, Gruissem W, Inzé D, Van Breusegem F. Genome-wide analysis of hydrogen peroxide-regulated gene expression in arabidopsis reveals a high light-induced transcriptional cluster involved in anthocyanin biosynthesis. Plant Physiol. 2005;139:806–821. doi: 10.1104/pp.105.065896. [DOI] [PMC free article] [PubMed] [Google Scholar]
- Stracke R, Ishihara H, Huep G, Barsch A, Mehrtens F, Niehaus K, Weisshaar B. Differential regulation of closely related R2R3-MYB transcription factors controls flavonol accumulation in different parts of the Arabidopsis thaliana seedling. Plant J. 2007;50:660–677. doi: 10.1111/j.1365-313X.2007.03078.x. [DOI] [PMC free article] [PubMed] [Google Scholar]
- Korn M, Peterek S, Mock HP, Heyer AG, Hincha DK. Heterosis in the freezing tolerance, and sugar and flavonoid contents of crosses between Arabidopsis thaliana accessions of widely varying freezing tolerance. Plant Cell Environ. 2008;31:813–827. doi: 10.1111/j.1365-3040.2008.01800.x. [DOI] [PMC free article] [PubMed] [Google Scholar]
- Jonassen E, Lea U, Lillo C. HY5 & HYH are positive regulators of nitrate reductase in seedlings and rosette stage plants. Planta. 2008;227:559–564. doi: 10.1007/s00425-007-0638-4. [DOI] [PubMed] [Google Scholar]
- Zhang Y, Zheng S, Liu Z, Wang L, Bi Y. Both HY5 and HYH are necessary regulators for low temperature-induced anthocyanin accumulation in Arabidopsis seedlings. J Plant Physiol. 2011;168:367–374. doi: 10.1016/j.jplph.2010.07.025. [DOI] [PubMed] [Google Scholar]
- Sappl PG, Onate-Sanchez L, Singh KB, Millar AH. Proteomic analysis of glutathione S -transferases of Arabidopsis thaliana reveals differential salicylic acid-induced expression of the plant-specific phi and tau classes. Plant Mol Biol. 2004;54:205–219. doi: 10.1023/B:PLAN.0000028786.57439.b3. [DOI] [PubMed] [Google Scholar]
- Lin WH, Ye R, Ma H, Xu ZH, Xue HW. DNA chip-based expression profile analysis indicates involvement of the phosphatidylinositol signaling pathway in multiple plant responses to hormone and abiotic treatments. Cell Res. 2004;14:34–45. doi: 10.1038/sj.cr.7290200. [DOI] [PubMed] [Google Scholar]
- Vergnolle C, Vaultier M-N, Taconnat L, Renou J-P, Kader J-C, Zachowski A, Ruelland E. The cold-induced early activation of phospholipase C and D pathways determines the response of two distinct clusters of genes in arabidopsis cell suspensions. Plant Physiol. 2005;139:1217–1233. doi: 10.1104/pp.105.068171. [DOI] [PMC free article] [PubMed] [Google Scholar]
- Huang D, Wu W, Abrams SR, Cutler AJ. The relationship of drought-related gene expression in Arabidopsis thaliana to hormonal and environmental factors. J Exp Bot. 2008;59:2991–3007. doi: 10.1093/jxb/ern155. [DOI] [PMC free article] [PubMed] [Google Scholar]
- Kreps JA, Wu Y, Chang H-S, Zhu T, Wang X, Harper JF. Transcriptome changes for arabidopsis in response to salt, osmotic, and cold stress. Plant Physiol. 2002;130:2129–2141. doi: 10.1104/pp.008532. [DOI] [PMC free article] [PubMed] [Google Scholar]
- Tepperman JM, Hwang Y-S, Quail PH. phyA dominates in transduction of red-light signals to rapidly responding genes at the initiation of Arabidopsis seedling de-etiolation. Plant J. 2006;48:728–742. doi: 10.1111/j.1365-313X.2006.02914.x. [DOI] [PubMed] [Google Scholar]
- Lee J, He K, Stolc V, Lee H, Figueroa P, Gao Y, Tongprasit W, Zhao H, Lee I, Deng XW. Analysis of transcription factor HY5 genomic binding sites revealed its hierarchical role in light regulation of development. The Plant Cell Online. 2007;19:731–749. doi: 10.1105/tpc.106.047688. [DOI] [PMC free article] [PubMed] [Google Scholar]
- Larkindale J, Vierling E. Core genome responses involved in acclimation to high temperature. Plant Physiol. 2008;146:748–761. doi: 10.1104/pp.107.112060. [DOI] [PMC free article] [PubMed] [Google Scholar]
- Li J, Brader G, Palva ET. The WRKY70 Transcription Factor: A Node of Convergence for Jasmonate-Mediated and Salicylate-Mediated Signals in Plant Defense. Plant Cell Online. 2004;16:319–331. doi: 10.1105/tpc.016980. [DOI] [PMC free article] [PubMed] [Google Scholar]
- Hudson ME, Lisch DR, Quail PH. The FHY3 and FAR1 genes encode transposase-related proteins involved in regulation of gene expression by the phytochrome A-signaling pathway. Plant J. 2003;34:453–471. doi: 10.1046/j.1365-313x.2003.01741.x. [DOI] [PubMed] [Google Scholar]
- Kumagai T, Ito S, Nakamichi N, Niwa Y, Murakami M, Yamashino T, Mizuno T. The common function of a novel subfamily of B-Box zinc finger proteins with reference to circadian-associated events in Arabidopsis thaliana. Biosci Biotechnol Biochem. 2008;72:1539–1549. doi: 10.1271/bbb.80041. [DOI] [PubMed] [Google Scholar]
- Tepperman JM, Hudson ME, Khanna R, Zhu T, Chang SH, Wang X, Quail PH. Expression profiling of phyB mutant demonstrates substantial contribution of other phytochromes to red-light-regulated gene expression during seedling de-etiolation. Plant J. 2004;38:725–739. doi: 10.1111/j.1365-313X.2004.02084.x. [DOI] [PubMed] [Google Scholar]
- Khanna R, Shen Y, Toledo-Ortiz G, Kikis EA, Johannesson H, Hwang Y-S, Quail PH. Functional profiling reveals that only a small number of phytochrome-regulated early-response genes in arabidopsis are necessary for optimal deetiolation. Plant Cell Online. 2006;18:2157–2171. doi: 10.1105/tpc.106.042200. [DOI] [PMC free article] [PubMed] [Google Scholar]
Associated Data
This section collects any data citations, data availability statements, or supplementary materials included in this article.
Supplementary Materials
Figure S1: Time frames used to generate FFT results. Frame sizes and positions are shown in (A) and the contribution of each frame to the weighted average at each timepoint is shown in (B). Figure S2: Principal Component Analysis (PCA) Plots. Principal component analysis (PCA) plots for the original data (A) and the first components of the clock-frequency and treatment-frequency data (B) are shown. COS-upregulated genes are shown in black circles, COS-downregulated genes (which are not analyzed in detail here) are shown in white diamonds and all other genes are shown as grey dots. Figure S3: The original, mean-shifted, PRIISM-reconstructed and Butterworth-filter reconstructed gene expression patterns ofAtGolS3. (A) The original (black) and mean-shifted (grey) expression values of AtGolS3. (B) Comparison between the treatment-frequency-reconstructed gene expression patterns for AtGolS3 using PRIISM (Black line) and using a fifth-order Butterworth low-pass filter (grey line). Figure S4: The frequency spectra of the original, the PRIISM-reconstructed and the Butterworth-filter reconstructed gene expression patterns ofAtGolS3. (A) The Frequency Spectrum of the original gene expression pattern of AtGolS3. (B) Comparison of the frequency spectra of AtGolS3 after processing using PRIISM (white circles) and the fifth-order Butterworth low-pass filter (grey diamonds). The original treatment-frequency spectrum of AtGolS3 is also shown (red bars). Figure S5: The Bode plot of a fifth-order Butterworth low-pass filter forAtGolS3.