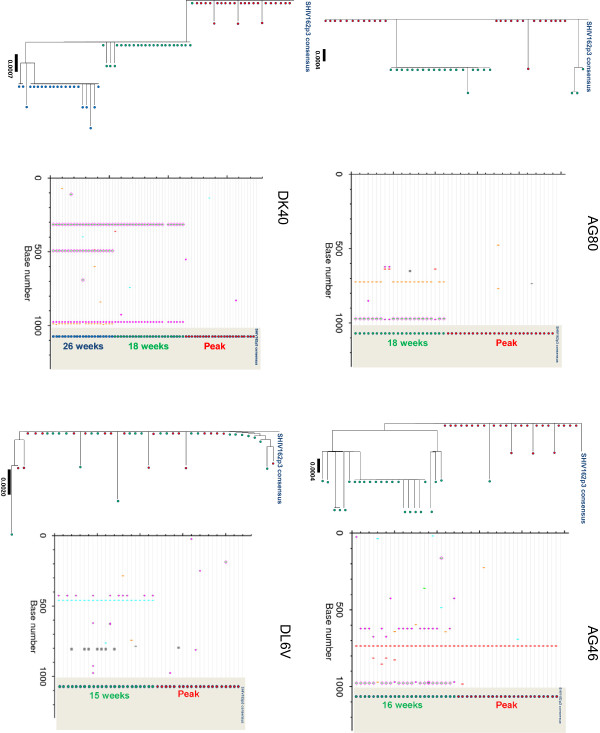
Figure 5 .
Neighbor-joining and highlighter analysis ofenvsequences generated by single genome amplification in PrEP breakthrough infections. Animals AG80 and AG46 were infected during daily PrEP with FTC, and animals DK40 and DL6V were infected during intermittent PrEP with Truvada. Nucleotide changes are colored as follows: A, green; T, red; G, orange; C, light blue. Gaps are indicated in gray. Circles denote APOBEC-mediated G-to-A hyper mutation. Diamonds represent G-to-A conversions.

